Dow Theory is a financial theory created by Charles Dow that states the stock market moves in predictable trends. Dow Theory includes six philosophical tenants and some elements of sector rotation. Traders often use Dow Theory in conjunction with technical analysis to time the markets.
The History of Dow Theory
Charles Dow created Dow Theory. Dow’s work occurred at the end of the 19th century and in the first few years of the 20th century (he died in 1902).
Dow found that the market moved in trends. Dow died before publishing a comprehensive description of his theory, but he described its main components in a series of 255 editorials in the Wall Street Journal. William Peter Hamilton, Robert Rhea, and E. George Schafer organized the editorials posthumously into Dow Theory.
Dow studied the movement of trends using two indices: industrials and transportation. He then used these averages as the foundation for his analysis of significant patterns of market trends. While the main components of Dow Theory have remained relatively consistent, the application has changed a bit, and the theory has continued to develop.

For example, in Dow’s time, the industries that “drove” the market were a bit different. Dow put a large emphasis on railroads, which may not quite as applicable today; however, raw materials and finished goods still need to be transported. This is why the Bureau of Transportation Statistics confirms the transportation index as a leading indicator of the economy.
How Does Dow Theory Work?
To describe how trends in the market work, Dow used an analogy of the ocean’s movements on a beach.
Dow’s analogy had three components — essentially multiple timeframe analysis:
The first was the tide. The tide was the long-term market trend.
Waves were smaller trends that could last for a while but did not last as long as the tide. Waves could reinforce the movement of the tide or could move against it.

Finally, there were ripples. Ripples had the least impact on long-term market trends and were instead seen simply as daily fluctuations in the markets. Dow believed that by taking the time to familiarize yourself with the past patterns, you could make predictions about future movements.
We’ll dive into this deeper shortly, but the key takeaway is to understand that at its core, Dow Theory is a multiple timeframes trend following system.
The Six Dow Theory Principles
There are six key tenets of Dow Theory:
- The Market Discounts Everything
- There are Three Types of Trends
- Primary Trends Move Through Three Phases
- Trends Require Market Confirmation
- Trends Require Volume Confirmation
- Trends Continue Until a Clear Reversal
We’ll now look at what each of these means and how it applies to the markets.
The Market Discounts Everything
The first concept of Dow Theory is that any asset’s price considers all available information and future expectations. This concept is also known as the efficient market hypothesis (EMH). EMH states that all the information relevant to pricing a stock is understood and incorporated into the price based on buying and selling activity. While every individual investor may not know all of the available information, the market as a whole (the combination of all the investors) does.
This means that a stock is always trading at its fair market value, and finding “overvalued” or “undervalued” shares is impossible as they don’t exist.
In this case, the best option for traders who want to outperform the market is to take advantage of market trends.
And while I don’t believe in EMT, one thing is for sure:
The trend is your friend.
There are Three Types of Trends
The second concept of Dow Theory is that there are three different kinds of trends.
Let’s go back to the analogy of the ocean’s movements on a beach to understand this.
First, there are primary trends. In the ocean analogy, this is the tide. Bull and bear markets are examples of primary trends. These are the most important trends.
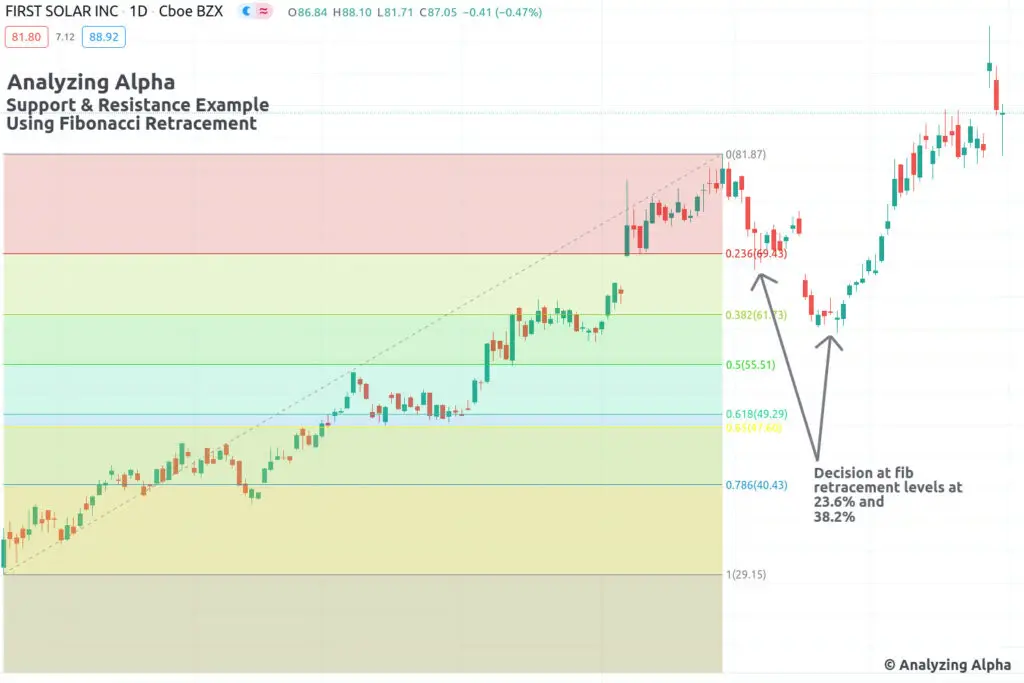
Next, there are secondary trends. Secondary trends are like the waves of an ocean. These are market trends that could last anywhere from three weeks to three months. While still important, secondary trends are not as important as the primary trend. Traders can think of secondary trends as Fibonacci extensions and Fibonacci retracements.
Finally, there are minor trends. Minor trends last for less than three weeks. These minor trends are like ripples and are the least essential trend type in Dow Theory.
A vital aspect of this concept is that not all trends are moving in the same direction. Just because a wave is pulling back does not mean that the tide is receding. Similarly, just because a secondary market trend is bearish does not mean that the longer-term market trend is necessarily bearish.
Today, many traders regularly implement Dow Theory using multiple timeframe analysis using the weekly, daily, and hourly chart periods.
Primary Trends Transition Through Three Phases
The third concept we’ll look at that makes up Dow Theory states that primary trends consist of three phases. These three phases have different names, depending on whether the primary trend is bullish or bearish.
The essential idea to understand is the primary trend cycles in three phases, with smart money leading the way.
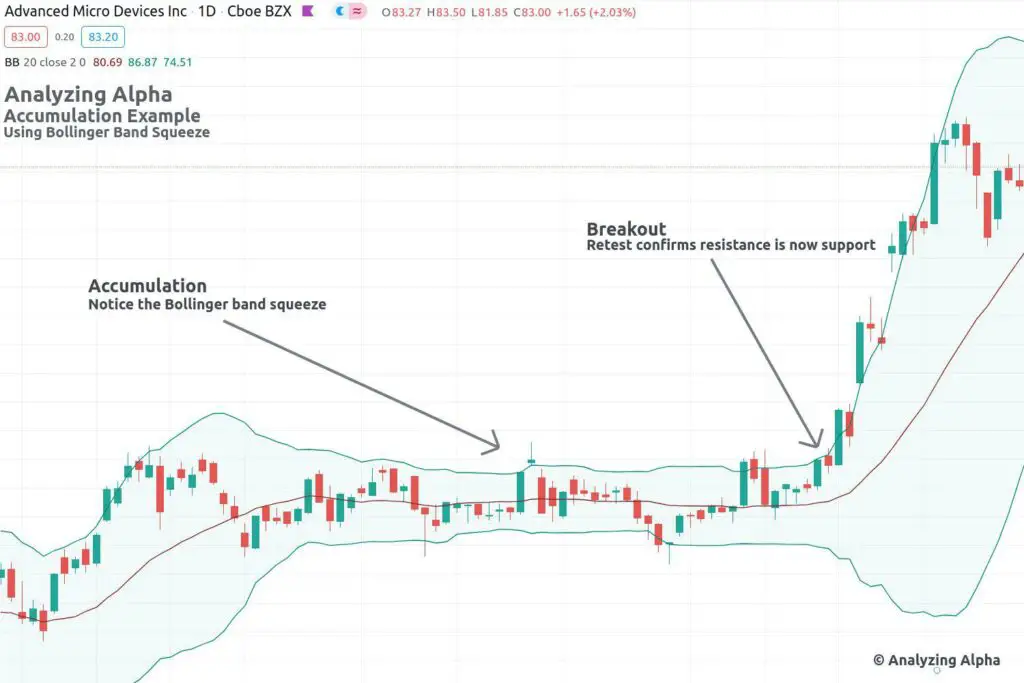
The accumulation phase is the first phase if the primary trend is bullish. This phase consists of trendsetting investors. These are the investors who realize that the previous bear market appears to be ending and invest accordingly. Sideways action with reduced volatility characterizes accumulation and often leads to breakouts.
The public participation phase happens next. This second phase occurs when prices begin increasing, and financial and business news begins improving. At this point, more investors become bullish, and we see prices start to rise.
The distribution phase is the final phase. At this point, the general sentiment is quite bullish – the media is likely to report more positively on financial and business news, prices are high, the volume is high, and public participation in the markets is at a peak. The reason this is called the distribution phase, though, is that those same investors who invested in the bull market in the first phase typically realize that the market trend has reached its peak. They begin distributing (selling) their shares before everyone else realizes the bull market has reached its end.
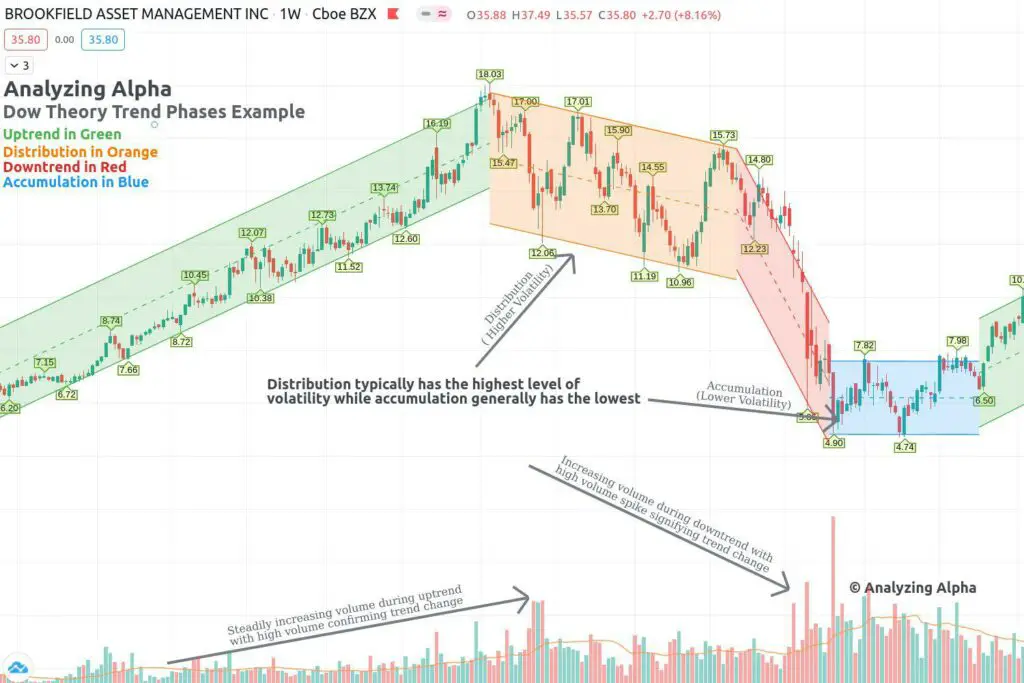
Like accumulation, distribution typically has sideways price action, but it typically occurs at the end of an uptrend with much more volatility.
If the primary trend is bearish, the phases occur in reverse, with distribution being the first phase. This makes sense as the market phases cyclical.
Trends Require Index Confirmation
The fourth concept of Dow Theory we’ll discuss is about how to confirm trends through indices. Dow Theory states that there must be confirmation from two indices to be an established trend.
The specific indices that Dow used were the Dow Jones Industrial Average (DJIA) and the Dow Jones Transportation Average (DJTA) (Dow was a co-founder of Dow Jones & Company, which created these indices).
Dow’s believed that if businesses were doing well, transportation (specifically railroads) would also be doing well. Therefore, the signals from the DJIA and DJTA should confirm each other. If they did not, for example, if the industrial average increased, but transportation was not doing well, the trend would likely not continue. Conversely, if transportation was growing, but businesses were struggling, there was no apparent, consistent trend.
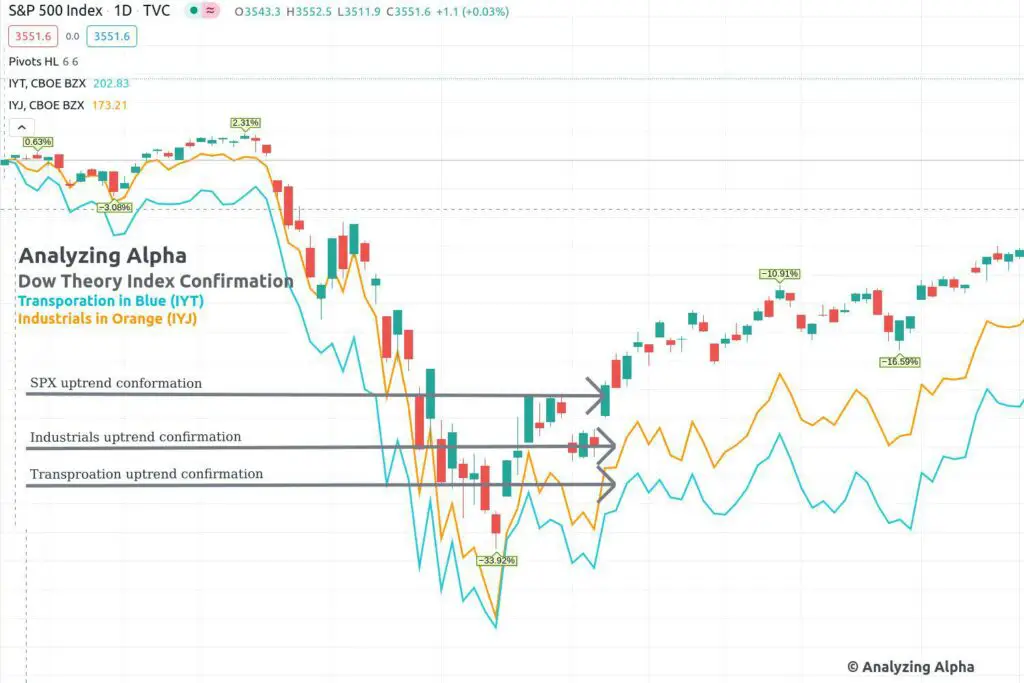
See the modified example below using the S&P 500 with industrials and transportation to confirm the trend.
As you can likely imagine, this approach’s specifics are not nearly as applicable as they were at the turn of the century. While railroads no longer determine the validity of a trend, the basic concept of using multiple data points to confirm a trend is still absolutely applicable today.
Day traders frequently use an extension of Dow’s idea:
Analyzing the percentage of sectors making new lows is a typical bearish entry filter. There’s a big difference in the result going short in a sell-off vs. sector rotation.
Trends Require Volume Confirmation
According to Dow Theory, index confirmation is not sufficient to establish the existence of a trend. There must also be volume confirmation.
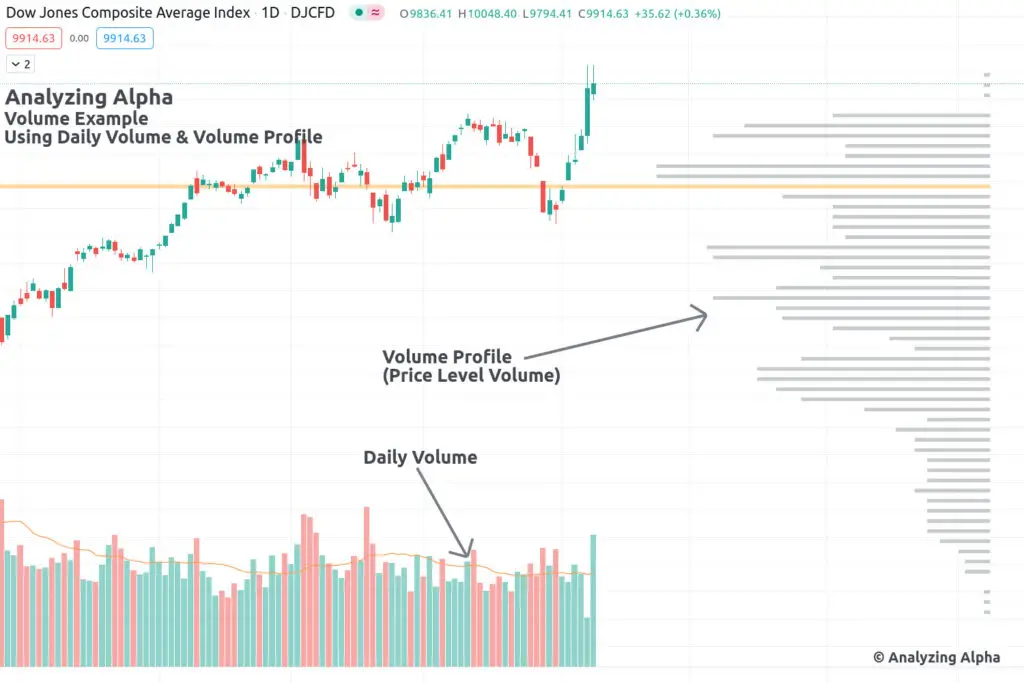
The volume looks different when confirming an uptrend and a downtrend. For an uptrend, the volume should increase as prices increase. When prices decrease, the volume should be lower. A downtrend confirmation is the reverse; falling prices should align with growing volume, and increasing prices should see comparatively low volume.
This may sound a bit confusing, but let’s think of it another way. When volume is high, there is a higher level of participation. Essentially, more traders are voting on the market direction.
You can analyze volume to confirm trends from both a daily volume and price level (volume profile) perspective.
Additionally, while Dow did consider volume confirmation important, he viewed it as a secondary indicator compared to index confirmation. Meaning he first looked for trends confirmed by indices and only after that considered whether or not volume confirmed the trend.
Trends Continue Until a Clear Reversal
The final key concept of Dow Theory that we’ll look at is reversals. According to Dow Theory, a trend continues until there is a clear reversal.
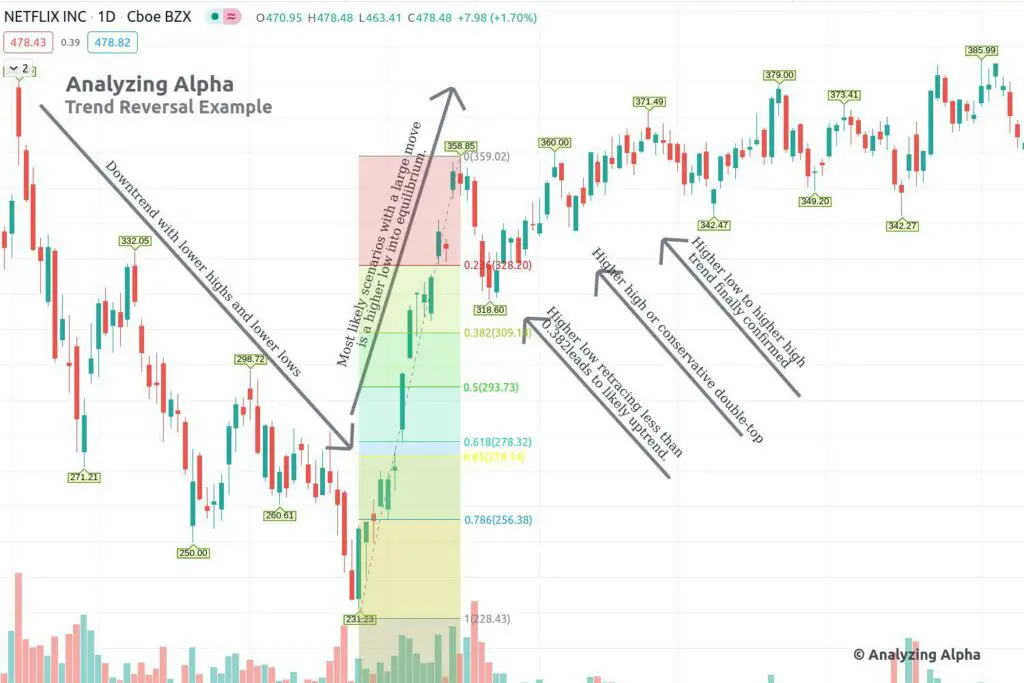
A reversal occurs when a primary uptrend fails to reach both higher highs and higher lows in an uptrend, and the price is no longer reaching lower lows and lower highs in a downtrend.
Most reversals are among the most challenging technical analysis areas to predict accurately, and Dow Theory calls for caution. According to Dow Theory, it is best to wait until there is clear confirmation that a trend reversal has occurred.
Notice I said most — When there is a significant price move, it shifts the probabilities in favor of an equilibrium (distribution/accumulation) pattern. On these types of price moves, it’s often better to enter before confirmation. Waiting for confirmation on this type of price action can lead to a lot of missed opportunities.
For the remaining majority, part of the complexity of reversals is the difficulty of disentangling the three types of trends.
For example, when prices in a primary bear market begin to increase, it could be the reversal of that primary trend, or it could be that a secondary trend is experiencing an uptrend even though the long-term trend remains bearish.
The key takeaway from this is that when things get choppy, bias your trades in the direction of the previous trend until proven otherwise.
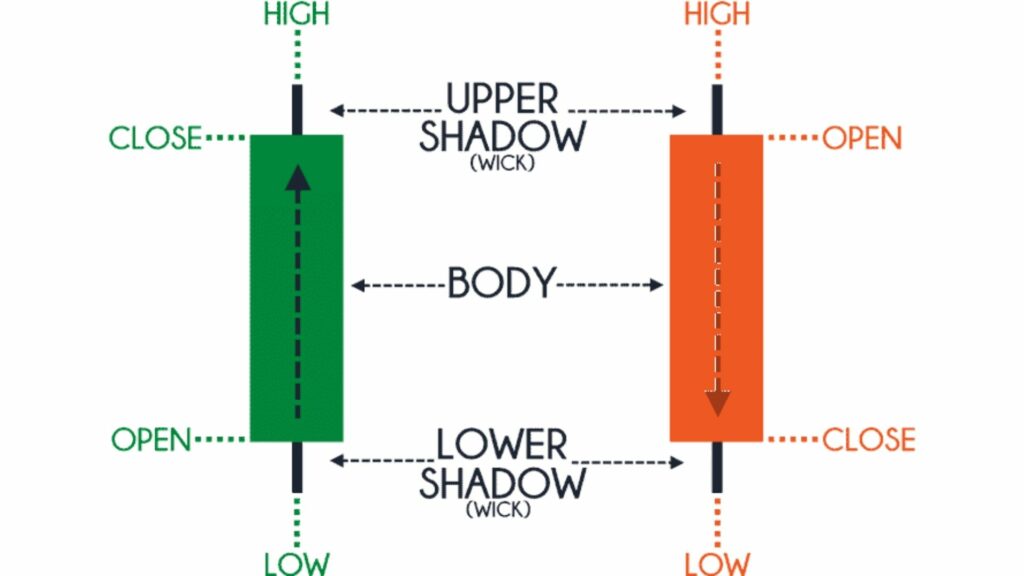
Dow Theory and Closing Prices
Dow only relied on closing prices. He saw no reason to pay attention to the daily gyrations of the indices he tracked. Dow believed that the close was the essential price of the day and used these prices for signals.
Whether you choose to base your analysis on closing prices or intraday prices is up to you. But whichever choice you make, it’s worth considering the context in which Dow established his rationale.
The world of trading in the 1800s looked dramatically different than it does today. Technology enables us to place trades at speeds unimaginable back then, and the data is much more accessible.
Is Dow Theory Still Relevant?
Dow Theory is a popular trading system, but you may be wondering how relevant a system created over 120 years ago is in today’s markets.
Interestingly enough, Dow did not intend for Dow Theory to become a trading system, though that is indeed what it has become.
Determining whether Dow’s theory is still relevant today depends mainly on how we define relevant. If we choose to read Dow Theory exactly as Dow originally intended it, some areas are less relevant today. A perfect example is Dow’s emphasis on railroads, which play a different role today than they did in the 1800s. On the other hand, if we choose to look at the Dow Theory concepts, they are still relevant and used by many traders today.
This reminds me of one of my favorite quotes from billionaire hedge-fund manager Stanley Druckenmiller:

Dow Theory Downsides
Dow Theory is excellent for riding long-term, primary trends; however, the theory can fall short when price action doesn’t confirm the trend quickly, leading traders to miss much of the move.
Additionally, there’s a lot of subjectivity when distinguishing the various phases of the trend, making trend identification difficult.
Dow designed his theory as an indicator of the economy, not as a trading system. This leads to multiple interpretations of how best to trade Dow Theory.
Finally, Dow Theory is a misnomer. Dow Theory isn’t a theory at all. It’s anecdotal evidence based on Dow’s experiences, so there’s little statistical evidence supporting the theory; however, there have been attempts to examine Dow’s Theory out-of-sample.
The Dow Theory Performance
While there have been multiple tests to determine the efficacy of Dow Theory, see Cowles 1934 and William Peter Hamilton’s book, a recent paper utilizing neural nets reconstructing Dow Theory performance yields alpha.
In the study, Dow Theory underperformed during bull markets and outperformed during bear markets.
Additionally, Dow Theory outperformed buy-and-hold by about 2% per year with much higher risk-adjusted returns. Over the last 18 years, however, Dow Theory has underperformed by 2.6% annually but outperformed on a risk-adjusted basis.
DowTheoryInvestment.com, while potentially biased based on the domain name, has an in-depth review of Dow Theory performance.
The Bottom Line
Whether you’re new to technical analysis or you’re an experienced trader, understanding the basic concepts of Dow Theory is an excellent foundation for the theory of market movements and multiple timeframe analysis.
For further reading, William Hamilton’s The Stock Market Barometer, published in 1922; Robert Rhea’s The Dow Theory, published in 1932; and Richard Russell’s The Dow Theory Today, have continued to develop on Dow’s theory.