Implied volatility is the market’s expected magnitude of an asset’s future price moves. Implied volatility is calculated by taking the current market price of an option, entering it into an option pricing model, such as Black-Scholes, and backing out the expected volatility.
Implied volatility is a complex concept that I aim to help clarify in this post.
Understanding Implied Volatility
Let’s begin by talking about how volatility and implied volatility differ. Standard volatility, also known as historical volatility or realized volatility, quantifies the fluctuations in the price of a security. Historical volatility tells you about the volatility that has already occurred. In contrast, implied volatility, also known as projected volatility, is a forecasting tool that predicts the likelihood of a security’s future volatility based on the market’s expectation.
Sigma (σ) is often used as a symbol for implied volatility, but implied volatility is conveyed as a percentage. This percentage represents the likelihood of one standard deviation move over a specific period, typically one year, though other periods may be used.
For example, let’s assume the implied volatility of an options contract for stock ABC is 15%. This means that the market believes that one standard deviation in ABC’s price is 15% of its current price.
Let’s take a quick refresher on standard deviation before we go any further since understanding implied volatility requires an understanding standard deviation.
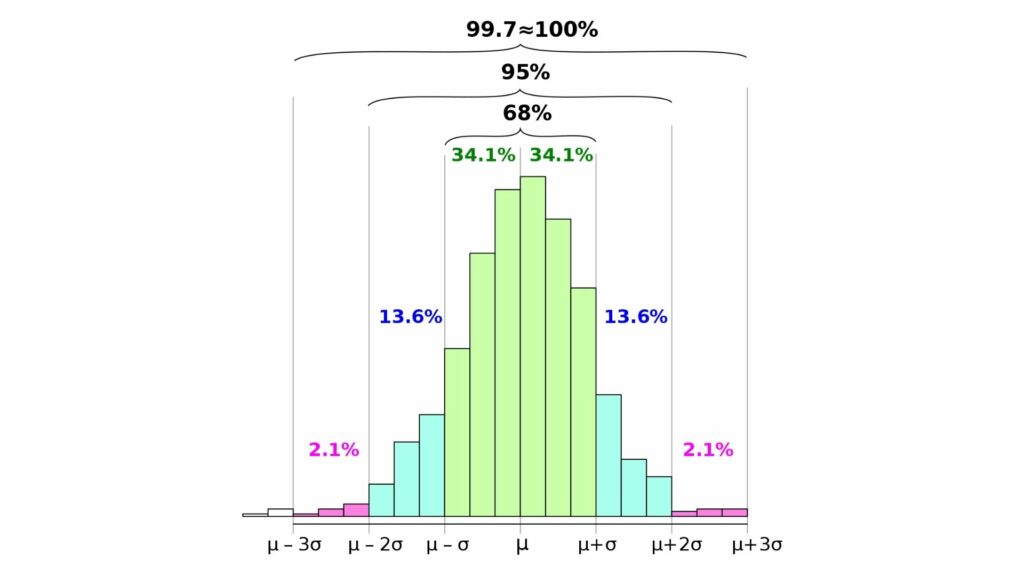
In a normal distribution, one standard deviation above and below the mean encompasses 68% of values. This means there’s a 68% chance a value will fall within one standard deviation (either above or below the mean). Two standard deviations encompass 95% of values, and three standard deviations contain 99.7% of values. There’s a 95% chance a value will fall within two standard deviations (either above or below the mean) and a 99.7% chance a value will fall within three standard deviations (again, either above or below the mean).
This is the 68-95-99.7 rule.
Let’s flesh out our example above more now that we’re clear on standard deviation.
ABC’s current price is $100, and the implied volatility is 15%. One standard deviation is $15 (15% of $100). If no period is mentioned, you can typically assume it is a year. So, over the next year, according to what market participants are paying today, there’s a 68% chance that the stock price will be between $85 and $115.
Implied volatility is a helpful tool; however, it’s not guaranteed. Stock returns are not normally distributed, causing standard deviation assumptions to break down; regardless, implied volatility can help you make informed and educated decisions about your trades as a forecasting tool.
Implied Volatility and Options
Now that we understand the basics of implied volatility, let’s look at its use in options.
Options contracts give you the option, but not the obligation, to buy or sell an asset—the two types of options are call and put options.
- A call option allows you to buy an asset at a specific price within a specified period.
- A put option will enable you to sell an asset at a particular price within a certain period.
Options differ from futures because with futures, you must buy or sell the asset if it reaches the specified price, but as the name implies, you have the option, not the obligation, to buy or sell with an options contract.
Implied volatility is a critical factor in understanding the price of an options contract. A higher implied volatility means a higher premium (the current price of an options contract), while lower implied volatility means a lower premium price.
This makes sense. Let’s say you want the option to buy a security in the future. Remember, someone has to sell you the option, and the seller will want a higher price if more of their money is at risk or there’s a higher likelihood that the option will be exercised.
The implied volatility of an options contract is constantly changing, though these changes are typically relatively minor. But there are some instances when giant leaps in the implied volatility of an options contract may occur. These instances usually result from drastic changes in the perceived level of risk in the market. For example, when dramatic and sudden drops in the stock market occur, there is increased uncertainty, which leads to sudden increases in implied volatility.
Calculating Implied Volatility
Now that we understand the basics of market volatility and its impacts on options contracts, let’s look at how it’s calculated. This is where things can get a bit more complicated.
There are a few different ways to calculate implied volatility, but the Black-Scholes formula is the most common. This formula is so important to options pricing that options trading only took off after Black, Scholes, and Merton developed the model in 1973.
The Black-Scholes formula uses the price of the underlying asset, the strike price, the option’s expiration date, the [risk-free rate/risk-free-rate), and the volatility. The calculations for this model can be intimidating, but thankfully there are plenty of calculators and excel spreadsheets that will work for you.
Interpreting Implied Volatility
A common question among traders newer to implied volatility is – what is a “good” implied volatility rate. The problem is that this is similar to asking what a “good” stock price is. There may be a more typical range, but a specific number or a number within a particular range is not innately “good” or “bad” when looking at a specific stock. There are two reasons for this.
The first reason why there is no good or bad implied volatility rate is that the appropriate number for you will depend on your strategy. Implied volatility is all about the market’s expectations of future price fluctuations. Lower implied volatility is often preferable if you’re looking for less risk and a lower chance of price fluctuations. On the other hand, if you’re attempting to take advantage of significant price fluctuations and are comfortable with higher risk, higher implied volatility may be preferable.
The other reason why it’s almost impossible to define a “good” implied volatility rate is that volatility changes. These changes happen on an individual security level, but they also occur at the market level. When the market is bearish or uncertain, and investors believe stock prices will decrease, implied volatility typically increases.
When the market is bullish and less concerned about the economy and investors, believe stock prices will rise, implied volatility typically decreases. Therefore, the same implied volatility rate may appear high compared to similar securities when the market is bullish (since implied volatility generally is lower). Still, during a more bearish market, the number may appear low (since implied volatility is typically higher during this time).
Advantages and Disadvantages of Implied Volatility
We’ll conclude our discussion of implied volatility with a quick look at the advantages and disadvantages of using this metric.
The most significant advantage of implied volatility is that it quantifies the market’s perception of risk. Options trade for ETFs and securities, so implied volatility can quantify market, sector, industry, and security risk.
As far as disadvantages, one of the biggest is that implied volatility does not indicate the direction in which the security is expected to move; only that movement is expected. Another disadvantage is that, like most market models, it doesn’t quite fit reality — market prices are not normally distributed, and this fact shows up at the worst times.
The Bottom Line
Implied volatility is the expected price moves around security based on what options traders are paying today. And while implied volatility is not perfect, it is a great way to quantify market, sector, industry, and security risk.