TradingView’s Pine Script is a lightweight, easy-to-learn programming language for creating custom trading indicators and strategies directly on TradingView charts. This comprehensive Tradingview Pine Script tutorial provides everything you need to go from Pine Script beginner to expert
You’ll start with the basics like variables, operators, and conditional logic. Then level up your skills with practical walkthroughs for building indicators and strategies. The guide includes mini-project tutorials for testing popular techniques like moving average crossover, RSI/MACD, and volatility breakout strategies.
Follow along to:
- Learn Pine Script fundamentals with examples
- Create custom indicators for technical analysis
- Backtest and evaluate trading strategies
- Optimize parameters and enhance profitability
- Implement strategies based on real price data
Whether you’re new to programming or an experienced quant, this Pine Script guide provides the essential knowledge for algorithmic trading. The step-by-step tutorials and examples using real price data will give you the hands-on practice to start coding your own profitable strategies today.
What is TradingView Pine Script?
TradingView Pine Script is a programming language developed by TradingView for creating custom trading indicators and strategies on the TradingView platform. Pine Script is lightweight and easy-to-understand language focusing on interacting with TradingView’s charting platform. Pine Script runs on TradingView’s servers, differentiating it from client-side programming languages.
Pine Script Pros and Cons
Following are some pros and cons of the Pine Script language.
Pros:
- Simple and easy-to-learn syntax
- It doesn’t require downloading anything on your computer.
- The basic version is free to use. Trial versions are available for Pro, Pro+, and Premium plans.
- Large user community.
- It provides built-in data and third-party integrations with Nasdaq Data Link.
Cons:
- Domain-specific language – works only in TradingView.
- Lack of support for external libraries such as the ones used for deep learning.
- You cannot apply Pine Script on the data not available in TradingView.
TradingView Pine Script Price Plans
TradingView provides various subscription plans to cater to different needs. The basic plan is free and offers ample resources for learning and exploring for beginners. If you’re seeking more advanced features, TradingView offers three paid plans: Pro, Pro+, and Premium.

Getting Started with TradingView Pine Script
Let’s write your first Pine Script code. To do so, sign up with a TradingView account, open a chart of your favorite security, and write Pine Script code in the Pine Editor.
Signing up with Tradingview
Go to the TradingView website, click the profile avatar from the top right corner of the Window, and click “Sign in.”

You will see several login options that you can use to log in if you have already signed up with TradingView. Otherwise, click the “Sign up” link at the bottom of the screen.

TradingView Browser vs. Desktop
TradingView is a website that you can open in the browser of your choice. TradingView also offers a desktop version, which is also technically a browser designed explicitly for TradingView.
I suggest the TradingView browser version for Pine Script beginners. That way, you will not have to download anything. For intermediate and advanced users, the TradingView desktop is recommended as it is faster and offers native multi-monitor support.
This article will show Pine Script examples in the TradingView browser version.
Working with Pine Editor
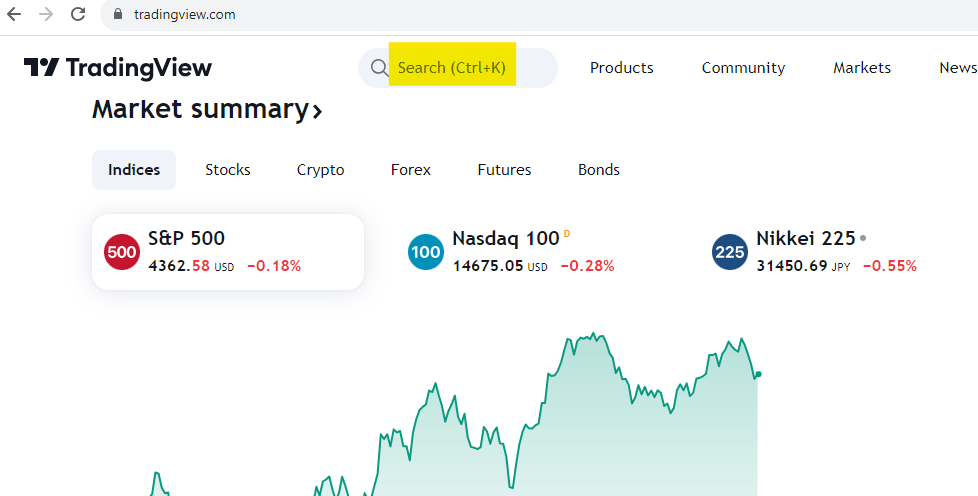
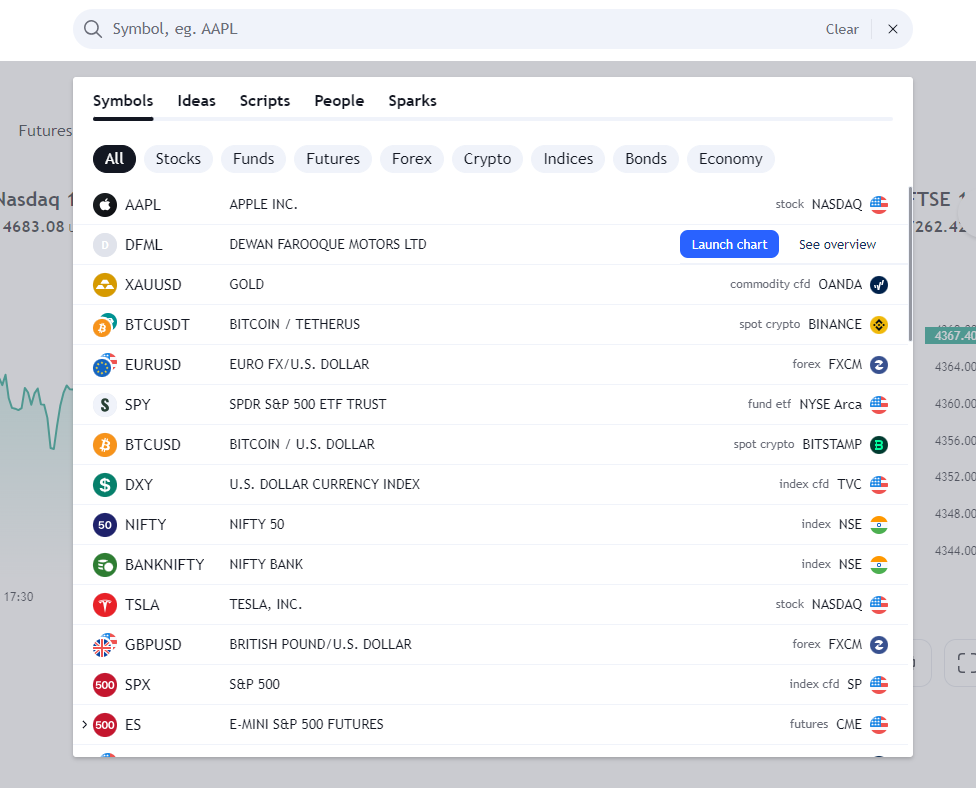
Log in to your TradingView account, and in the search bar, search and click the symbol of the security you want to track.
You will see a candlestick chart representing your selected security’s open, high, low, and closing values.
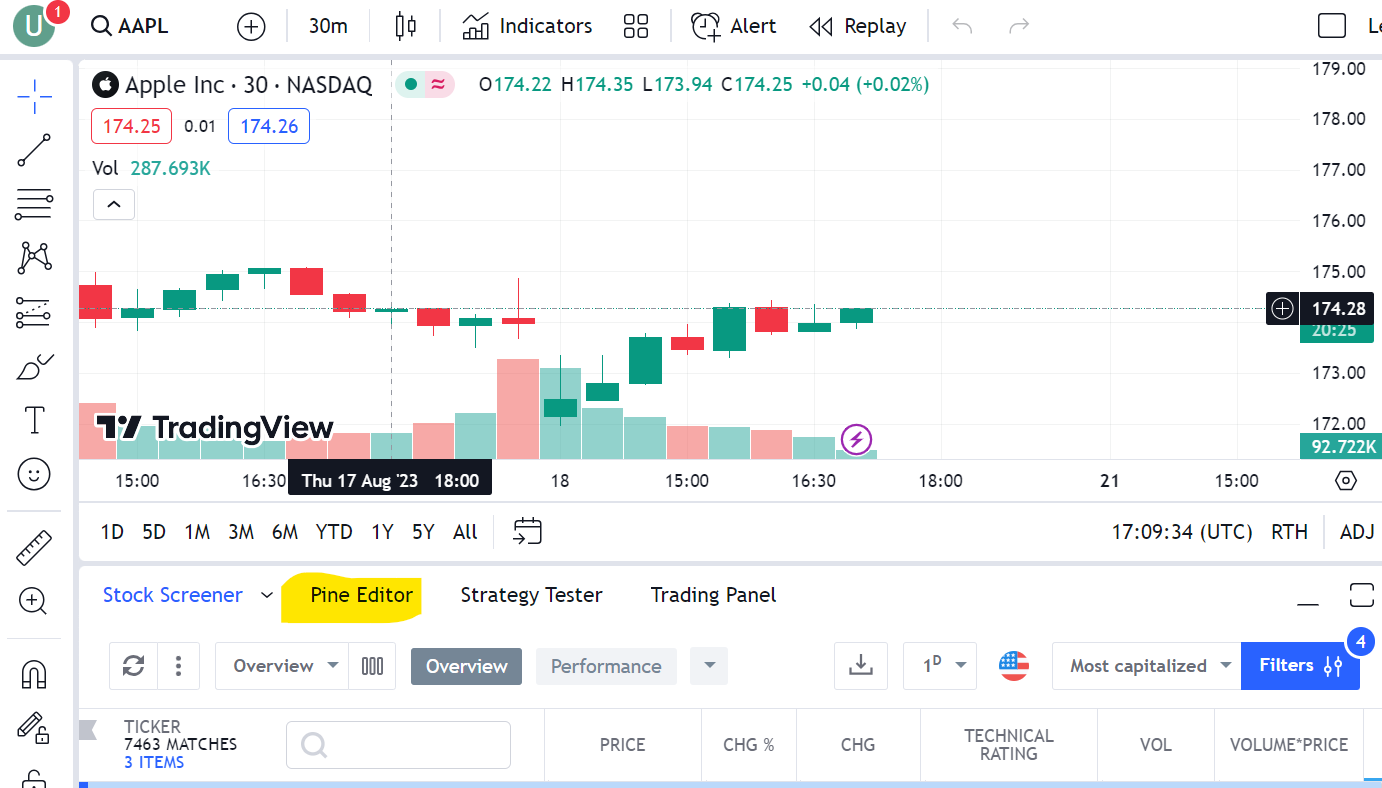
Click the “Pine Editor” button at the bottom of your chart (next to “Stock Screener”) to open the Pine Script editor.
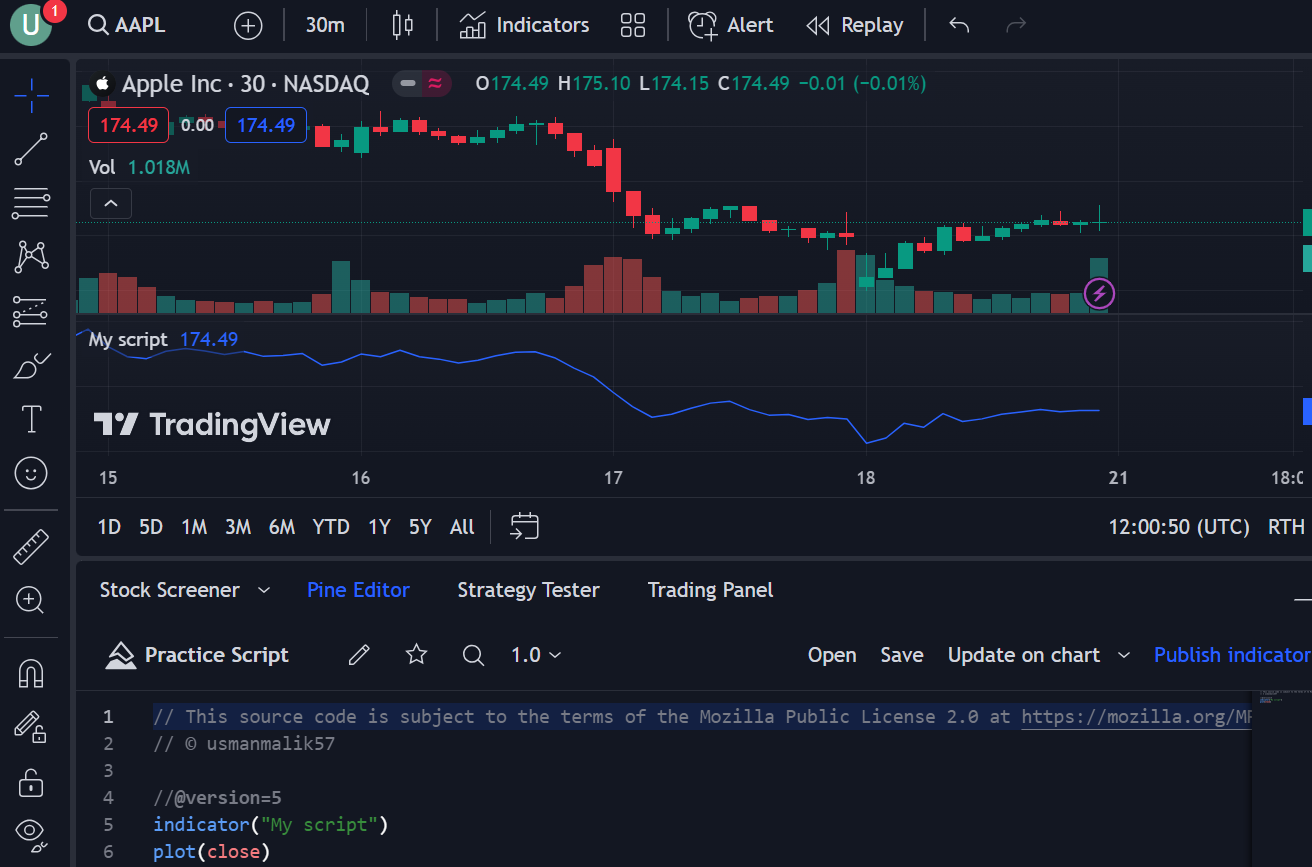
The following window will open where you can see some default code. This is your Pine Editor, where you will write all your Pine Script code.
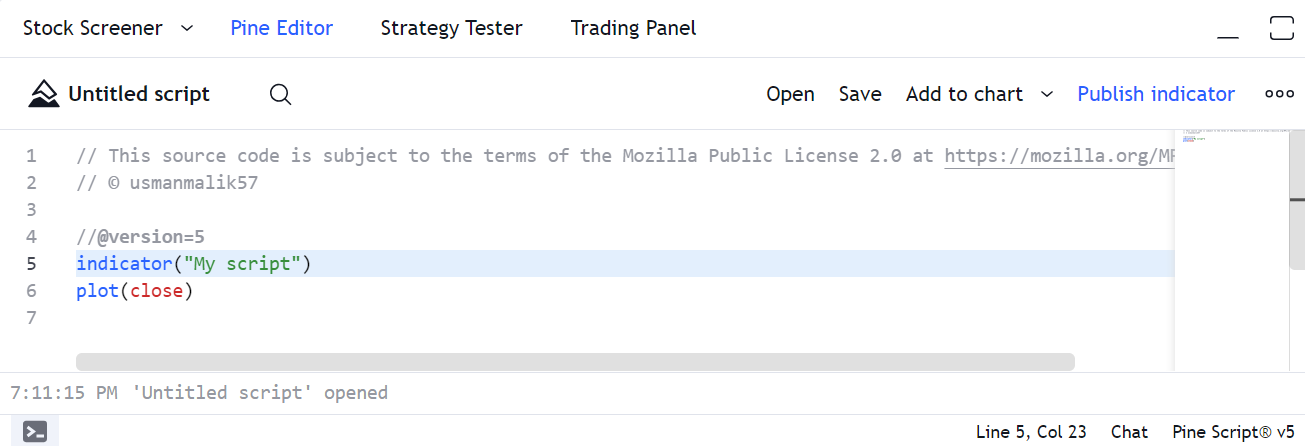
Let’s see line-by-line what this default script is doing.
Line 1 contains a comment that explains the licensing agreement for using the code. The second line also includes a comment containing the author name of the code, which by default is your username. The Pine Script compiler ignores the comments on lines 1 and 2. They are only there for conveying information to the code reader. Line 4 contains an annotation comment telling the compiler about the Pine Script version for code compilation. If you do not specify the version, the Pine Script compiler will use version 1.0. Unlike simple comments, annotation comments convey information to compilers.
Line 5 tells the compiler that the script will create an indicator named “My script.” The compiler will import all namespaces helpful in creating an indicator. You will see indicators in much more detail in a later section.
Line 6 calls the plot() function to plot the closing price of the default security.
With these three lines of code (lines 4,5 and 6), you can create a bare minimum executable Pine Script code.
Executing a Code in Pine Script Editor
To execute a Pine Script code, click the “Add to chart” button from the top right menu of the Pine Editor.
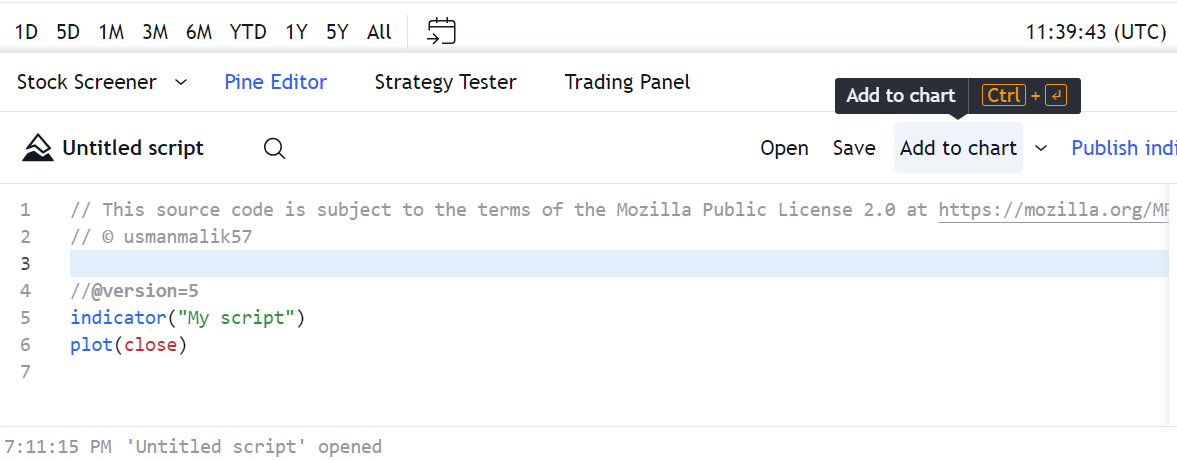
Under your main chart, you will see a data window containing a plot for the indicator you created.
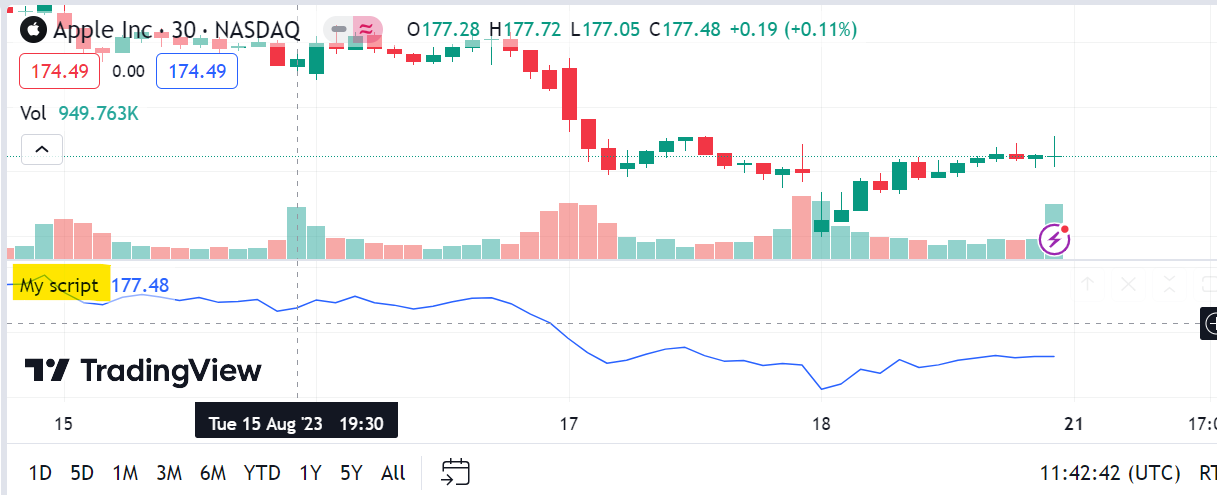
Click the “Untitled script” button to rename and save the script. A dialog box will appear where you can rename your script. Click the “Save” button to save your script.
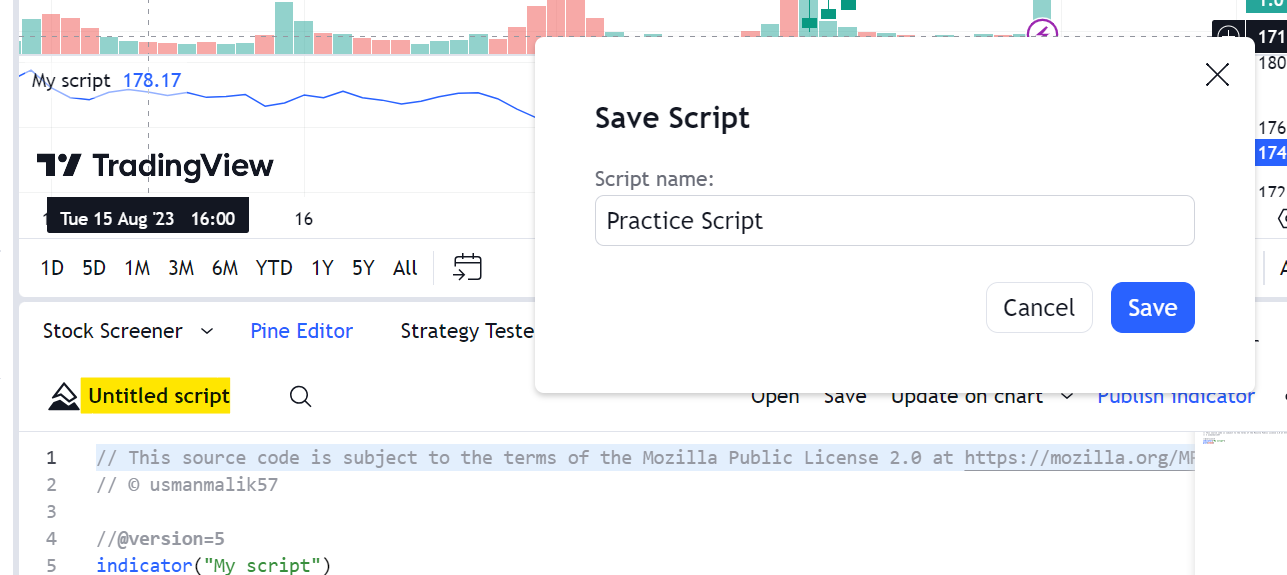
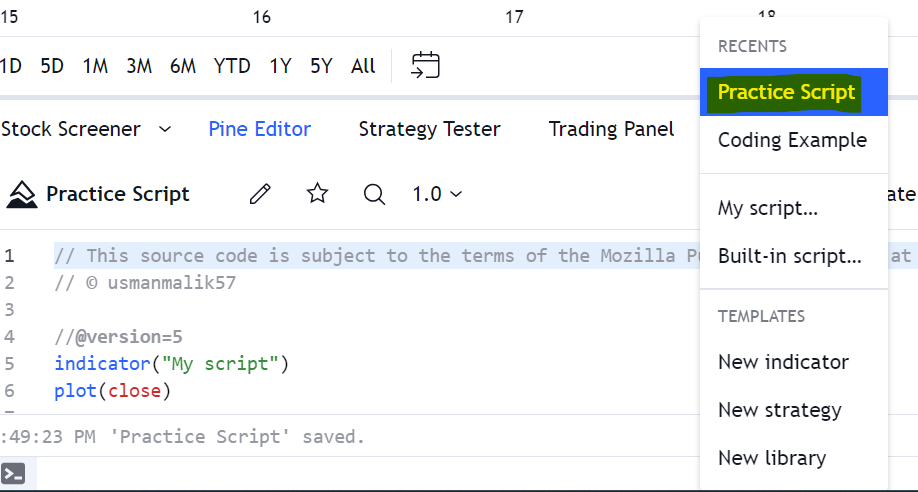
Click the “Open” button from the top right menu in the Pine Editor to see a list of all your saved scripts.
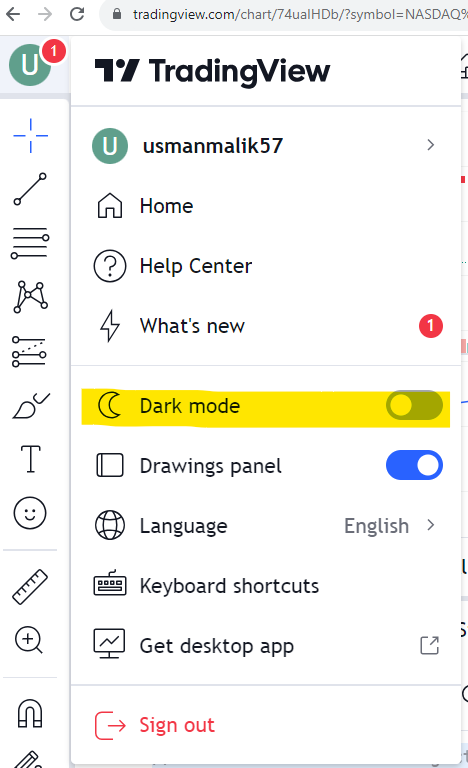
In the upcoming sections, we will execute all the code in TradingView’s dark theme, which you can enable by clicking your profile settings from the top left corner of the TradingView dashboard.
We will go into the details of indicators and plots in a later section. But first, I will explain the basic building blocks of the Pine Script language.
Pine Script Language Fundamentals
Pine Script Syntax is very similar to Python. However, it fundamentally differs from Python in how it compiles the code.
How Pine Script Compiles Code?
Unlike most other programming languages, where a code snippet is a standalone entity, a Pine Script code is applied on each bar or candle stick in your chart. The code runs in an unseen loop that iterates through all the bars in your chart, performs a calculation, and returns a value.
For instance, the following script creates a line plot using 20 as the value for all the bars in your chart. You will see a straight line in the output.
Note: You can update an existing chart by changing your script and clicking the “Update on chart” button from the top right in Pine Editor.


If you have sufficient coding skills in any other programming language, skip the following section and jump straight to the “Creating Indicators” section. Otherwise, if you are an absolute beginner to Pine Script and programming, I recommend reading through the following sections and practicing them yourself. It will improve your familiarity with Pine Script and make things easier to understand while working with indicators and strategies.
Comments
You have seen comments in a previous section. Let me summarize them once more for you.
Pine Script has two types of comments: simple comments and annotation comments. The compiler ignores simple comments. On the other hand, annotation comments provide instructions to the compiler on how to compile and execute the code. Annotation comments typically start with the @ symbol.
In the following Pine code, the first four lines contain simple comments, while the 5th line contains an annotation comment.
// The following two lines contain simple comments
// This source code is subject to the terms of the Mozilla Public License 2.0 at https://mozilla.org/MPL/2.0/
// (c) usmanmalik57
// The following line contains an annotation comment
//@version=5
indicator("My script")
plot(20)
Data Types and Variables
The following are the primary data types in Pine Script.
- Integer – e.g. 48, 1, 9
- Float – e.g., 48.56, 1.951, 9.25
- Boolean – true/false
- Color – green, rgb(0, 255, 0, 50)
- String – “my candle stick”
In Pine Script, you may or may not want to mention data types while initializing a variable explicitly.
Let’s first see an example where we will not mention data types with variable names.
The script below initializes text_val, int_val, float_val, bool_val, and color_val variables that store string, integer, float, boolean, and color data type values, respectively. The script displays two plots using these variable values.
//@version=5

text_val = "my bar title" // string

indicator(text_val)

int_val = 20 // integer
float_val = 25.5 // float
bool_val = true // boolean
color_val = color.green // color

// you will study if/else statements later
if bool_val == false
    // variable re-assignment
    color_val := color.red

plot(int_val, color = color_val)
plot(float_val)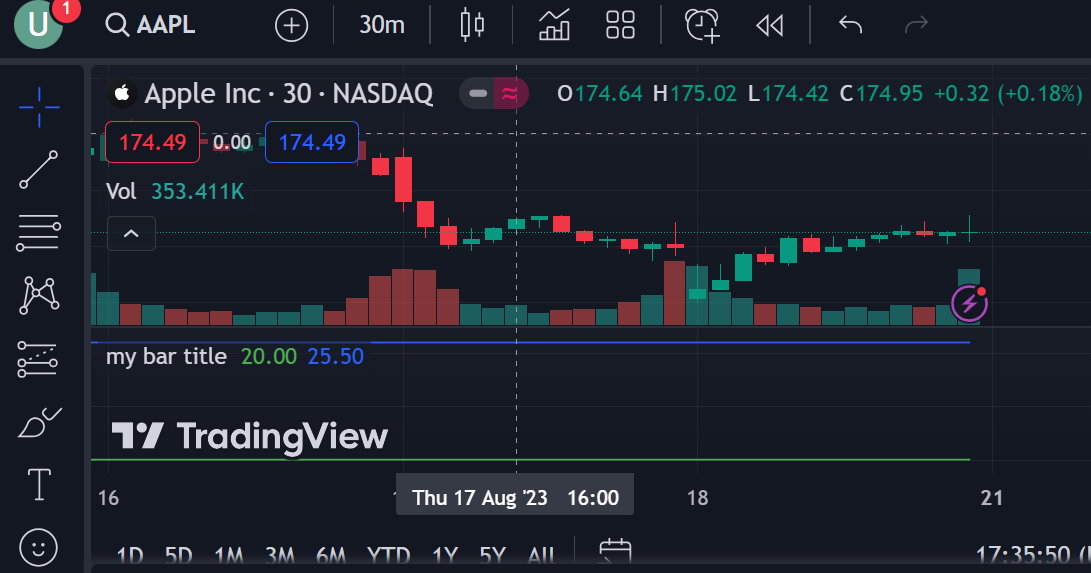
You can also specify data type during variable initialization.
//@version=5

string text_val = "my bar title" // string

indicator(text_val)

int int_val = 20 // integer
float float_val = 25.5 // float
bool bool_val = true // boolean
color color_val = color.green // color

// you will study if/else statements later
if bool_val == false
    // variable re-assignment
    color_val := color.red

plot(int_val, color = color_val)
plot(float_val)
In the case of multiple plots, I recommend you add titles to plots to differentiate them better.
To enable title names on charts, go to the top right corner of your chart dashboard and click settings. Go to “Scales” and enable the “Indicators and financials value” checkbox.
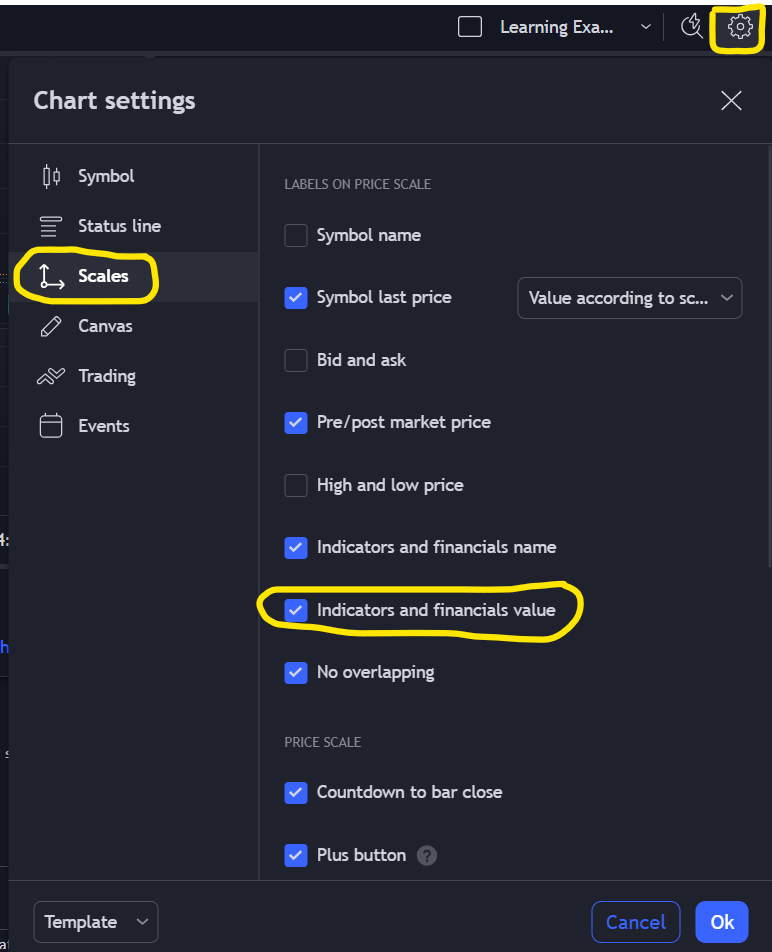
In the plot() function, assign a value to the title attribute. In the output, you will see plot titles on the right-hand side.
//@version=5

string text_val = "my bar title" // string

indicator(text_val)

int int_val = 20 // integer
float float_val = 25.5 // float
bool bool_val = true // boolean
color color_val = color.green // color

// you will study if/else statements later
if bool_val == false
    // variable re-assignment
    color_val := color.red

plot(int_val, title = "integer plot", color = color_val)
plot(float_val, title = "float plot")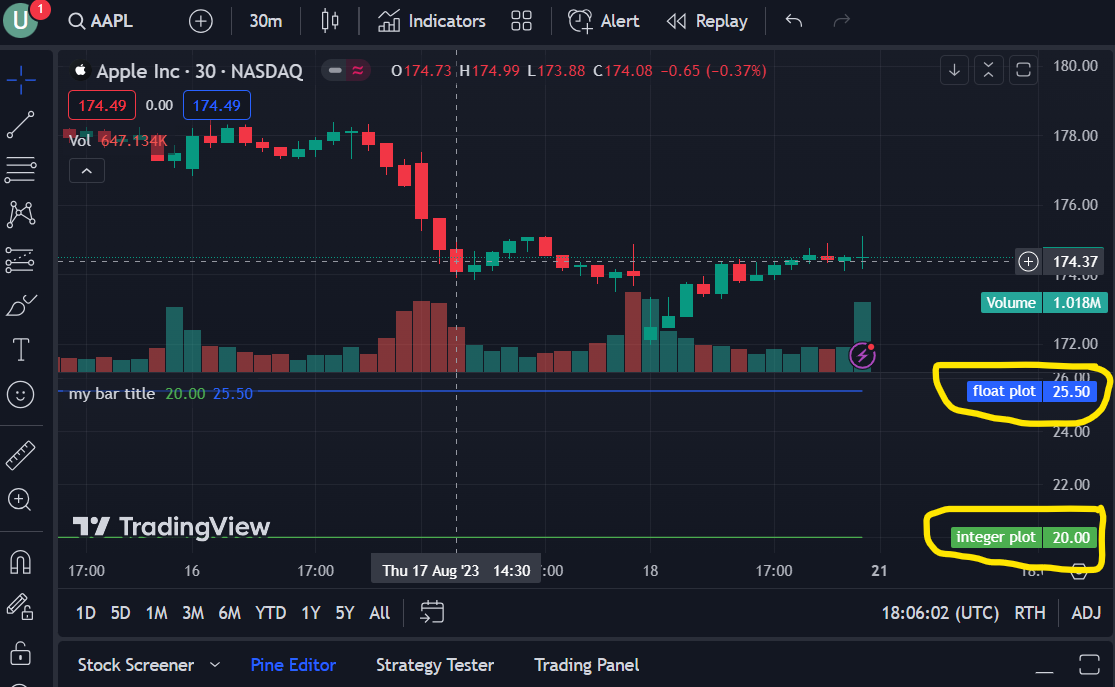
A variable’s scope is limited only to the current bar by default. You can use the var keyword to create a variable that shares its value between multiple bars.
For instance, the following script defines the persistent_var variable and increments its value with each bar.
Another essential concept in the following script is variable re-assignment. You cannot use the equals (=) sign to reassign a value to an existing variable. Instead, you must use the colon operator, followed by the equals sign (“:=”).
You will see a linearly increasing plot in the output since the value of the persistent_var variable increases with every bar.
//@version=5

indicator("My script")

var persistent_var = 0
persistent_var := persistent_var + 1

plot(persistent_var)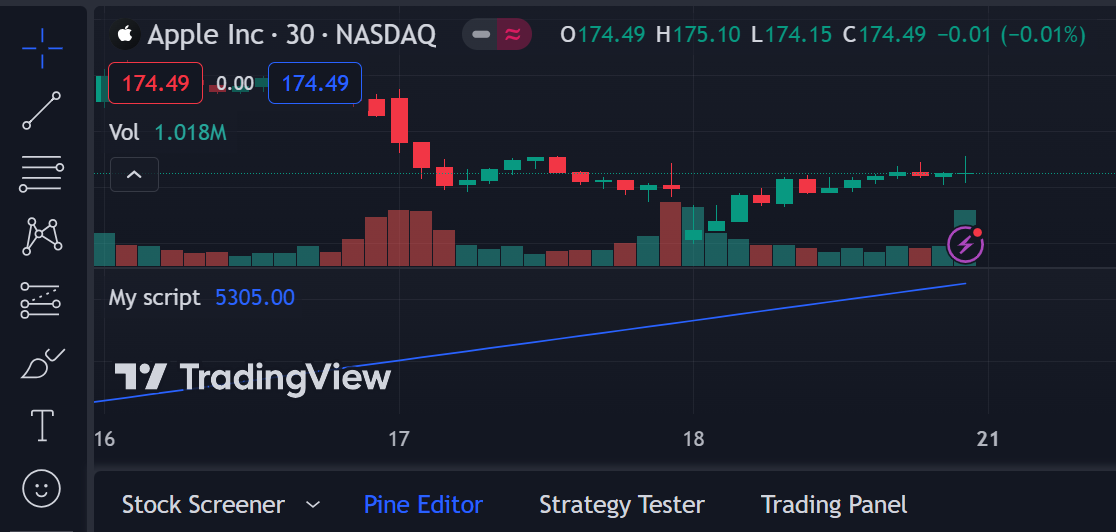
Operators
Like most other programming languages, Pine Script has the following operators.
- Arithmetic operators.
- Comparison operators.
- Logical operators.
- Ternary operators.
- History-referencing operators (specific to Pine Script).
Arithmetic operators
As the name suggests, arithmetic operators can perform various arithmetic operations in Pine Script.
The following example demonstrates addition, subtraction, multiplication, division, and modulus airtight operators in Pine Script.
//@version=5

indicator("My script")
num1 = 3
num2 = 8

result = num1 + num2
plot(result, title = "addition", color = color.red)

result := num1 - num2
plot(result, title = "subtraction", color = color.blue)

result := num1 * num2
plot(result, title = "multiplication", color = color.green)

result := num1 / num2
plot(result, title = "division", color = color.yellow)

result := num1 % num2
plot(result, title = "modulo", color = color.gray)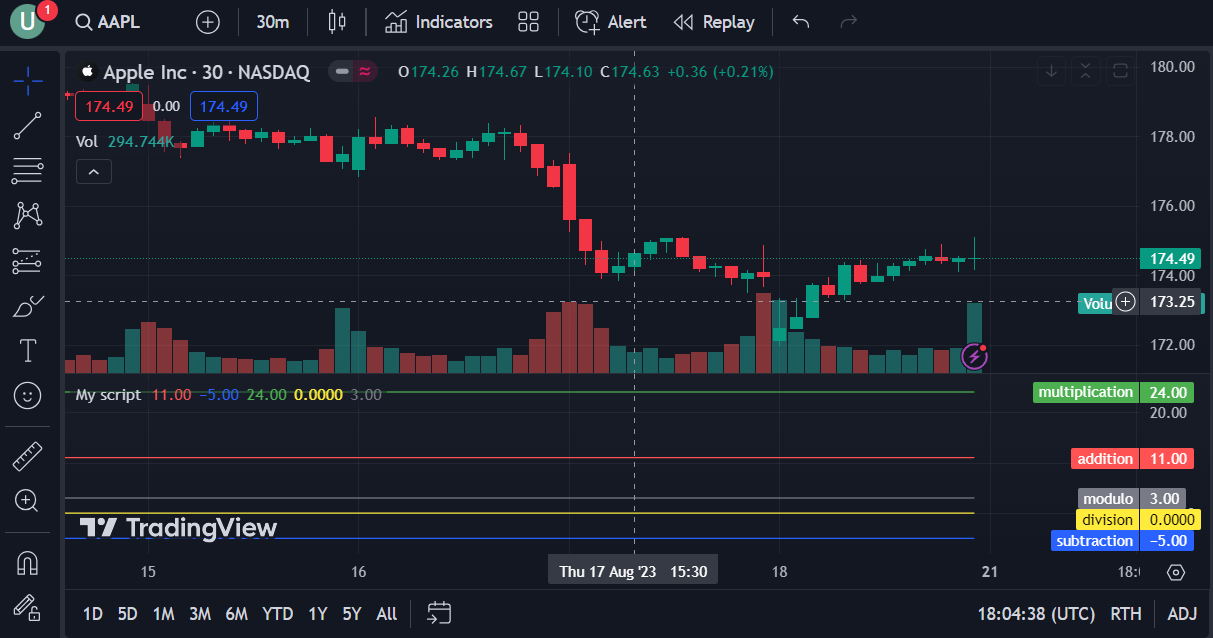
Comparison operators
Comparison operators return boolean values as a result of the comparison between two or more operands. Pine Script supports the following comparison operators:
- Less than (<) – returns true if the operand on the left-hand side of the operator is less than the one on the right-hand side.
- Greater than (>) – returns true if the operand on the left-hand side of the operator is greater than the one on the right-hand side.
- Less than or equal to (<=) – returns true if the operand on the left-hand side of the operator is less than or equal to the one on the right-hand side.
- Greater than or equal to (>=) – returns true if the operand on the left-hand side of the operator is greater than or equal to the one on the right-hand side.
- Equal to (==) – returns true if the operand on the left and right-hand sides of the operator are equal.
- Not equal to (==) – returns true if the operand on the left and right-hand side of the operator are not equal.
The following script demonstrates examples of using Pine Script comparison operators.
//@version=5
indicator("My script")

num1 = 3
num2 = 8

plot_color = color.green
if num1 < num2 // less than operator
    plot_color := color.red
plot(40, color = plot_color)

if num1 > num2 // greater than operator
    plot_color := color.yellow
plot(35, color = plot_color)

if num1 <= num2 // less than or equal to operator
    plot_color := color.blue
plot(30, color = plot_color)

if num1 >= num2 // greater than or equal to operator
    plot_color := color.gray
plot(25, color = plot_color)

if num1 != num2 // not equal to operator
    plot_color := color.olive
plot(20, color = plot_color)

if num1 == num2 // equal to operator
    plot_color := color.olive
plot(15, color = plot_color)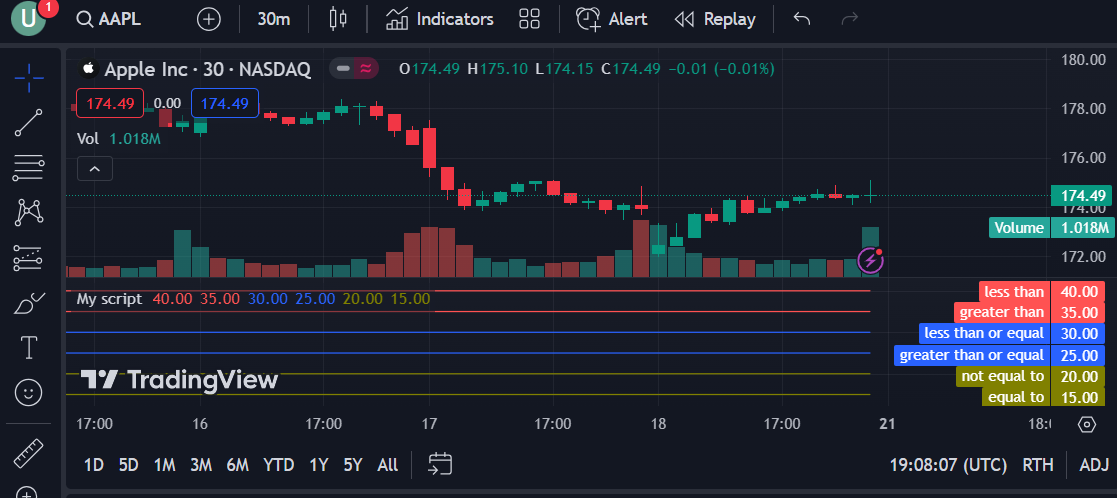
Logical operators
Pine Script supports and, or, and not logical operators. These operators return boolean values.
The and operator returns true if both conditions on the right and left-hand side of the operator return true. Otherwise, it returns false.
The or operator returns true if one of the conditions on the right or left-hand side of the operator returns true.
The not operator inverts the boolean condition, i.e., converts true to false and vice versa.
Here is an example of how to use the Pine Script logical operators.
//@version=5
indicator("My script")

num1 = 3
num2 = 8

plot_color = color.red
title_text = "and returns false"

if num1 > 5 and num2 > 4
    plot_color := color.green
    title_text:= "and returns true"
plot(40, title = title_text, color = plot_color)

title_text := "or returns false"
if num1 > 5 or num2 > 4
    plot_color := color.green
    title_text:= "or returns true"
plot(35, title = title_text, color = plot_color)

title_text := "not returns false"
if not (num1 > 5)
    plot_color := color.green
    title_text:= "not returns true"
plot(30, title = title_text, color = plot_color)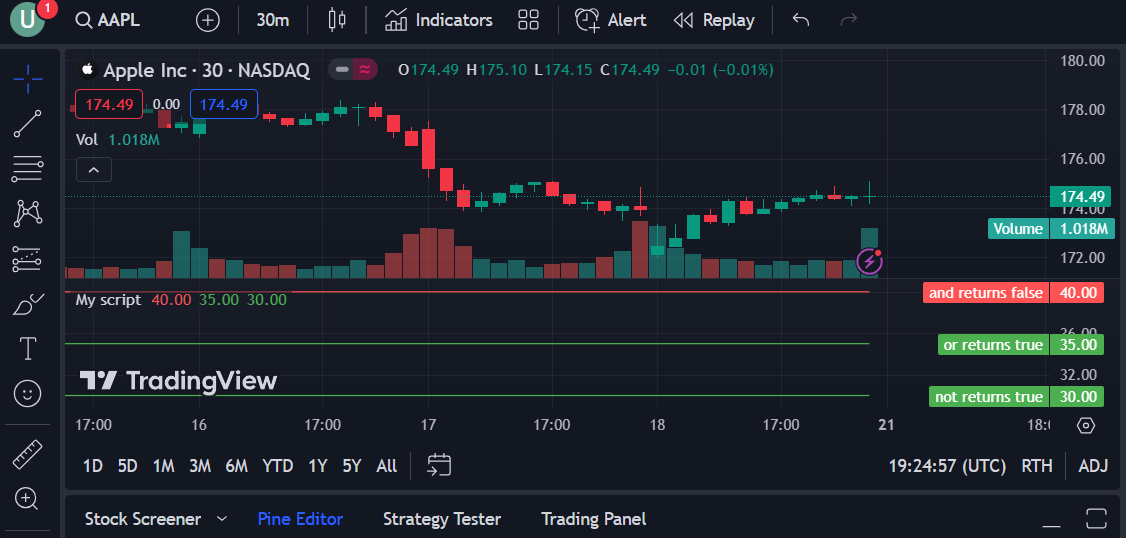
Ternary operator (?:)
The ternary operator is a short-hand notation for the if/else statements (which you will see in the next section). The syntax of the ternary operator is as follows:
condition 1 ? value 1 : condition 2 ? value 2 : naThe script returns value 1 if the condition 1 is true. Otherwise, if condition 2 is true, the script returns value 2. If conditions 1 and 2 return false, the script returns na (null) value.
We change the plot color and title in the following script using the ternary operator.
//@version=5
indicator("My script")

num1 = 8

plot_color = num1 > 5 ? color.green : num1 < 5 ? color.red: na
title_text = num1 > 5 ? "greater than returns true": num1 < 5 ? "greater than returns false": na

plot(40, title = title_text, color = plot_color )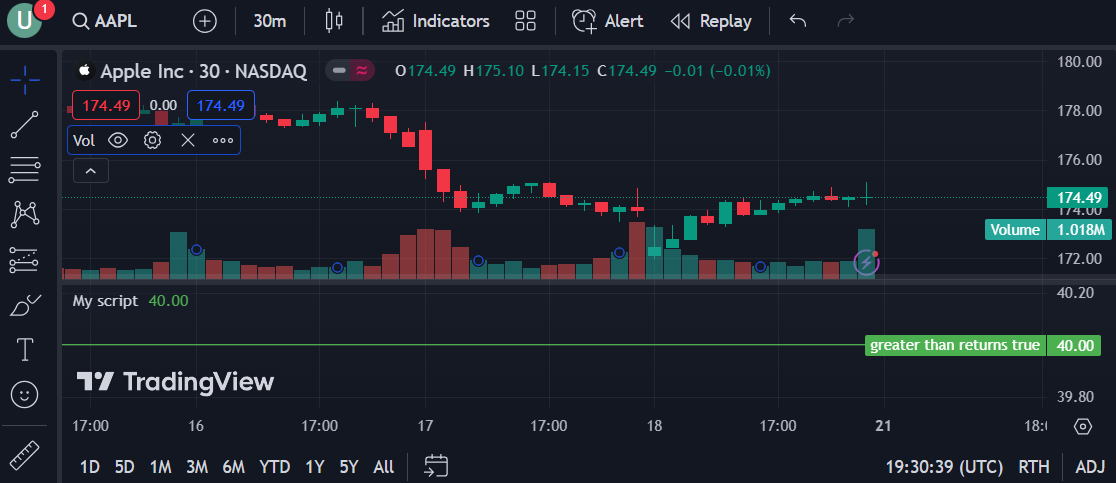
History-referencing operator ([])
The history-referencing operator allows you to fetch previous bar values. The history-referencing is used after a variable or function call. Inside square brackets, you have to pass an integer value, which refers to the offset in the past. For example, if you want to fetch closing price value two bars in the past, you would use close[2].
The following script calculates a simple moving average of length three using the history-referencing operator.
//@version=5
indicator("My script")

past_close1 = close[0]
past_close2 = close[1]
past_close3 = close[2]

sma_3 = (past_close1 + past_close2 + past_close3)/3

plot(sma_3)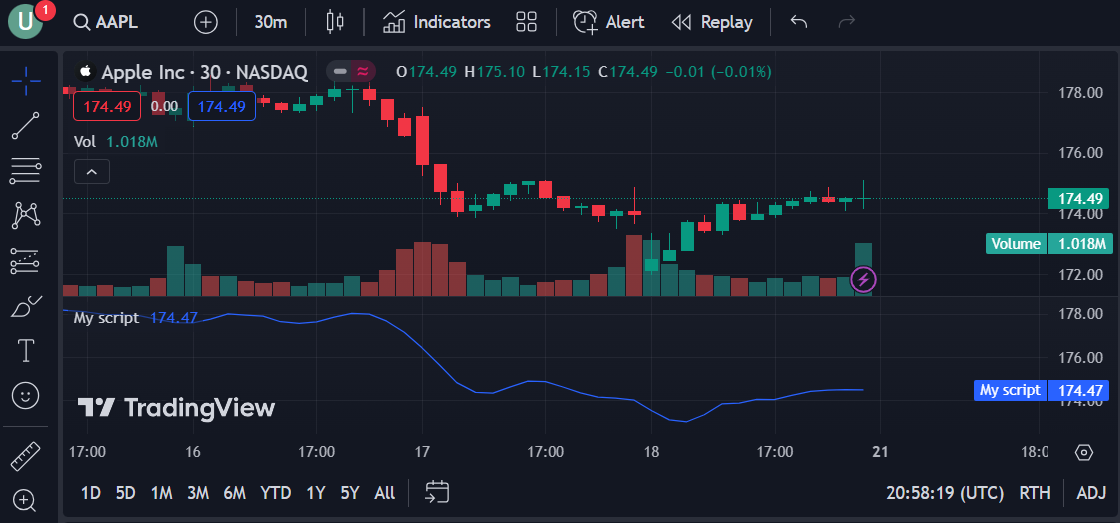
Note: The Pine Script ta namespace contains a built-in sma function that allows you to calculate simple moving averages of any length.
Conditional Statements
Pine Script supports two conditional statements:
- If/Else statements
- Switch Statements
IF/Else Statements
Use if/else statements when executing a code based on a single condition. The following script changes the plot color based on an if/else statement.
//@version=5
indicator("My script")

color plot_color = na
if close > open
    plot_color := color.green

else
    plot_color := color.red

plot(close, color = plot_color)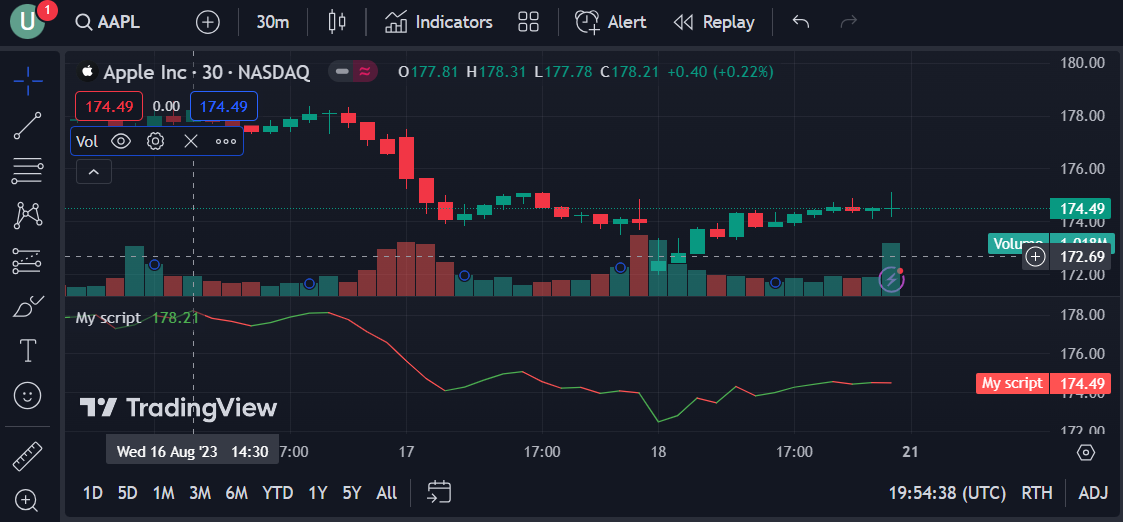
Switch Statements
I recommend using switch statements when you want to execute code snippets based on multiple conditions.
The following script uses a switch statement to change the plot color based on three boolean conditions. The switch statement implicitly returns the value for the code snippet that returns true.
//@version=5
indicator("My script")

color plot_color = switch
    high >  176 => color.yellow
    close > open => color.green
    close < open => color.red

plot(close, color = plot_color)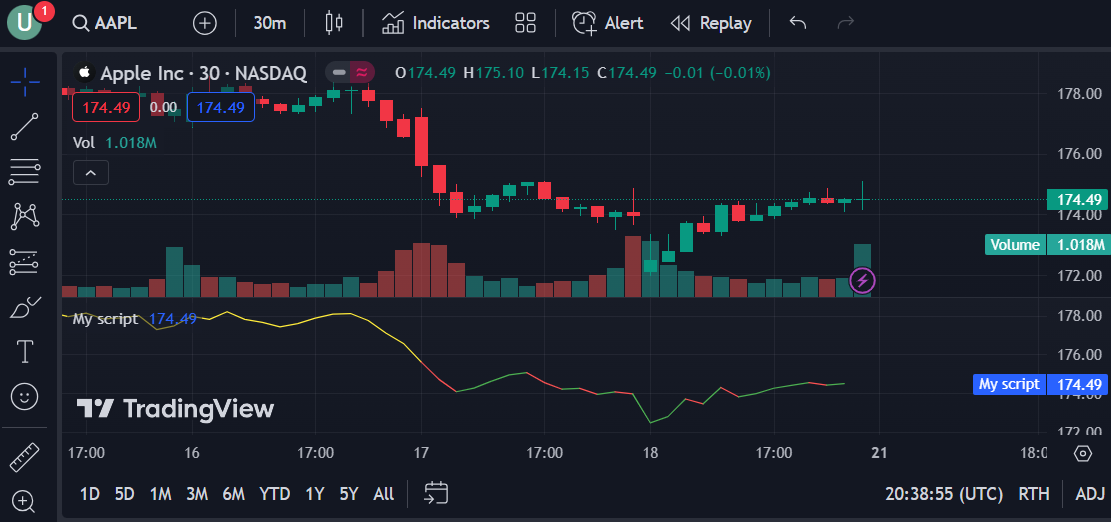
In the above script, we did not provide an expression to evaluate to the switch statement. Usually, you would provide an expression to a switch statement and evaluate your code against that expression.
For example, in the following script, the switch statement evaluates the value of the plot_val variable.
//@version=5
indicator("My script")

plot_val = volume
color plot_color = switch plot_val
    close => color.green
    open => color.blue
    volume => color.yellow

plot(plot_val, color = plot_color)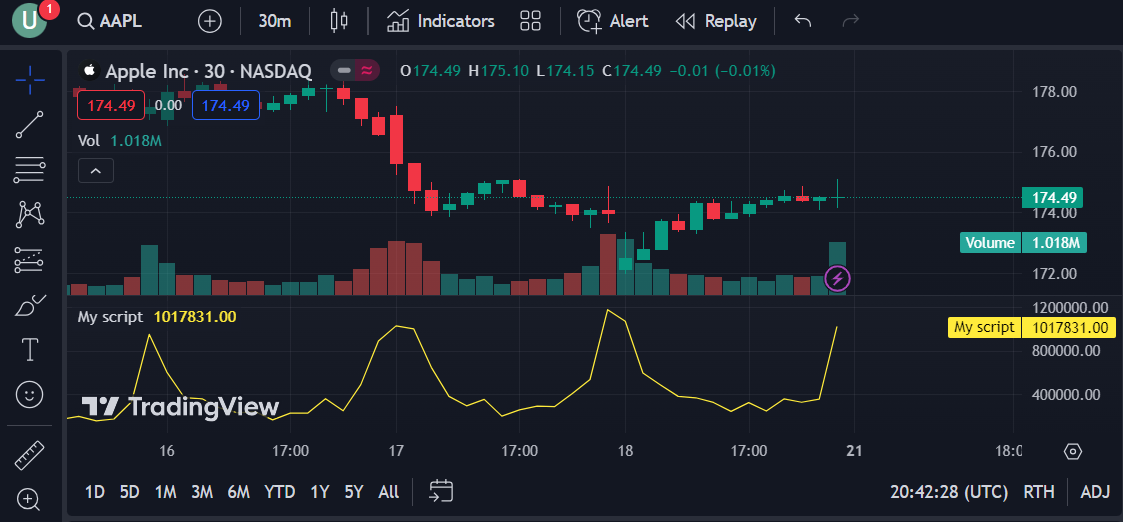
Iteration Statements/ Loops
You can use iteration statements to execute a piece of code in Pine Script repeatedly. Pine Script has two iteration statements:
- For loop
- While loop
For Loop
You should use the for loop when you know the number of iterations in advance for which you want to execute a piece of code.
The following script shows how to calculate a simple moving average of length 10 using a for loop.
//@version=5
indicator("My script")

num_past_bars = 10
sum_10 = 0.0
for i = 0 to num_past_bars - 1
    sum_10 := sum_10 + close[i]

sma_10 = sum_10/10

plot(sma_10)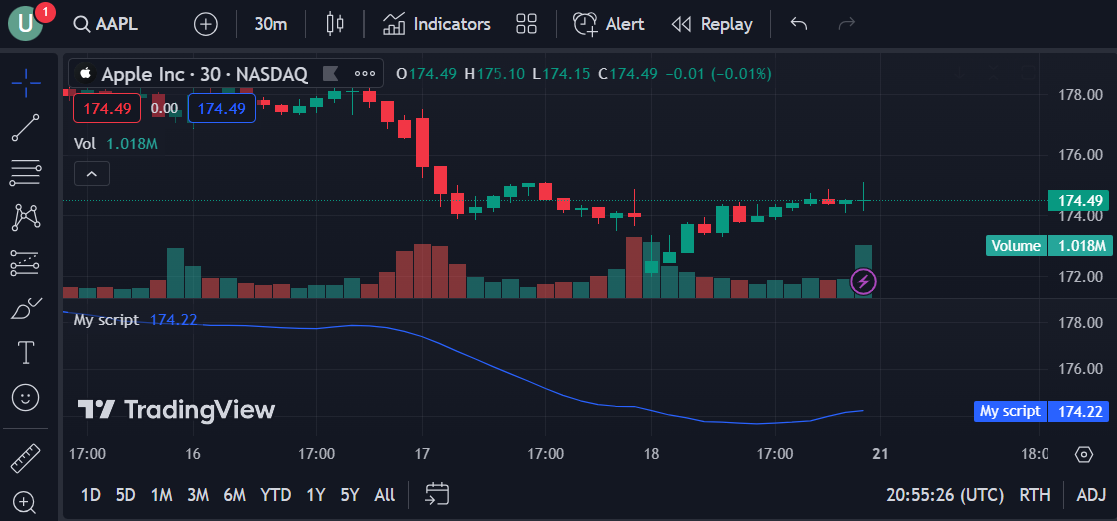
While Loop
A while loop repeatedly executes a code snippet until the while condition becomes false.
The following script calculates a simple moving average of length 10 using a while loop.
//@version=5
indicator("My script")

num_past_bars = 10
sum_10 = 0.0
i = 0
while i < 10
    sum_10 := sum_10 + close[i]
    i := i + 1

sma_10 = sum_10/10

plot(sma_10)
Built-in Variables and Functions
Pine Script contains several built-in variables and functions you can use to perform various tasks.
Built-in Variables
Pine Script provides a myriad of built-in variables. The close, open, volume, etc., are some of the most common Pine Script built-in variables. Refer to the official documentation to see the list of all built-in variables.
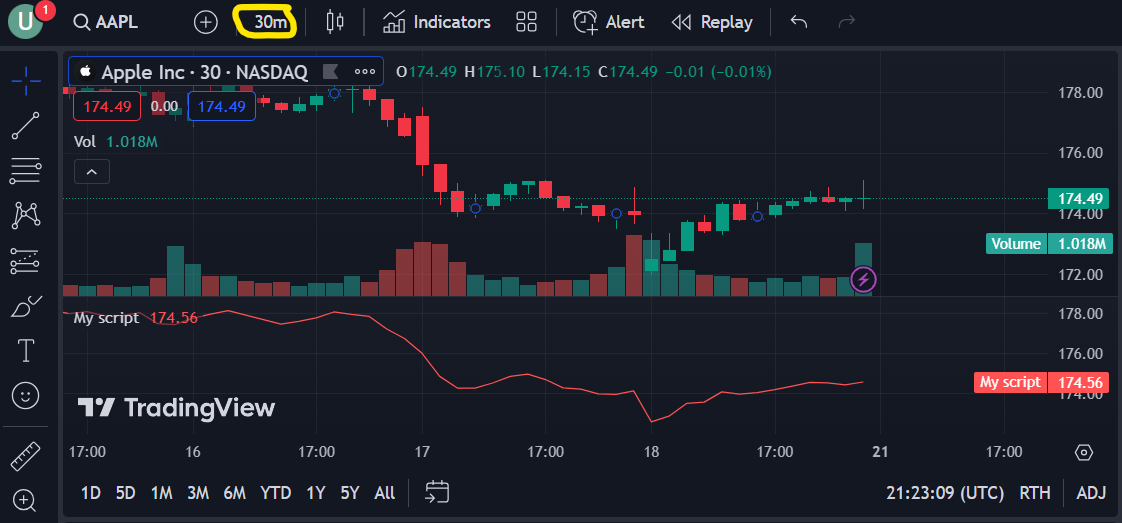
In the following script, I demonstrate the use of isminutes variable. The script changes the bar color to red if the time frame of the current chart is in minutes. In the output, you can see that the time frame is in days (D) at the top left corner, which results in a green plot.
//@version=5
indicator("My script")

plot_color = color.green

if timeframe.isminutes
    plot_color := color.red

plot(hlcc4, color = plot_color)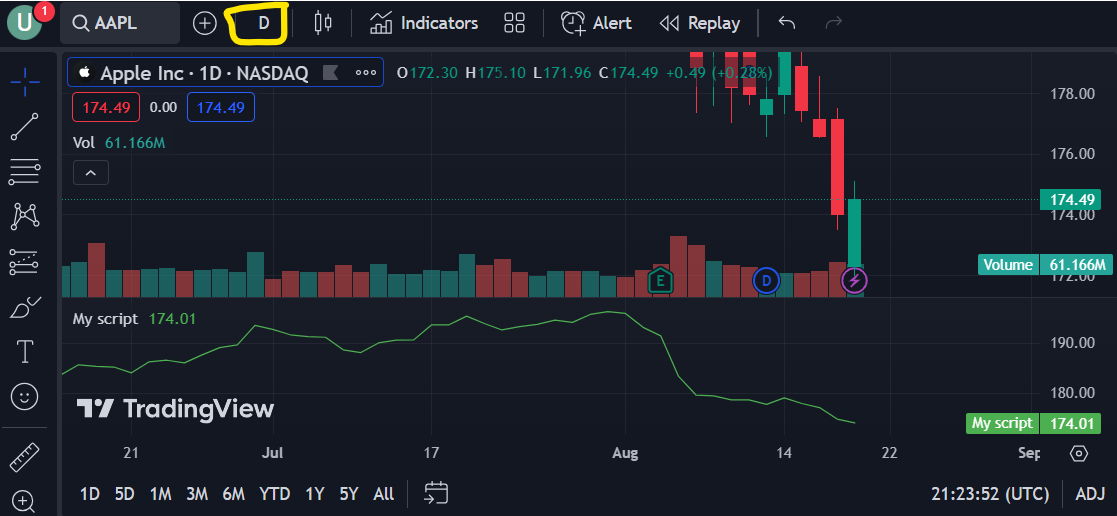
If you change the time frame to minutes (30m in the following screenshot), the plot color changes to red.
Built-in Functions
Like variables, Pine Script provides several built-in functions.
For example, the following script demonstrates using math.log, and ta.sma functions.
//@version=5
indicator("My script")

log_close = math.log(close)
plot(log_close, title = "Log Close")

plot(ta.sma(close, 10), color = color.red, title = "SMA 10")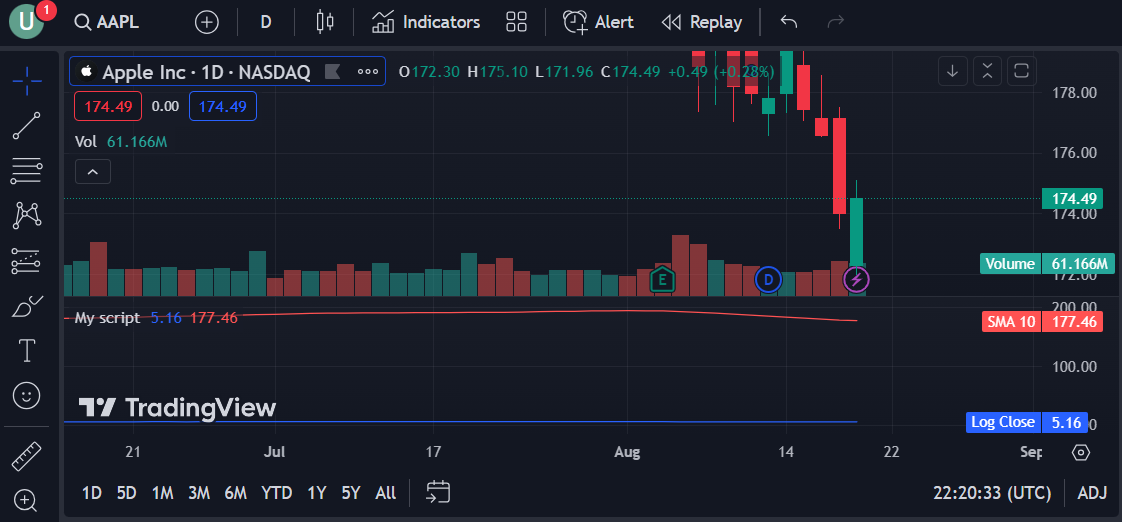
User Defined Functions
You can encapsulate custom Pine Script functionalities in user-defined functions.
You can create single-line or multi-line user-defined functions.
Single-line Functions
As the name suggests, single-line functions consist of a single line of code.
The following script defines a close_open_ratio() single-line function that accepts three parameters: close_val, open_val, vol_val. The function divides the close_val by the open_val, multiplying the result with the vol_val variable.
//@version=5
indicator("My script")

close_open_ratio(close_val, open_val, vol_val) => (close_val/open_val) * vol_val

ratio = close_open_ratio(close, open, volume)

plot(ratio)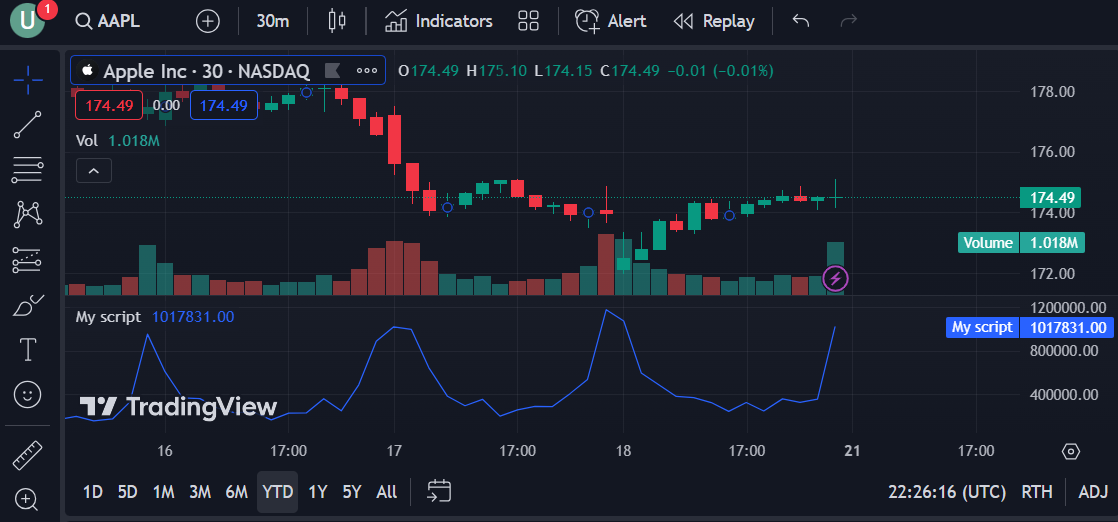
Multi-line Functions
You can define a function in multiple lines, hence the multi-line function.
The following script defines a multi-line close_open_ratio() that accepts close_val, open_val, and vol_val parameters.
The close_open_ratio() function performs the following three operations:
- It divides the close_val by open_val and multiplies the result with the vol_val variable.
- It takes the square root of the value resulting from the first operation.
- It multiplies a random value to the value resulting from the second operation.
//@version=5
indicator("My script")

close_open_ratio(close_val, open_val, vol_val) =>
    ratio = (close_val/open_val) * vol_val
    sqrt_ratio = math.sqrt(ratio)
    random = math.random() * sqrt_ratio

ratio = close_open_ratio(close, open, volume)

plot(ratio)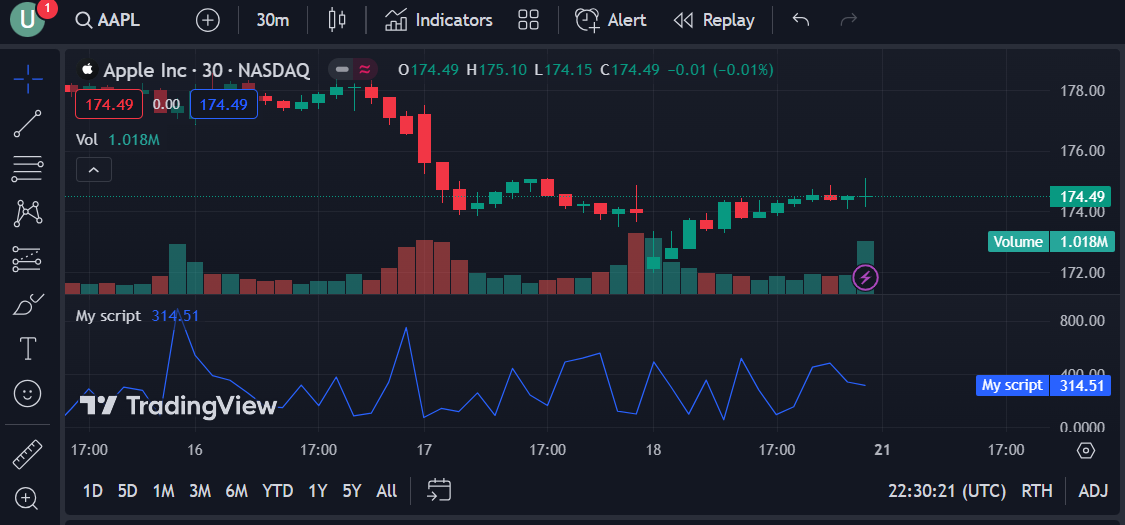
Functions Returning Multiple Values
You can return multiple values from a Pine Script function. To do so, pass the values to return inside square brackets and separate them by commas.
Likewise, to receive multiple values from a function, pass receiving variables inside square brackets and separate them by commas.
Here is an example function that returns random and sqrt_ratio variables from the close_open_ratio() function.
//@version=5
indicator("My script")

close_open_ratio(close_val, open_val, vol_val) =>
    ratio = (close_val/open_val) * vol_val
    sqrt_ratio = math.sqrt(ratio)
    random = math.random() * sqrt_ratio

    [sqrt_ratio, random]

[ratio, random] = close_open_ratio(close, open, volume)

plot(ratio, title = "ratio", color = color.red)
plot(random, title = "random", color = color.green)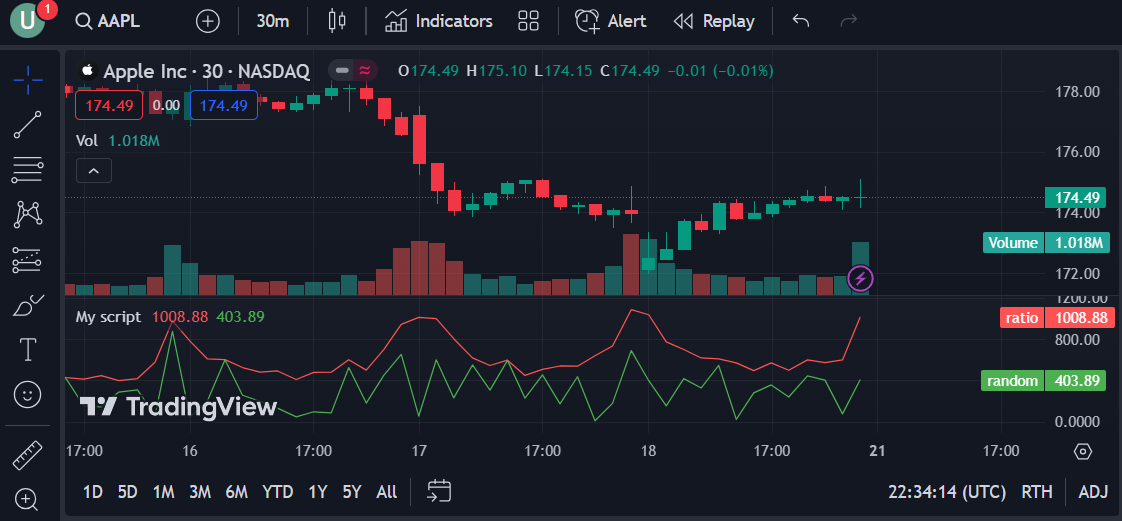
Getting User Inputs
In production environments, you would allow users to provide input values.
Pine Script supports various user input variables, which you can check by writing input followed by control + space (or command + space on MAC).
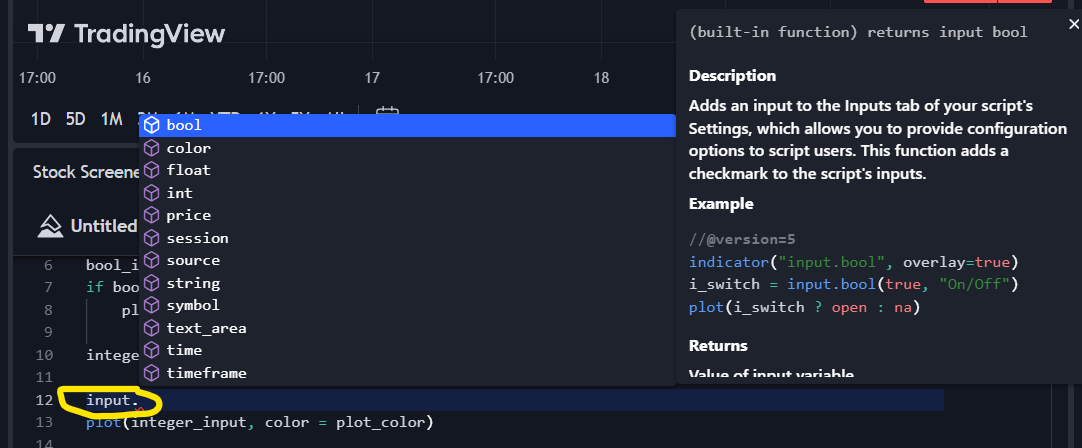
In the following example, we store the boolean input from a user in the bool_input variable. The default boolean value will be false. If the boolean input is true, we change the plot color to red. Else, the plot color remains green.
//@version=5
indicator("My script")

plot_color = color.green

bool_input = input.bool(title = "Red plot", defval = false)
if bool_input == true
    plot_color := color.red

plot(close, color = plot_color)
Pine Script converts a boolean user input value to a checkbox, which you can see by clicking the plot settings and then selecting “Inputs.”

Ticking the “Red plot” checkbox turns the plot color to red.
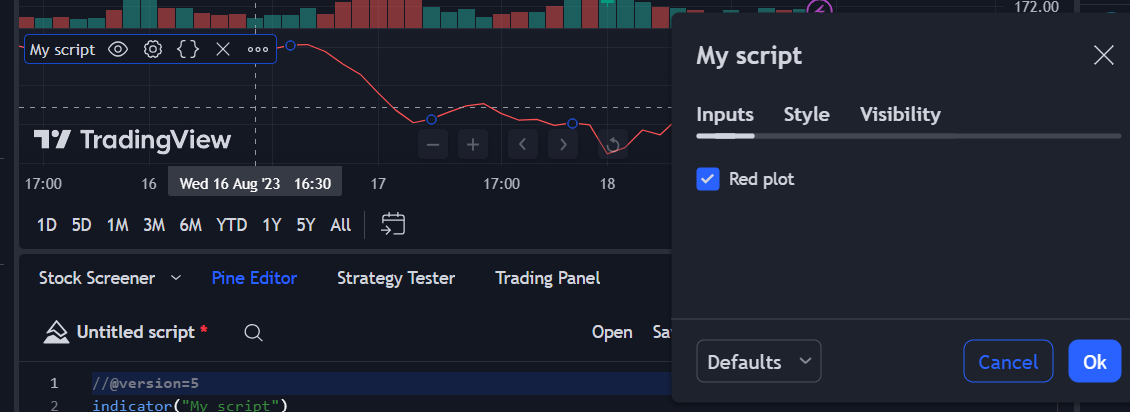
Let’s see another example where we ask the user to input a boolean and an integer value. The boolean value changes the plot color while the integer value sets the plot value.
//@version=5
indicator("My script")

plot_color = color.green

bool_input = input.bool(title = "Red plot", defval = false)
if bool_input == true
    plot_color := color.red

integer_input = input.int(title = "Plot Value", defval = 20)

plot(integer_input, color = plot_color)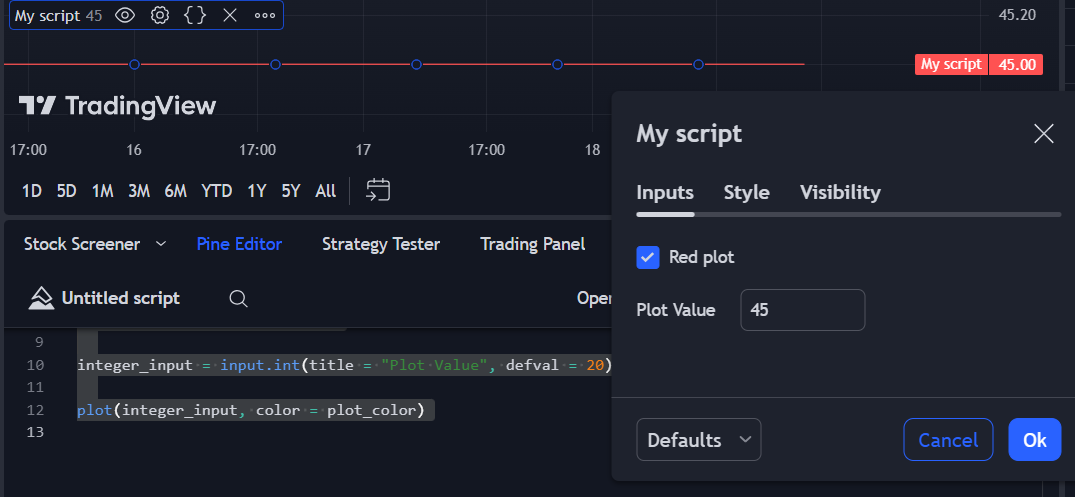
And with that, we have covered the Pine Script language fundamentals. In the next section, we will study Pine Script indicators in more detail. You will study how to create custom indicators with Pine Script.
Creating Indicators – An In-Depth Explanation
The primary purpose of indicators is to provide technical analysis of various securities. You have been using indicators all along in this tutorial. In this section, we will go into more detail about Pine Script indicators.
To create an indicator, we use the indicator() function, which tells the Pine Script compiler to import all indicator-related namespaces.
You can pass several attribute values to the indicator() function. Let’s see some of them in action.
When set to true, the overlay attribute displays the plot in the chart window overlaying an existing chart. The shorttitle attribute specifies the short title of the plot.
The output shows a close price plot, “SPSC, ” overlayed on the main chart.
//@version=5
indicator("My script", overlay = true, shorttitle = "SPSC")
plot(close)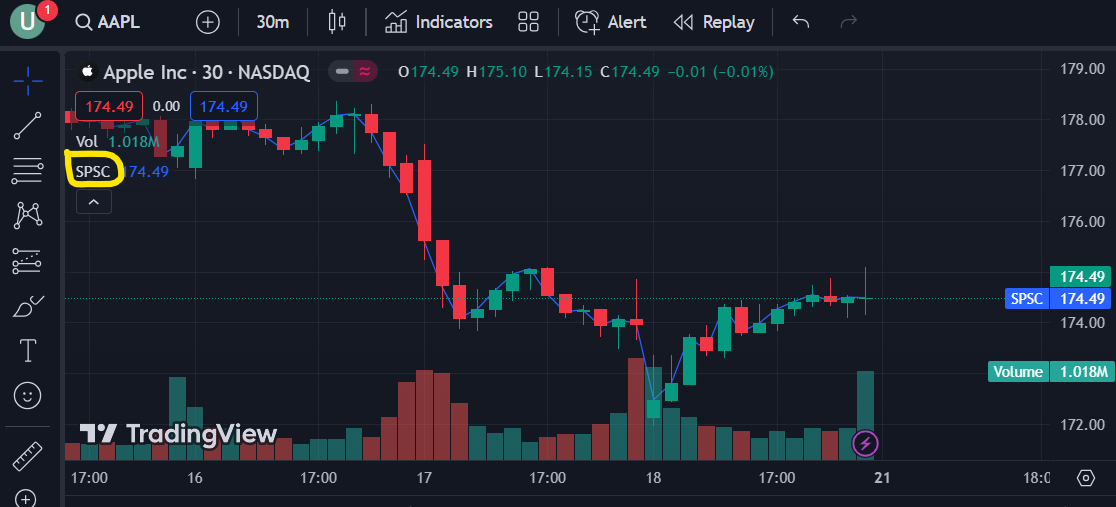
The format attribute is another important attribute that sets the format of your plot. For instance, Pine Script displays volume values in all digits. If you set the format attribute to format.volume, you will see volume values in K (for thousands) and M (for millions).
//@version=5
indicator("My script",  shorttitle = "SPSC", format = format.volume, timeframe = "D")
plot(volume)
The linewidth attribute sets the width of the line plot. The following script sets the line width of the close plot to 3.
You can change the plot style using the style attribute. The show_last attribute displays the last N bars for a plot, where N is an integer. The following script shows the last 20 open values in circle style. The offset attribute shifts a plot to the right or left. In the following script, we offset the green close plot by -10, moving it 10 bars to the left.
//@version=5
indicator("My script",  shorttitle = "SPSC")

plot(close, color = color.yellow, linewidth = 3)
plot(open, color = color.red, style = plot.style_circles, show_last = 20)
plot(close, color = color.green, offset = -10)
Retrieving Other Securities
In addition to the values for the default chart, you can retrieve technical indicator values for other securities using the request.security() function. The first attribute to the function is the security ticker ID, the second is the time frame, and the third is the indicator you want to retrieve.
The following script plots the closing price values for Meta and Microsoft. The time frame is the same as the default chart’s time frame.
//@version=5
indicator("My script",  shorttitle = "SPSC")

meta_close = request.security("META",  timeframe.period, close)
plot(meta_close, title = "Meta", color = color.green)

msft_close = request.security("MSFT",  timeframe.period, close)
plot(msft_close, title = "Microsoft", color = color.red)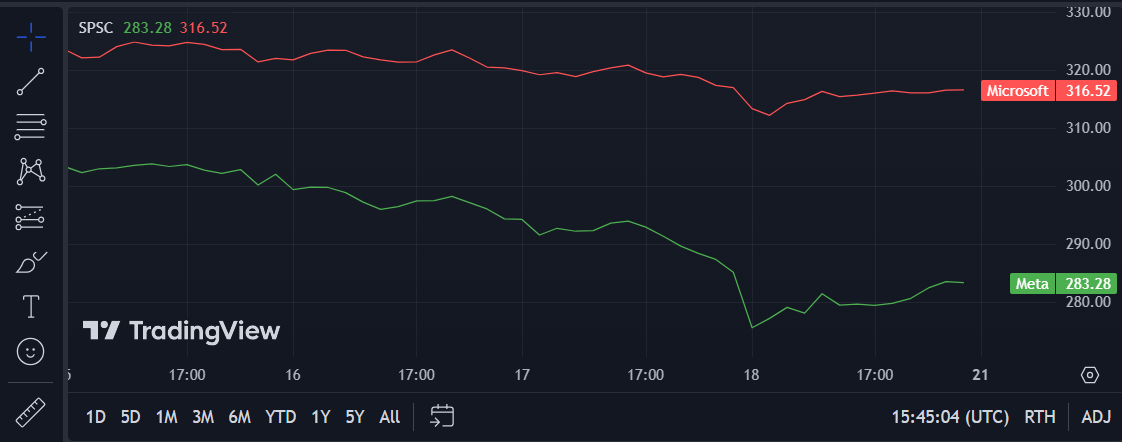
Retrieving Quandl Data
TradingView has partnered with Quandl (Nasdaq Data Link) to integrate Quandl data in Pine Script.
To retrieve Quandl data in Pine Script, search for the data you want to retrieve from Quandl and copy the data ID.
For instance, you can retrieve the University of Michigan Consumer Survey data using the UMICH/SOC35 ID.
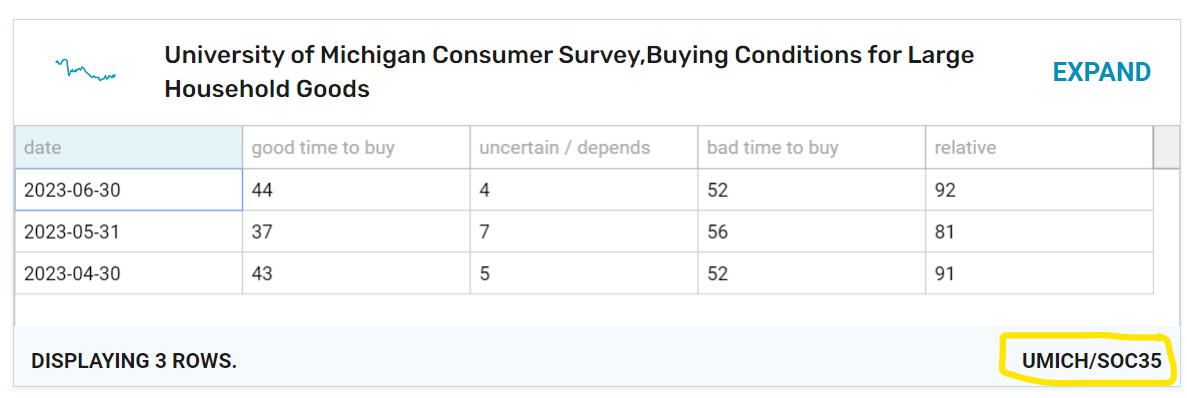
The request.quandl() method returns the latest Quandl data. You need to pass the Quandl data ID, the bars’ gap value, and the data column’s index value. For instance, the following script displays plots containing values from the first row’s four columns. The barmerge.gaps_off means no gaps are displayed between bars.
//@version=5
indicator("My script",  shorttitle = "SPSC")

f = request.quandl("UMICH/SOC35", barmerge.gaps_off, 0)
plot(f , title = "good time to buy", color = color.green)

f:= request.quandl("UMICH/SOC35", barmerge.gaps_off, 1)
plot(f , title = "uncertain/depends", color = color.yellow)

f:= request.quandl("UMICH/SOC35", barmerge.gaps_off, 2)
plot(f, title = "bad time to buy" , color = color.red)

f:= request.quandl("UMICH/SOC35", barmerge.gaps_off, 3)
plot(f, title = "relative", color = color.blue)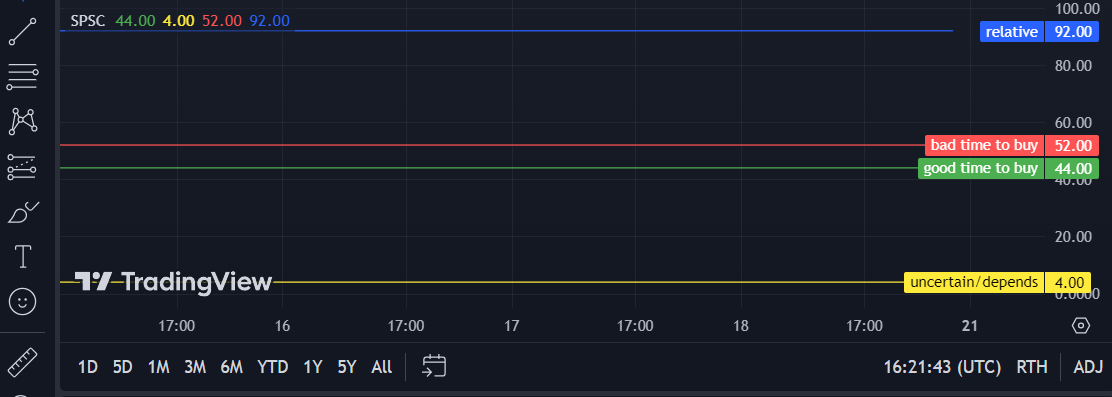
Technical Analysis with Indicators
The core focus of indicators is to perform technical analysis. The ta namespace contains functions to retrieve different indicators for technical analysis.
In the following example, we receive three string inputs from the user. The first input allows the user to select one of three simple moving average (SMA) values: 25 SMA, 50 SMA, and 100 SMA. The default value is 25 SMA. The second and third user inputs allow the user to provide similar values for the exponential moving average (EMA) and weighted moving average (WMA). We plot three plots corresponding to the user’s SMA, EMA, and WMA values. A switch statement updates chart values based on user input.
//@version=5
indicator("My script",  shorttitle = "TA")

smaInput = input.string(title='SMA Options',
                         options=["25 SMA", "50 SMA", "100 SMA"],
                          defval="25 SMA")

sma_Value = switch smaInput
    "25 SMA" => 25
    "50 SMA" => 50
    "100 SMA" => 100

sma_vals = ta.sma(close, sma_Value)
plot(sma_vals, title = "SMA", color = color.red)

emaInput = input.string(title='EMA Options',
                         options=["25 EMA", "50 EMA", "100 EMA"],
                          defval="25 EMA")

ema_Value = switch emaInput
    "25 EMA" => 25
    "50 EMA" => 50
    "100 EMA" => 100

ema_vals = ta.ema(close, ema_Value)
plot(ema_vals, title = "EMA", color = color.yellow)


wmaInput = input.string(title='WMA Options',
                         options=["25 WMA", "50 WMA", "100 WMA"],
                          defval="25 WMA")

wma_Value = switch wmaInput
    "25 WMA" => 25
    "50 WMA" => 50
    "100 WMA" => 100

wma_vals = ta.wma(close, wma_Value)
plot(wma_vals, title = "WMA", color = color.gre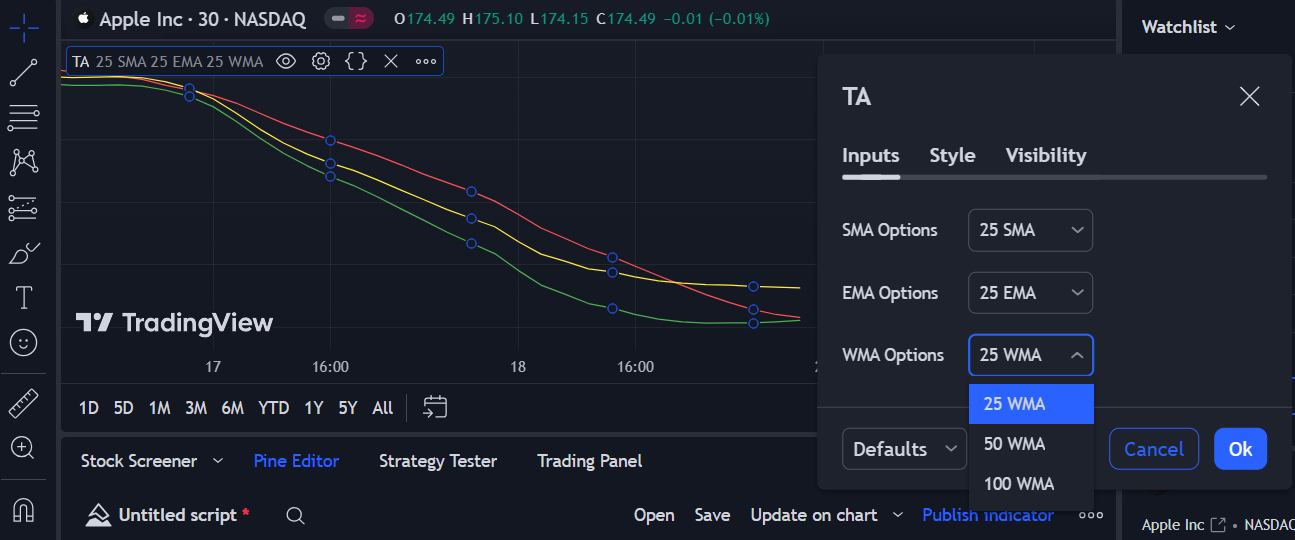
In the following section, you will learn how to implement strategies in Pine Script, one of the most fascinating concepts.
Creating Strategies
A strategy in Pine Script is a set of programmed rules that automate trading decisions based on technical indicators and price patterns. It allows you to automatically create and test trading strategies, execute buy/sell orders, and manage positions.
In this section, you will learn how to develop strategies for backtesting, an approach used to evaluate your trading strategies using historical data.
A Basic Example – Implementing Moving Average Crossover Strategy
Let’s create a simple moving average crossover strategy, a straightforward approach that leverages two moving averages to guide trading decisions. Here is the complete code for the strategy.
//@version=5
strategy("Moving Average Crossover Strategy", overlay=true)

// Define the fast and slow moving averages
fast_ma = ta.sma(close, 10)
slow_ma = ta.sma(close, 20)

plot(fast_ma, color = color.yellow)
plot(slow_ma, color = color.red)

// Determine the buy and sell signals
buy_signal = ta.crossover(fast_ma, slow_ma)
sell_signal = ta.crossunder(fast_ma, slow_ma)

// Place the trades
if (buy_signal)
    strategy.entry("Buy", strategy.long, 100)
if (sell_signal)
    strategy.entry("Sell", strategy.short, 100)
The code begins with the strategy() function with the overlay parameter is set to true, which plots the strategy charts on the main chart. Like the indicator() function, the strategy() function tells the compiler to import all the namespaces and functions helpful in creating strategies.
We then define two moving averages, the fast-moving average (fast_ma) and the slow-moving average (slow_ma), using the ta.sma() function. The plot() function then plots the fast and slow-moving averages on the chart.
We use the ta.crossover() function to determine the buy signal, which checks if the fast-moving average crosses above the slow-moving average. Similarly, the ta.crossunder() function checks if the fast-moving average crosses below the slow-moving average to determine the sell signal.
Next, we use conditional statements to place trades based on the buy and sell signals. When we detect a buy signal, we use the strategy.entry() function to enter a long position (buy) with a quantity of 100 shares. Similarly, when a sell signal is detected, we use the strategy.entry() to enter a short position (sell) with a quantity of 100 shares.
Click the “Add to chart” button to run the script. You will see plots for fast_ma, and slow_ma overlaid on the main chart.
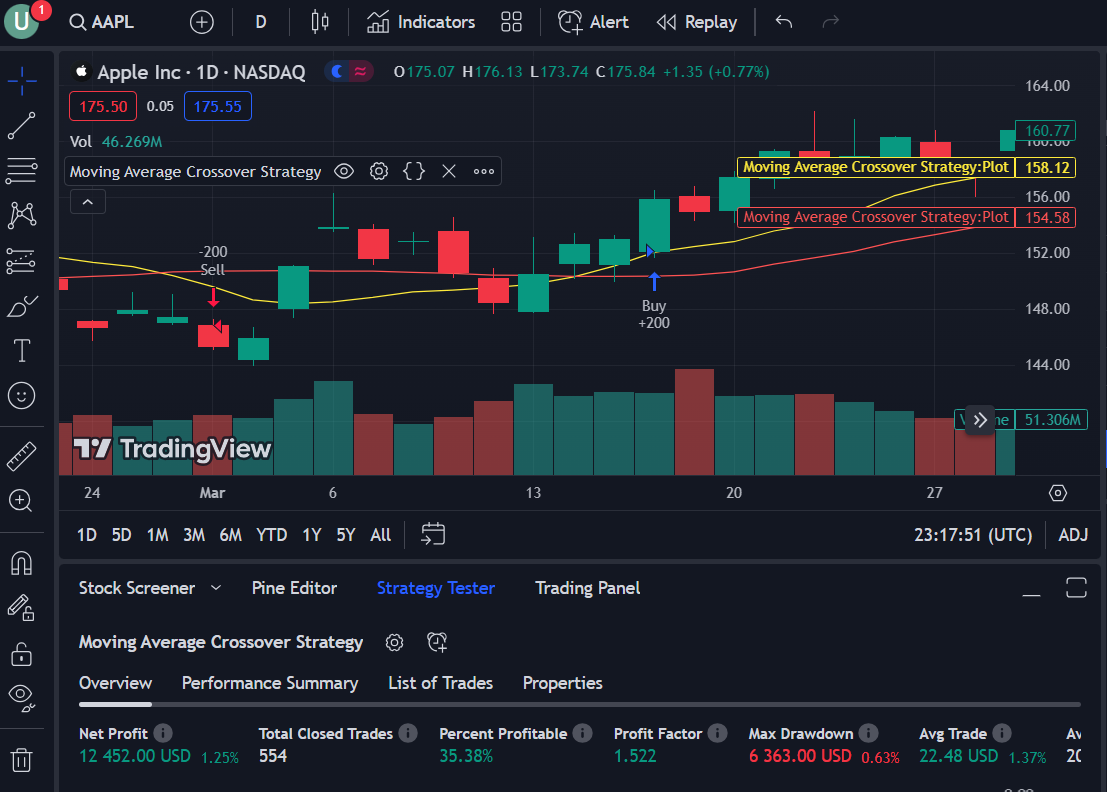
Click the “Strategy Tester” link (next to Pine Editor) to see how your strategy performed.
The following screenshot shows that this strategy made a profit of 12,452.00 dollars for all the historical Apple data.
You can specify the time frame for your strategy. For instance, you can use the following script to run your strategy on Apple data between 01 January 2020 and 31 December 2022. Here, we specify our strategy’s start and end times and run our strategy between these dates using the if condition.
//@version=5
strategy("Moving Average Crossover Strategy", overlay=true)

// Define the fast and slow moving averages
fast_ma = ta.sma(close, 10)
slow_ma = ta.sma(close, 20)

plot(fast_ma, color = color.yellow)
plot(slow_ma, color = color.red)

// Determine the buy and sell signals
buy_signal = ta.crossover(fast_ma, slow_ma)
sell_signal = ta.crossunder(fast_ma, slow_ma)

start_time = timestamp("2020-01-01 00:00:00")
end_time = timestamp("2022-12-31 23:59:59")

// Place the trades

if time>= start_time and time <= end_time
    if (buy_signal)
        strategy.entry("Buy", strategy.long, 100)
    if (sell_signal)
        strategy.entry("Sell", strategy.short, 100)
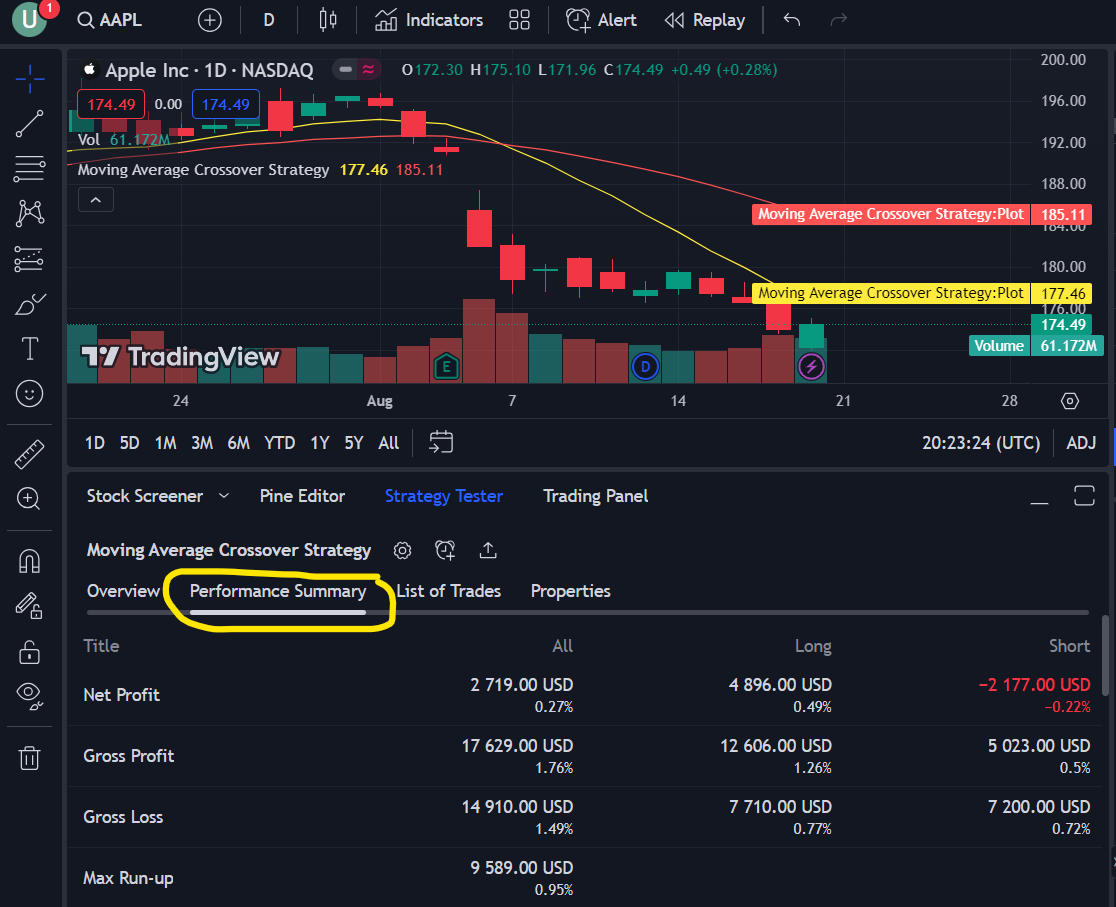
You can view the performance summary of your strategy by clicking the “Performance Summary” link under “Strategy Tester.” The following output showed that you would have made USD 2719.00 in two years with the moving average crossover strategy.
An Intermediate Example – Implementing RSI and MACD Strategy
To mitigate risk, let’s enhance the strategy we developed in the previous section by incorporating the Relative Strength Index (RSI) and Moving Average Convergence Divergence (MACD) indicators.
//@version=5
strategy("Moving Average Crossover Strategy with RSI and MACD", overlay=true)

// Define the fast and slow moving averages
fast_ma = ta.sma(close, 10)
slow_ma = ta.sma(close, 20)

plot(fast_ma, color = color.yellow)
plot(slow_ma, color = color.red)

// Define the RSI and MACD indicators
rsi = ta.rsi(close, 14)
[macdLine, signalLine, _] = ta.macd(close, 12, 26, 9)

// Determine the buy and sell signals
buy_signal = ta.crossover(fast_ma, slow_ma) and rsi < 40 and macdLine > signalLine
sell_signal = ta.crossunder(fast_ma, slow_ma) and rsi > 60 and macdLine < signalLine

// Place the trades
if (buy_signal)
    strategy.entry("Buy", strategy.long, 100)
if (sell_signal)
    strategy.entry("Sell", strategy.short, 100)
The structure of the above code is similar to the previous example. We calculate two moving averages, the fast-moving average (fast_ma) and the slow-moving average (slow_ma), using the ta.sma() function, and then we plot them on the chart. We also define the RSI and MACD indicators using the ta.rsi() and ta.macd() functions.
Our buy and sell signals depend on the crossover of the moving averages, like in the previous example, while also considering additional conditions. For a buy signal, RSI should be below 40, and the MACD line should be above the signal line; conversely, for a sell signal, RSI should be above 60, and the MACD line should be below the signal line. We employ the strategy.entry() to execute trades for 100 shares.
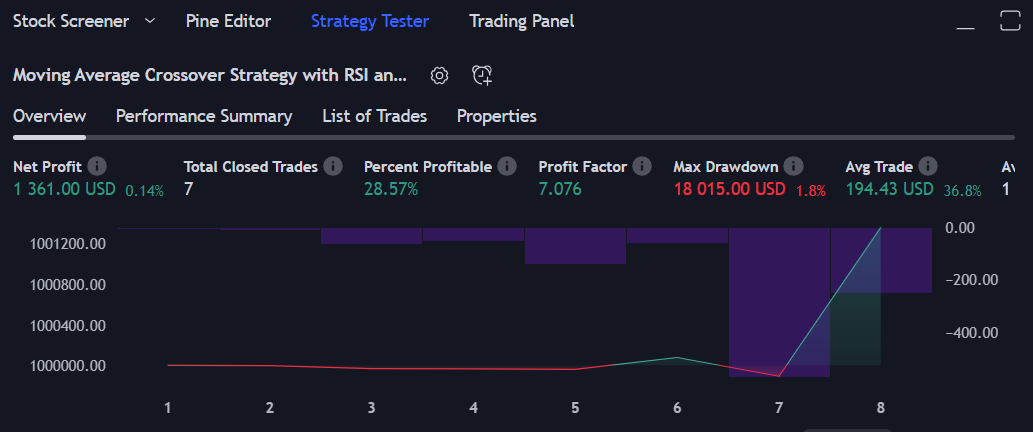
In the output, you can see a net profit of USD 1361.00, far less than the profit we earned using the simple moving average strategy. However, the profit factor in this case is much higher, i.e., 7.076 compared to 1.55 in the case of the simple moving average strategy. These results are because since we added additional conditions based on RSI and MACD values, only seven total trades are executed, resulting in less net profit but a higher profit factor.
An Advanced Example – Advanced Volatility Breakout Strategy
Let’s see a more advanced strategy with more calculations. We will implement the advanced volatility breakout strategy to identify potential breakout opportunities based on volatility.
//@version=5
strategy("Advanced Volatility Breakout Strategy", overlay = true)

// Parameters
atr_length = 14
atr_threshold = 1.5
bb_length = 20
bb_mult = 2.0

// Calculate ATR
atr_value = ta.atr(atr_length)

// Calculate Bollinger Bands
basis = ta.sma(close, bb_length)
dev = bb_mult * ta.stdev(close, bb_length)
upper_band = basis + dev
lower_band = basis - dev

// Calculate Bollinger Band Width
bb_width = (upper_band - lower_band) / basis

// Strategy Conditions
buy_signal = ta.crossover(close, upper_band) and bb_width < atr_value * atr_threshold
sell_signal = ta.crossunder(close, lower_band) and bb_width < atr_value * atr_threshold

// Plot Bollinger Bands and ATR
plot(upper_band, color = color.blue)
plot(lower_band, color = color.red)
plot(basis, "Basis", color = color.gray, style = plot.style_line)
plot(atr_value, title = "ATR", color = color.purple)

// Strategy Execution
if (buy_signal)
    strategy.entry("Long", strategy.long, 100)
if (sell_signal)
    strategy.entry("Short", strategy.short, 100)
The above script begins by initializing various customizable parameters, such as the Average True Range (ATR) length, the ATR threshold, the Bollinger Bands, and the Bollinger Bands multiplier.
We calculate the ATR value using the ta.atr() function and the Bollinger Bands using the ta.sma() and ta.stdev() functions. We then calculate the Bollinger Band width by subtracting the lower band from the upper band and dividing it by the basis band.
We define strategy conditions using ta.crossover() and ta.crossunder() functions. The buy signal returns true when the closing price value crosses over the upper Bollinger band value. Conversely, the sell signal returns true when the closing price value crosses under the lower Bollinger band value. In both cases, the bandwidth should be less than the product of the ATR value and the ATR threshold.
Combining Bollinger Bands and ATR threshold helps filter out potentially false signals that might arise due to temporary price spikes or erratic market movements. This filtering mechanism increases the reliability of the generated buy and sell signals.
Next, we plot Bollinger Bands and ATR value plots using the plot() function. Lastly, we use if condition to execute the strategy.
The output shows that this strategy earns a net profit of USD 9552.00, better than the RSI and MACD strategy but still less than the simple moving average strategy. The profit factor in this case is 1.75, which is slightly higher than the simple moving average profit factor of 1.55.
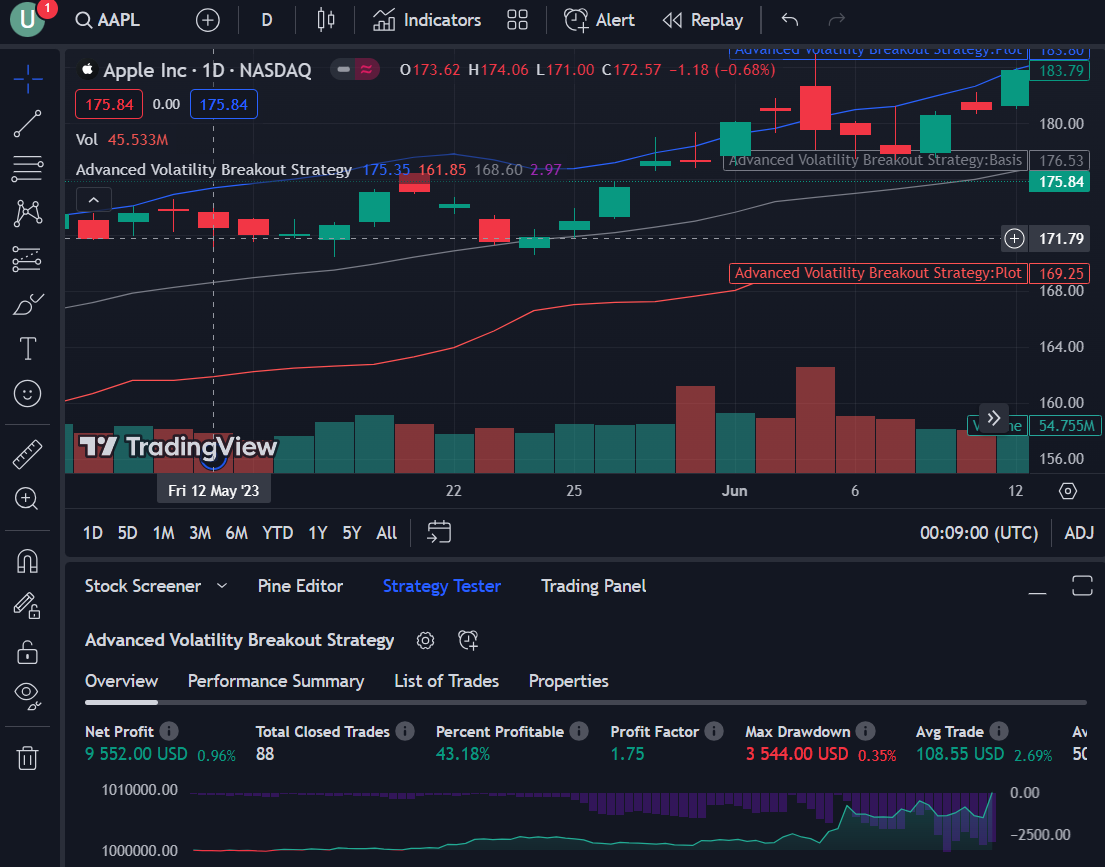
The findings in this section reveal that complexity doesn’t necessarily guarantee superior performance over a simpler strategy. While a complex approach might mitigate risk, it could yield lower overall profits than a riskier strategy. Ultimately, the pursuit of the optimal strategy lies beyond the scope of this article. The key is to seek a balance that aligns with your trading goals and risk tolerance.
And with that, we conclude the coding part of the article. In the next section, I will enlist some pine script alternatives. Following that, I’ll answer frequently asked questions that often arise in the context of Pine Script.
Pine Script Alternatives
Following are some trading tools providing alternatives to TradingView’s Pine Script.
Frequently Asked Questions
How long will it take to learn pine script?
The time it takes to learn Pine Script can range from a day to several weeks or months, depending on the individual’s experience and the depth of knowledge they want to acquire. However, for those possessing fundamental programming knowledge, it’s possible to implement basic strategies within just one day of training and practice.
Is Pine Script similar to Python?
Despite having a syntax similar to Python, Pine Script and Python are two distinct languages with different strengths and weaknesses. PineScript is designed for creating trading indicators and strategies in TradingView. On the contrary, Python is a more general-purpose language used in various applications, including trading.
Is Pine Script a coding language?
Despite having a syntax similar to Python, Pine Script and Python are two distinct languages with different strengths and weaknesses. PineScript is designed for creating trading indicators and strategies in TradingView. On the contrary, Python is a more general-purpose language used in various applications, including trading.
Can you use Python in TradingView?
Yes, you can use Python to process TradingView data. Although PineScript is the primary language for custom indicators and strategies, unofficial Python API wrappers such as TradingView-TA exist for retrieving data.
Can Pine Script execute trades?
At present, TradingView lacks support for real trade execution via Pine Script.
The Bottom Line
TradingView is an excellent tool for creating and seeing custom indicators. It also helps you build and test trading strategies to guide your decisions. This guide shows you how to program with TradingView’s Pine Script language and do various basic and advanced tasks. Now, you can use what you’ve learned to make trading strategies and profits. Happy trading!