VUG and VOO are the two most popular low-cost ETFs by Vanguard. While VUG targets high-growth companies with a concentrated portfolio, VOO is more diversified and corresponds with the broader US economy. This article explains the differentiating features of these ETFs and helps you decide which one is better.
Exchange-Traded Funds (ETFs) are an incredible way to reap benefits from capital appreciation while diversifying your investments and lowering the downside risk. Retail and institutional investors are increasingly moving to passively manage ETFs due to low costs, tax efficiency, transparency, and flexibility.
One of the largest ETF issuers in the United States, Vanguard is considered an industry leader in low-cost funds. Two of its most popular low-cost ETFs are Vanguard Growth ETF (VUG) and Vanguard S&P 500 ETF (VOO). This article is a comparative study of the features of VUG and VOO, their market performance, and their contribution to your portfolio.
Vanguard Growth ETF (VUG)
Launched in January 2004, VUG tracks the CRSP, or the US large-cap growth index consisting of the big and medium cap growth stocks. The ETF has assets under management of $169.4 billion. The three growth factors that the index chooses to use to select stocks are—EPS growth, Investment to assets ratio, and Return on assets.
The Vanguard Growth ETF (VUG) stocks with higher growth potential stocks. Growth ETFs have a higher risk than S&P 500. But on the other hand, growth stocks can have better return potential than many established companies. With more than 250 stocks in the growth category, VUG can help investors diversify their portfolios and minimize their risk.
Vanguard S&P 500 ETF (VOO)
VOO is the Vanguard S&P 500 ETF that tracks the Standard & Poor 500 index. It uses an indexing investment method that keeps an eye on the S&P 500 Index, the most popular performance benchmark in the United States stock market, consisting of 12% mid-cap companies and 88% large-cap companies.
The S&P 500 consists of the 500 biggest publicly traded companies in the United States. Since the VOO tracks the S&P 500 index, which means that they trade for exact similar stocks, it is very appealing to many investors. Each quarter, the fund rebalances itself based on the performance of each of its constituents. The fund has a lower risk than VUG because of its more extensive portfolio.
VOO offers holistic US coverage and is particularly effective if you plan to reinvest your previously earned dividends.
VUG vs. VOO Performance
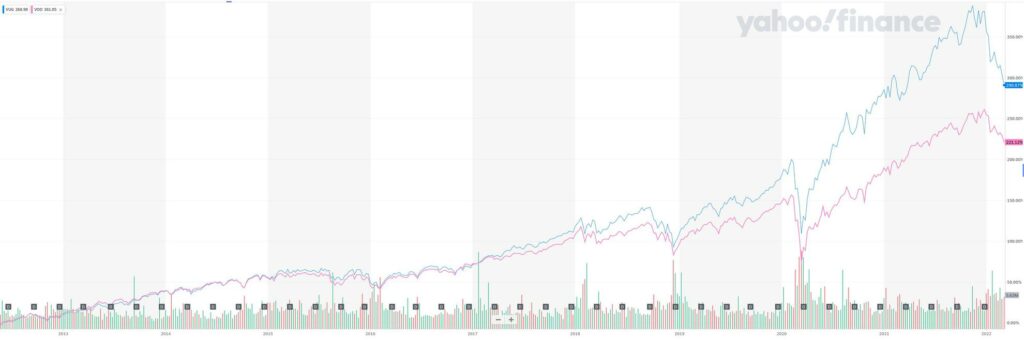
Over the past ten years, Growth ETF Vanguard (VUG) beat VOO by over 2% annually; however, the performance may differ over the next few years. One of the main reasons for the outperformance is that VUG primarily comprises growth companies. Unlike more mature value companies, these growth companies invest a big part of their earnings for future growth. The Vanguard Growth ETF (VUG) has offered investors one of the best long-term returns compared to other Vanguard broad-based ETFs. Between 2011 and 2019, VUG delivered better annual returns than VOO in seven out of the nine positive years. It was only in 2011 and 2016 that VOO outperformed VUG.
| Ticker | VOO | VUG |
|---|---|---|
| 1 Month | -4.23% | -5.87% |
| 3 Months | -3.93% | -11.27% |
| 1 Year | 14.86% | 8.90% |
| 3 Years | 18.02% | 22.79% |
| 5 Years | 15.02% | 19.14% |
| 10 Years | 14.56% | 16.29% |
2018 was the only instance when the two ETFs recorded negative growth. VUG had returns of -3.31%, while VOO had returns of -4.5%.
Looking at the past performance, the Growth ETF Vanguard VUG has offered better annual returns than VOO. The 10-year annualized return for the VUG has been a stunning 19.30% through Dec. 31, 2021. The ETF lost -4.60% as of January 2022 and has roughly risen 23.28% last year.
The ETF has a beta of 1.04 and a standard deviation of 19.97% for the trailing three-year period, which means it’s a little more volatile than the VOO, which has a beta of 1.00 and a standard deviation of 18.53% during the same period. VOO has a dividend yield of 1.57%, which is higher than that of VUG, with a dividend yield of 0.63%.
Investors who wish to get the best overall results within their portfolio should be looking toward future potential instead of past performance.
VUG vs. VOO Composition
Growth ETF Vanguard (VUG) only comprises 267 growth companies, which is lesser than the stocks compared to VOO. On the other hand, VOO reflects the S&P 500 index, which is mainly dominated by the stocks of the big companies in the US, comprising both value and large growth companies. This is why it has an extensive list of holdings.
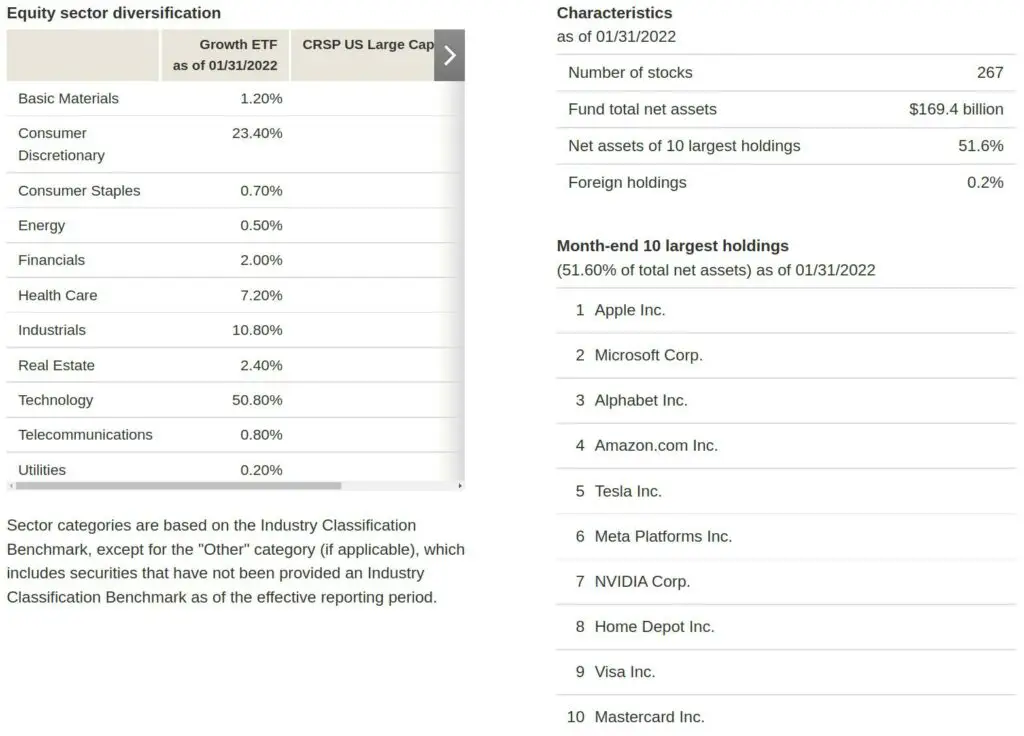
For VUG, the top 10 holdings belong to the technology sector and comprise 50.8% of the fund’s total net assets. The other two dominant sectors are Consumer Discretionary at 23%, and Industrials at 10.8%. In terms of individual holdings, Apple Inc. (AAPL) comprises 10.35% of total assets, followed by Microsoft Corp. (MSFT) and Alphabet Inc. (GOOG).
The portfolio is not too diversified, and if there is any downturn in the sector, it could impact the Growth ETF Vanguard (VUG) fund.
Vanguard S&P 500 ETF (VOO) has 508 holdings, with the top 10 holdings accounting for 28.7% of the fund. Just like VUG, even VOO’s top 10 holdings are concentrated in the technology sector.
One hundred eighty companies overlap in the VUG and VOO portfolios; thus, only 77 are unique to VUG. As VOO tracks the value companies of the S&P500, any investment in VOO is impacted by changes in a particular sector in the United States and the economy. If the retail sector takes a beating, it would adversely affect the retail stocks and the performance of VOO.
VUG vs. VOO Expense Ratios
When considering an ETF’s total return, expense ratios are an essential factor, and cheaper funds can significantly outperform their more expensive counterparts in the long term if all other factors remain equal.
| Ticker | VOO | VUG |
|---|---|---|
| Issuer | Vanguard | Vanguard |
| Expense Ratio | 0.03% | 0.04% |
| Number of Holdings | 508 | 269 |
| Assets Under Management | $266 Billion | $74 Billion |
| Average Daily Volume | $3.71 Billion | $377 Million |
| Underlying Index | S&P 500 | CRSP US Large Growth |
VUG Vs. VOO both have a low expense ratio. Annual operating expenses for VUG are 0.04%, while that of VOO was at 0.03%, making it one of the least expensive products in this space, be it mutual funds or ETFs.
Is VUG or VOO Better?
Now that we know about the key differentiating factors of Growth ETF Vanguard (VUG) and VOO, we can see which ETF is better. The choice between VUG and VOO depends on your current situation and investment goal. VUG is a better option if interest rates stay accommodative if you aim to grow your portfolio. It isn’t too diversified and relies heavily on high-growth tech companies, but VUG could also be slightly more volatile. The volatility of VUG is nearly 31.5%, which is higher than VOO’s volatility at 23.59%.
On the other hand, VOO offers a more diversified portfolio. Only 28.7% of the portfolio is focused on the technology sector. So, if you are looking for more stability, then VOO is a better option. VOO with a higher dividend yield is a clear winner over VUG if you seek dividends.
VUG Vanguard Growth ETF offers its investors one of the best long-term returns compared to other broad-based ETFs from Vanguard. However, things have begun to change, with the Federal Reserve changing its interest rate stance.