Year-over-year (YoY) is a method of analyzing data between two comparable periods on an annualized basis. Understanding how to calculate and what YoY values are can help you interpret financial and economic data more effectively.
But it’s not enough to know how to calculate year-over-year values; it’s also essential to understand the advantages and disadvantages. This post will cover how to do just that; we’ll discuss the calculation, look at some examples, and mention the benefits and drawbacks of using YoY timeframe analysis.
The Value of YoY
Year-over-year (YoY) is “a comparison of a company’s current earnings or other financial performance with the same data for the previous year”. This means you’re comparing financial data from one year to that same period of the previous year. YoY analysis is a popular tool for evaluating a company’s performance, but why?
When comparing a company’s performance against its past performance, the goal is to provide valuable and informative data.
The problem is that performance analysis is often complicated. To draw out valuable data, you need to eliminate the influence of various factors. YoY data can help limit one of the most confounding variables for companies – seasonality.
The Advantages of YoY
YoY’s most significant advantage is that it provides data about a company that considers the business’s varying performance throughout the year, known as seasonality.
While the degree to which seasonality affects a business varies, almost all businesses see some impact on performance from seasonality. If a company always has its best performance in June, then comparing July’s numbers to June’s figures will make it look like the company is performing poorly. If you instead compare July’s performance to the performance of the past July, you may rather see that performance has beaten expectations.
Let’s look at an example to clarify.
A toy company reports first-quarter sales. These are the sales that occurred between January and March. Compared to the previous quarter (October through December of the past year), these sales numbers are considerably lower. Since the holiday season occurs in the fourth quarter of the year, many businesses see higher performance, and this toy company is no exception. But the toy company still wants a way to gauge how well its toy sales have performed. By comparing the sales to the first quarter of the previous year, the toy company can better understand its performance since it has now accounted for its business’s seasonal nature.
The other advantage of YoY is that it can help make long-term trends more apparent. For example, YoY performance may help a company gain a more accurate idea of its handling an economic downturn.
The Disadvantages of YoY
There are a few disadvantages of using YoY data, most of which are caused by an overreliance on YoY data instead of using it as one of many sources of information.
One potential issue that may arise is caused by lumping together the performance of an entire year. While performance is more often calculated on a monthly or quarterly basis, there are times when it’s calculated on an annual basis. While this yearly YoY data may provide useful information, it’s especially important to use it in conjunction with other data. That’s because full-year calculations remove trends that may occur quarterly or monthly.
For example, maybe the numbers for this year look better than those from the previous year, but this is only due to an incredibly high-performance level for a couple of months. When looking at this data, you could mistakenly assume that the entire year had better performance than the whole previous year, when only two months boosted the numbers for the entire year.
You often need to instead calculate YoY for various periods for trends in the data to become more apparent.
Calculating YoY
Now that we’ve seen how to use and not to use YoY calculations let’s look at how to calculate YoY. The formula is straightforward.
To calculate your YoY percentage, you subtract the previous year’s value from the current year’s value. You then divide that number by the last year’s earnings. To turn the number into a percent, you multiply the number by 100.
Let’s use earnings as an example. If the period you want to compare is a quarter, month, etc., all you need to do is use that period’s earnings instead of the year’s earnings.
Written as a formula, it looks like this:
(CurrentPeriodEarnings – LastPeriodEarnings)/LastPeriodEarnings * 100
Let’s walk through the calculation with an example.
Let’s say your company sold 5,780 widgets last year. This year they sold 7,058 widgets. To calculate the YoY increase, you would subtract the current year’s number from the previous year’s figure, which comes out to 1,278. You would then divide this number by the past year’s sold widgets of 5,780, which gives you 0.22 (when rounded to the nearest hundredth). To turn this number into a percentage, you multiply it by 100, providing 22%. This means YoY widget sales increased by 22%.
You may be wondering what happens if the current period’s earnings are less than the last period’s earnings. If this is the case, you’ll end up with a negative number. If the YoY calculations are negative, the company had negative growth from one period to another.
YoY Metrics
YoY calculations can provide data for any metric that can be quantified and compared to the previous year. The most common YoY metrics include net income, sales revenue, earnings per share (EPS), and cost of goods sold (COGS).
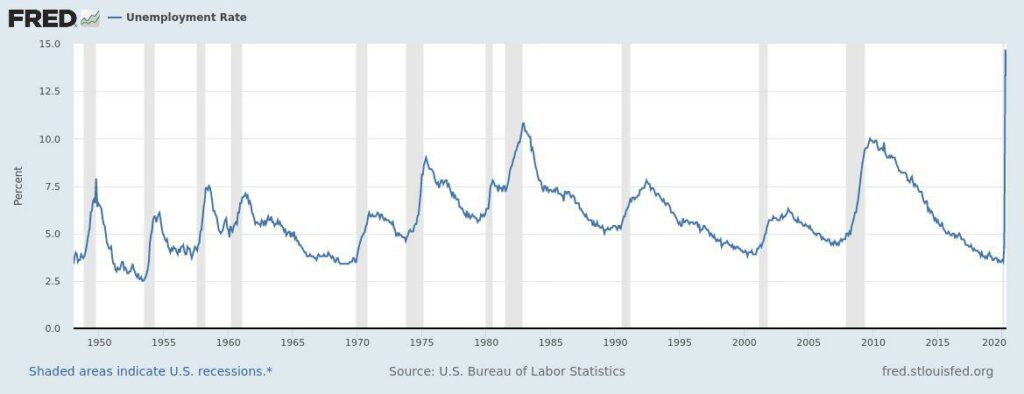
While up to this point, we’ve focused on YoY calculations for companies, YoY calculations may be used for other things. One typical example is to provide information about the economy. When YoY is used as an economic indicator, the metrics used vary from those used when evaluating a company. Some of the most common metrics used for YoY calculations about the economy include the gross domestic product (GDP), inflation, interest rates, and unemployment rate, as shown below.
Regardless of the metrics used or the entity being evaluated, the YoY formula remains the same.
How to Use YoY Data
When looking at YoY calculations, it’s essential to keep in mind that it’s not necessarily about whether growth was high or low. It’s often more about whether or not a company meets expectations.
Let’s say your company had YoY sales revenue of 10 percent. If the economy is contracting and your competitors see negative growth, your company would likely view this number positively. On the other hand, if your company had YoY sales revenue of 10 percent after releasing a new product that was supposed to increase sales revenue by 25 to 40 percent, your company would likely find this 10 percent YoY data disappointing.
When publicly traded companies release their quarterly earnings report, you’ll often see this. The company’s stock price often increases or decreases based on how the numbers compare to estimates.
The Bottom Line
As we’ve seen, YoY calculations serve as a helpful tool. Still, to gain a holistic understanding of the performance of any entity, YoY calculations must be only one of many tools.