The Anchored Volume Weighted Average Price (AVWAP) is making waves, and it might be your ticket to the top tier of traders.
I’ve rigorously backtested AVWAP, and the findings are compelling. If you’re a trader keen on data-backed strategies, let me guide you through the AVWAP maze.
You can follow along using the AVWAP Backtest Jupyter Notebook and the associated YouTube video. Ready to dive in?
What Is Anchored Volume Weighted Average Price (AVWAP)?
AVWAP, or Anchored Volume Weighted Average Price, is a technical analysis tool that has gained popularity among traders and investors in recent years. Its origin can be traced back to the early 1990s when it was first popularized by Brian Shannon, a seasoned trader who realized the need for an indicator that could provide better insights into market trends.
But before we dive into AVWAP, let’s quickly discuss VWAP.
How Does Volumed-Weighted Average Price Work? (VWAP)
VWAP, short for Volume Weighted Average Price, is a benchmark trading indicator. It’s computed by tallying the dollars traded in every transaction (price multiplied by shares traded), then divided by the total shares traded that day.
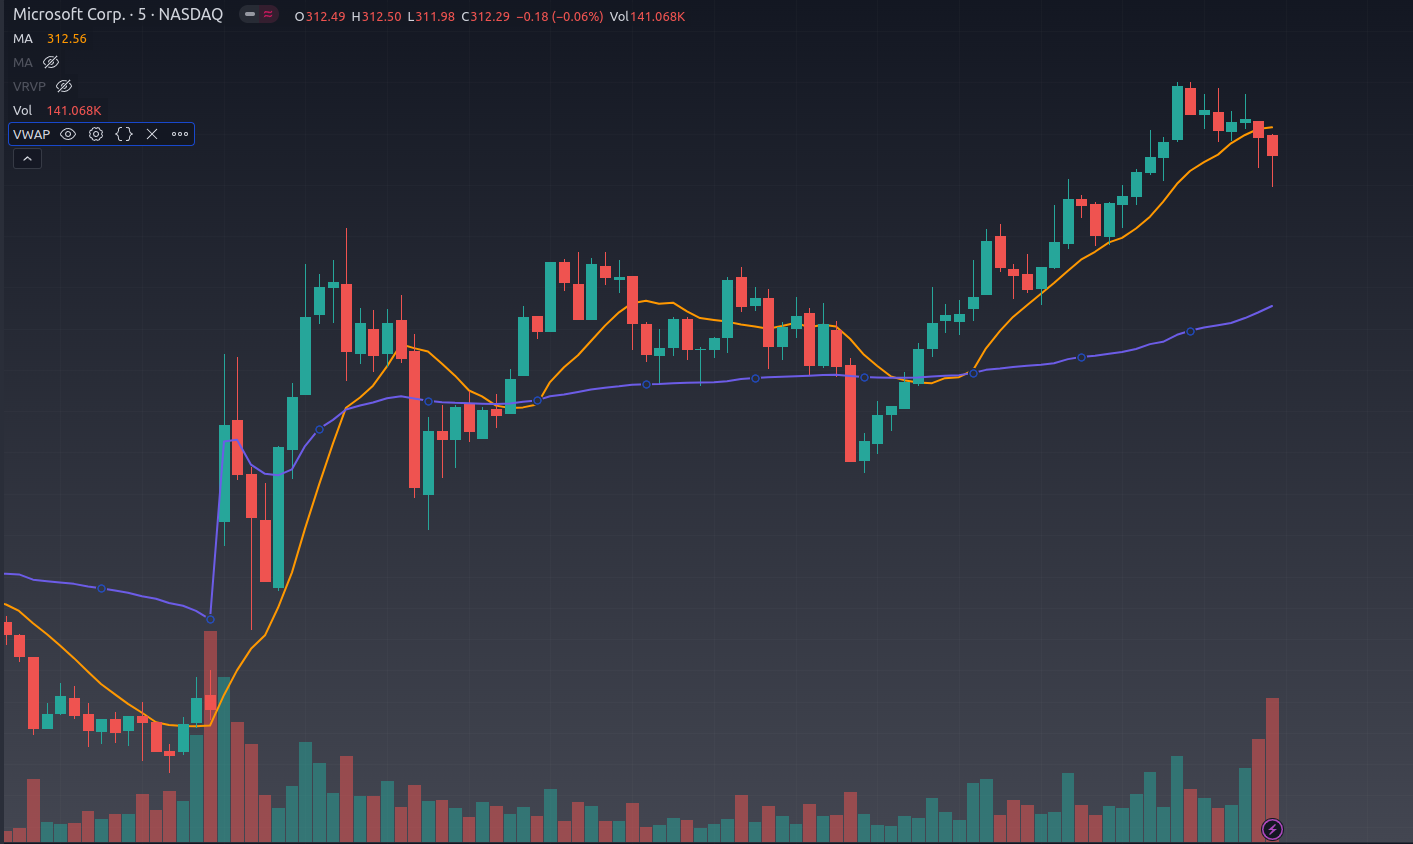
An example is visible on the Microsoft daily chart below (May 10th, 2023), where VWAP is shown as a purple line.
Check my previous posts for more insights into how institutions utilize VWAP,
Now, let’s shift gears to AVWAP.
How Does Anchored VWAP Work? (AVWAP)
AVWAP, or Anchored VWAP, calculates an asset’s average price, considering volume over a chosen period. It factors in not just closing prices, but the volume of each trade:
- Select a starting point
- Multiply each trade’s price by its respective volume.
- Add up all those products.
- Divide this sum by the total traded volume.
The key difference: VWAP runs from the start to the end of a trading day, whereas AVWAP allows a trader to designate the starting point.
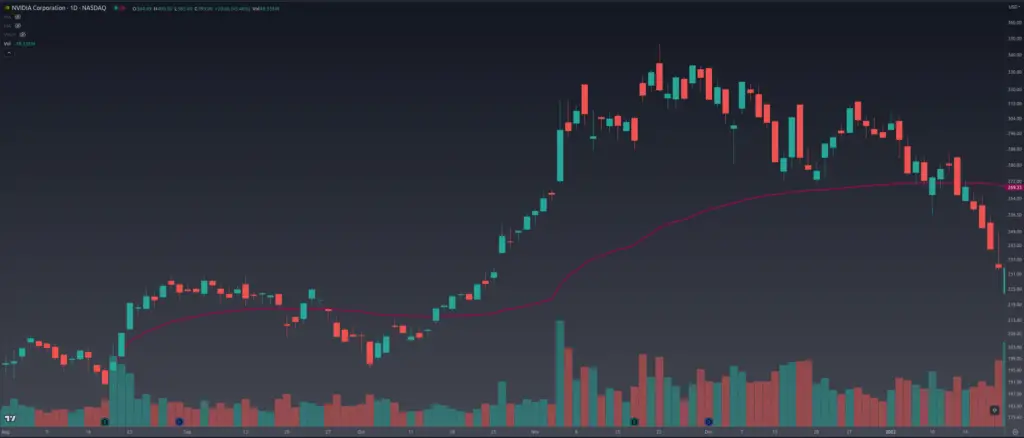
Notice in the below Nvidia daily chart the purple AVWAP indicator and how the anchoring takes place on August 19th, 2021.
Understanding AVWAP with a Basic Example
To grasp how Anchored Volume Weighted Average Price (AVWAP) works, consider the stock XYZ. A trader wants to investigate its price movement over a week, anchoring AVWAP from Monday. Here’s how it’s done:
| Day | Closing Price | Volume | Price x Volume | AVWAP |
| Mon | $20 | 1000 | $20,000 | $20.00 |
| Tue | $22 | 1500 | $33,000 | $21.67 |
| Wed | $21 | 1200 | $25,200 | $21.57 |
| Thu | $23 | 1800 | $41,400 | $22.14 |
| Fri | $24 | 2000 | $48,000 | $22.35 |
Step 1: Calculate daily volume-weighted price: Multiply each day’s closing price by its volume. You can also use the typical price, which is (high + low + close) / 3. We’ll use close because it’s easier to demonstrate.
Step 2: Sum up these values: Total volume-weighted prices for the week ($20,000+$33,000+$25,200+$41,400+$48,000 = $167,600)
Step 3: Divide by total volume: The sum ($167,600) divided by the total weekly trading volume (7500) gives us AVWAP: $22.35
This AVWAP value provides insight into where the bulk of transactions took place during the week, unlike a standard moving average which doesn’t account for volume.
The AVWAP column shows the VWAP at the end of each trading day, calculated by dividing the cumulative ‘Price x Volume’ by the cumulative ‘Volume’ up to that day.
Does AVWAP Really Work? (Backtest Results)
The AVWAP works but it’s no better than a simple moving average of the same duration, according to a ten-year vectorized backtest using autoregression of the S&P500 constituents.
Here’s my methodology for a quick-and-dirty indicator backest. The rationale is that if an indicator works, it has to have predictive power. You can regress the prior day’s indicator values, I used percentage from close, against the next day’s returns to see if there’s any predictive power.
VWAP vs. SMA Backtest Results
Let’s use Apple’s daily returns vs. the period day’s vwap and sma distance as an example:

- The blue dots are the VWAP distances from close: (vwap – close) / close
- The orange dots are SMA distances from close: (sma – close) / close
- The green line is a regression of the prior day’s VWAP distances against daily percentage return.
- The red line is a regression of the period day’s SMA distances against daily percentage returns.
The titles show the formula, where the y value is any Alpha – in this case, we see 0.001 alpha from both vwap and sma. So if there’s predictive power, there’s not much and it’s roughly the same – at least for Apple.
I ran this same process for all of the S&P 500 constituents and summed up the Alpha, which ended up being roughly equivalent. So it seems as though vwap on the daily is about as good as a simple moving average.
Using a VWAP and SMA period of twenty days. The 10 and 50-day were roughly the same.
So now that we know that VWAP doesn’t provide any alpha over a standard moving average on the daily timeframe across multiple periods, let’s turn our attention to AVWAP.
AVWAP vs. ASMA Backtest Results
Backtesting AVWAP is exactly the same as the above, except that we have to determine anchor points. The anchor points are supposed to be around impactful events such as earnings or a large partnership announcement. The great thing is we can use volume to algorithmically determine these. Anytime there’s a spike in volume where volume is 3x higher than the 20-day average, we anchor.
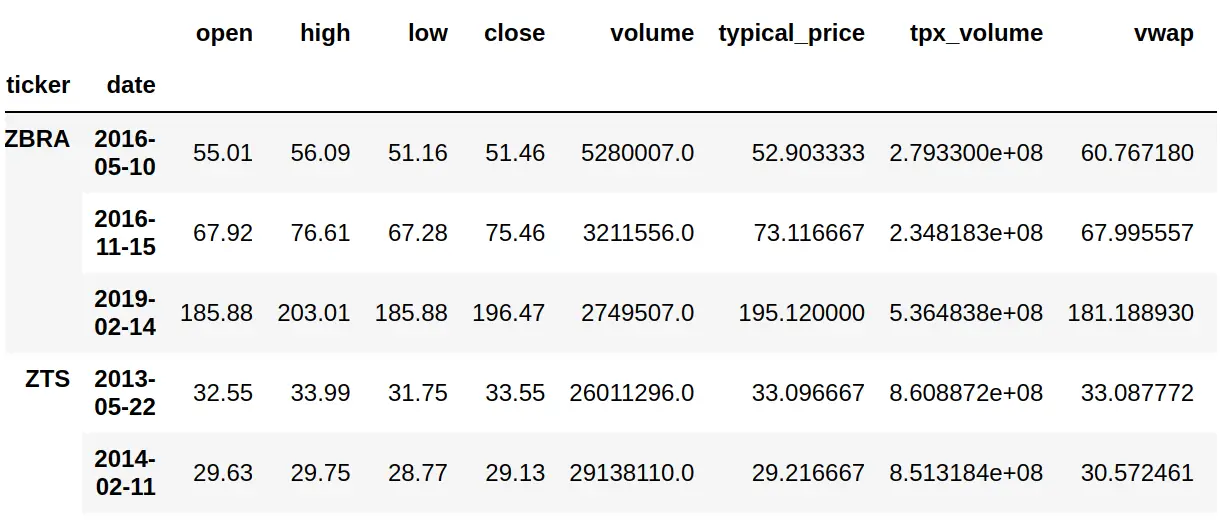
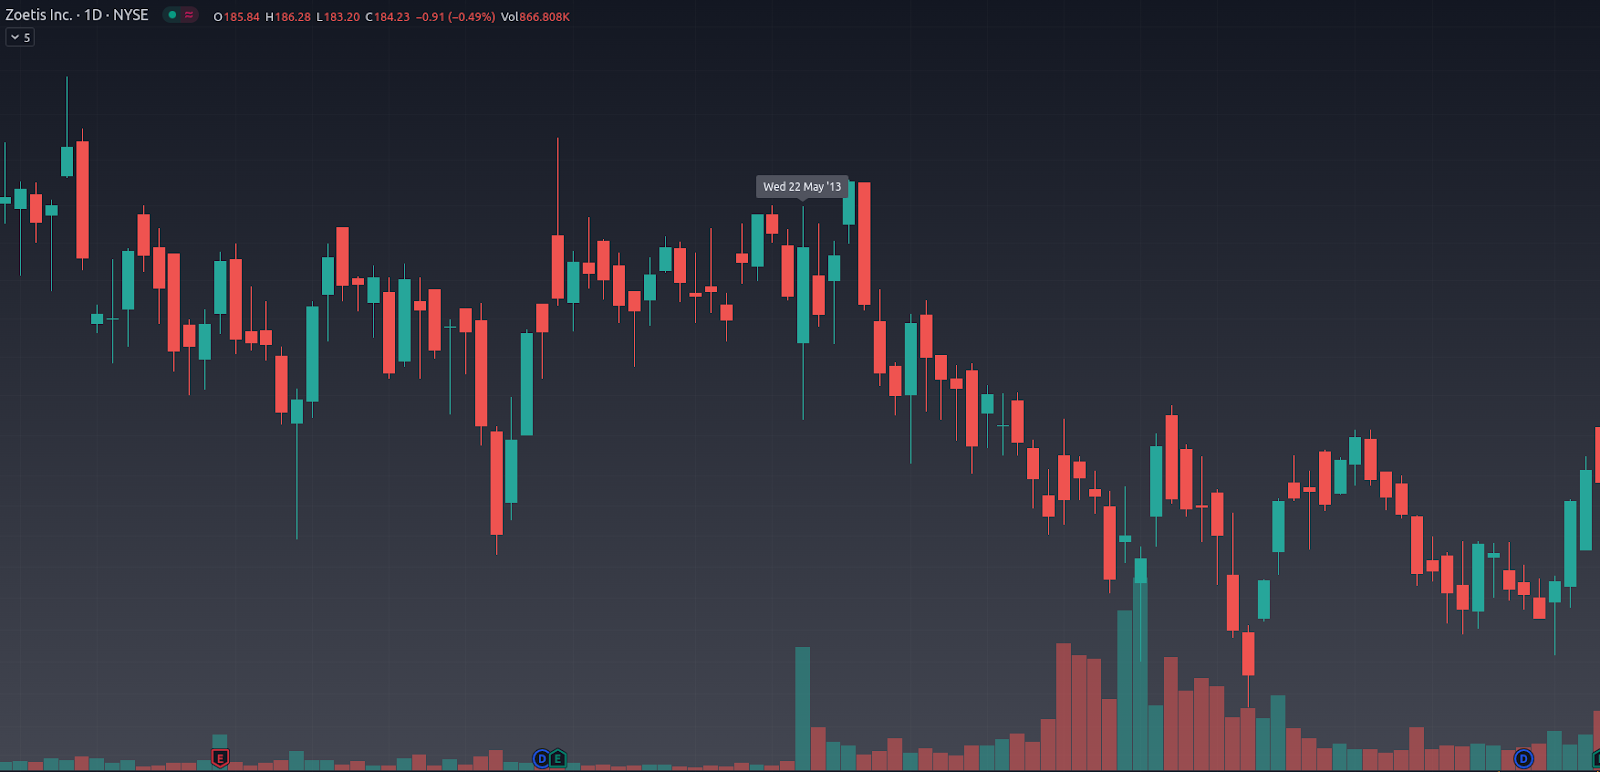
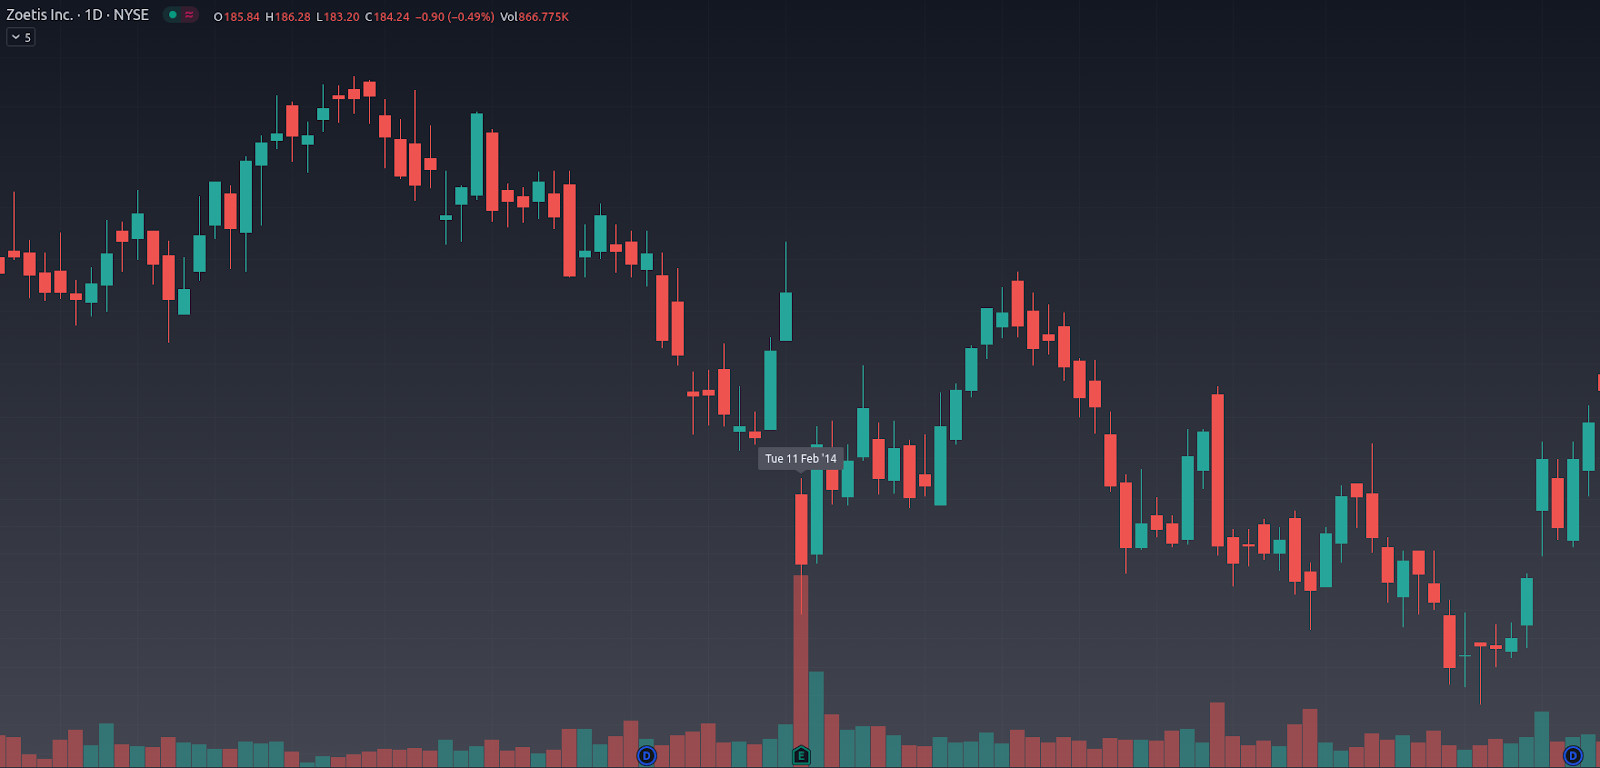
This works well as we can see from the Zoetis (ZTS) daily chart.
With the anchors identified, we run the same process where we regress the prior day’s AVWAP and ASMA distance percentages against the next day’s daily return.

Using Apple once again as an example:
- The blue dots are the anchored VWAP percent from close: (avwap – close) / close
- The orange dots are anchored SMA percent from close: (asma – close) / close
- The green line is a regression of the prior day’s AVWAP against the daily return.
- The red line is a regression of the period day’s ASMA distances against the daily return.
Notice in this example the y value is 0.000, which means there isn’t any alpha here while the anchored SMA does produce 0.001.
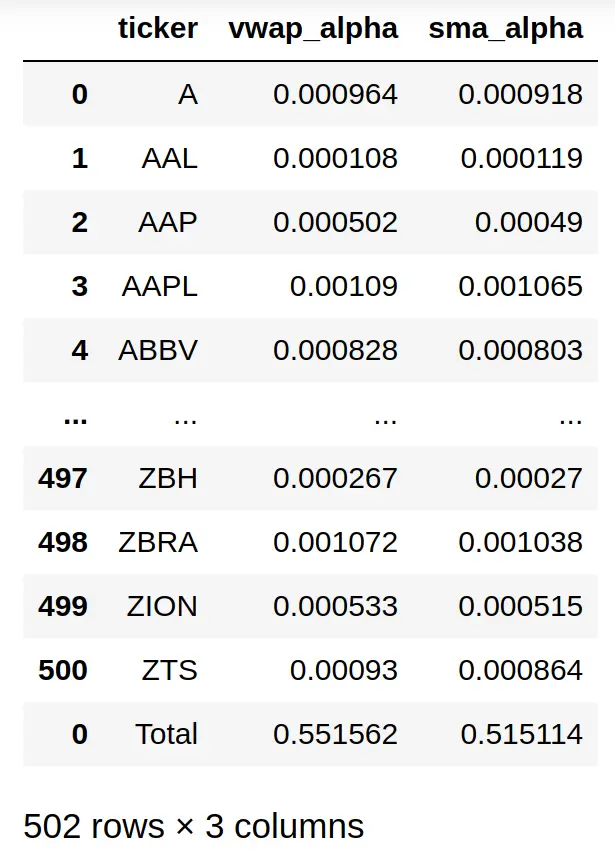
Let’s run this process again for the entire S&P 500 constituents.
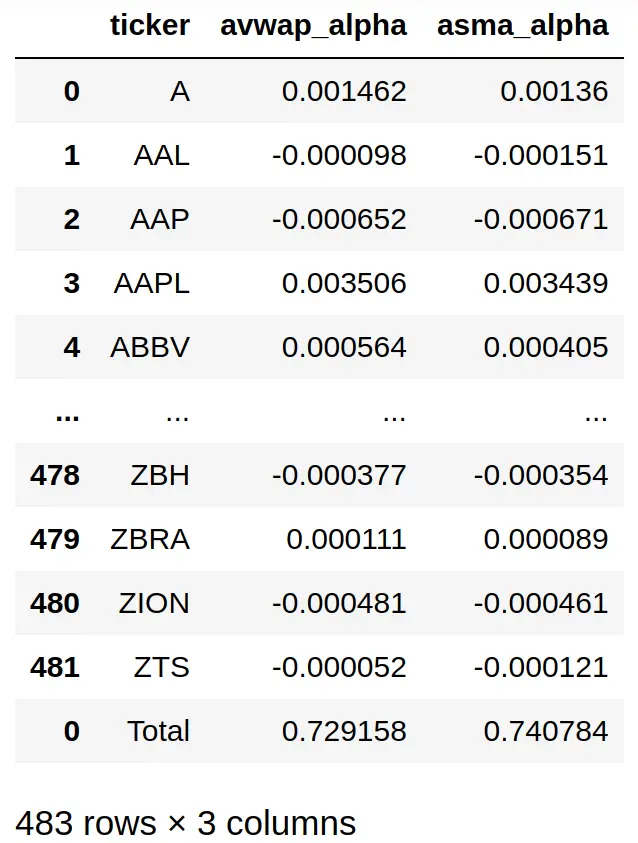
Interpreting the Data: Anchored Alpha?
The numbers don’t lie. It appears as though there’s more alpha anchoring from volume spikes than simply following a moving average. But here’s the kicker – it’s not because of volume. It’s because large volume spikes often kick off new trends as the market assimilates the information.
That’s why anchored SMA performs equally well, if not better, than AVWAP.
Conclusion: Anchor your AVWAP Expectations
In conclusion, the buzz around AVWAP as a game-changer in the trading industry isn’t unfounded. This tool indeed brings a new dimension to understanding market trends by incorporating volume into price analysis. However, after a thorough examination and backtesting, it’s clear that while AVWAP can be effective, it doesn’t necessarily outperform a simple moving average (SMA) over the same duration.
One of the key revelations from our backtests was the discovery that significant volume spikes often precede the initiation of new trends. This insight leads to a more nuanced perspective on AVWAP’s efficacy—it’s not the volume-weighted aspect that generates alpha, but rather the anchoring around impactful events that move markets.
That said, AVWAP does offer unique utility by providing a more dynamic and adjustable tool for tracking price averages over a trader-defined period, which a standard VWAP does not offer. Therefore, AVWAP can still be a valuable addition to a trader’s toolkit, but it’s important to approach it with a clear understanding of its strengths and limitations.
Ultimately, AVWAP is not a magic bullet to ascend to the top 10% of traders. Successful trading requires a comprehensive approach that includes a deep understanding of markets, a well-diversified toolkit of strategies, and consistent application of risk management principles. Happy trading!