CANSLIM is a bull market trading strategy created by William J. O’Neil. It attempts to identify high-growth stocks before making their largest price gains using seven criteria. The strategy aims to pick stocks before large institutional buying while cutting losses quickly and letting profits run.
There’s a lot to cover. If you’re in a hurry, you can skip to the CANSLIM rules at the bottom of the page; however, I suggest you read everything before you implement CANSLIM as an investing and trading strategy.
What is CANSLIM?
CANSLIM is a bull market trading strategy for identifying stocks with high growth potential. The system uses seven criteria to select stocks, each of which is represented by one of the letters in the strategy’s name (C-A-N-S-L-I-M). CANSLIM also includes trading rules to attempt to purchase stocks before a big runup while limiting losses.
As with almost any stock-trading strategy, the goal of CANSLIM is to assist traders in finding stocks that have the potential to outperform the overall market and other stocks in the same industry.
CANSLIM is typically best implemented in fast-moving markets. That’s because CANSLIM is a bullish strategy. This means CANSLIM is designed to make money in stocks when the market tide is in an uptrend.
This contrasts with a bearish or short strategy implemented when traders believe stock prices will drop. A bearish system allows traders to profit from decreasing prices by essentially betting against the stock.
From an academic perspective, utilizing the CANSLIM strategy in a bull market makes sense as CANSLIM buys high beta and high growth stocks, which typically do best when the markets are moving up.
One way CANSLIM stands out from other trading strategies is that it uses both technical analysis and fundamental analysis criteria.
We’ll look at each of the seven criteria used in the CANSLIM strategy, but first, we’ll take a quick look at the creator of CANSLIM: William J. O’Neil.
Who is William J. O’Neil?
O’Neil began using his trading strategy, CANSLIM, to pick stocks. O’Neil’s CANSLIM strategy has remained essentially the same throughout the years, meaning the version he used in the 1950s relies on nearly the same criteria as the modern version.
By relying on his CANSLIM strategy, O’Neil quickly began outperforming his peers. Not long after joining Hayden, Stone, & Co, O’Neil became the firm’s best-performing stockbroker. O’Neil found enough success that only five years after starting with Hayden, Stone & Co., he decided to branch out independently.
In 1963, O’Neil founded William O’Neil & Co. The firm continued to implement O’Neil’s CANSLIM trading strategy and continued to find considerable success.
Beyond the CANSLIM strategy, O’Neil and his firm stood out due to their early computer technology adoption.
William O’Neil & Co. was the first firm to create a computerized database of daily security information, which tracked over 70,000 companies from all over the world. The firm sold the research gathered from its database to various institutional investors.
CANSLIM Book
Part of the reason the CANSLIM method is so popular today is that O’Neil did not keep the strategy to himself. O’Neil created, first a newspaper, and then several books to help other traders implement the CANSLIM method.
First, we’ll talk about the newspaper: Investor’s Business Daily.
In 1983, William J. O’Neil founded the Investor’s Business Daily newspaper. Investor’s Business Daily taught other traders how to use the CANSLIM method and gave them the tools necessary to implement the strategy. While Investor’s Business Daily is still in print today, O’Neil’s approach has reached even more traders through the various books he published.
O’Neil wrote a few different books, including The Model Book of Greatest Stock Market Winners and 24 Essential Lessons for Investment Success. Still, his most famous book, by far, was How to Make Money in Stocks, in which he laid out his full CANSLIM strategy.
If you’re interested in learning all the ins and outs of the CANSLIM strategy, the book is certainly worth a read. Still, for those who prefer the Cliff Notes, the rest of this post will go over O’Neil’s strategy’s critical elements.
We’ll begin by looking through the seven criteria that make up the CANSLIM strategy.
CANSLIM Rules of Investing
One of the significant advantages of the CANSLIM strategy is that it’s far more accessible than many other trading strategies. To decide if a stock is worth investing in, a trader need only go down the checklist and ensure that the security meets each of the seven criteria.
C – Current Quarterly Earnings
O’Neil’s strategy’s first criteria is based on the company’s latest quarterly earnings per share, also known as the current quarterly earnings per share.
Earnings per share is the profit of a publicly-traded company per outstanding share of stock. To calculate earnings per share, you take the net profit and divide it by the number of outstanding shares. Typically, earnings per share calculations use annual or quarterly earnings.
So, how does a stock meet the CANSLIM current quarterly earnings requirement?
The CANSLIM method requires companies to have at least an 18% to 20% increase in current quarterly earnings per share than the same quarter of the previous year.
For example, if you were looking at a company’s Q3 2020 current earnings per share, you would compare those to the quarterly earnings per share from Q3 of 2019. If the quarterly earnings growth had increased by 16%, that stock would have failed to meet the 18% threshold. This would rule the company out as an investment option.
Current quarterly earnings are included as a CANSLIM criterion because current quarterly earnings growth can provide valuable information about a company. Specifically, earnings per share is useful for gaining insights into the profitability of a company.
A company with high earnings per share growth means that the company is both profitable and fast-growing.
A – Annual Earnings
The next CANSLIM criteria is annual earnings.
According to the CANSLIM method, you should look for high-growth stocks whose last three years have seen increased annual earnings. This means that over the previous three years, every year saw annual earnings growth.
The threshold for this one may vary slightly, depending on the situation, but in general, shoot for annual earnings growth of 25% or higher. But even if a company meets the annual earnings growth threshold, it may not fully meet the CANSLIM annual earnings requirement.
The annual earnings requirement seeks to find high-growth stocks that not only have strong earnings but that are using those earnings well. A company may have a period of short-term success and see a few years of increased profits, but if the company is not intelligently reinvesting its earnings, then this growth is unlikely to last.
Though there is no way to guarantee a company will use its money well, looking at the Return on Equity (ROE) can help you get a general sense. What counts as a “good” ROE? According to the CANSLIM method, ROE must exceed 17%.
Looking at both annual earnings growth and ROE allows you to see if a company has been profitable over the last few years AND whether or not that growth has benefited shareholders.
N – New
Next up is “new”.
According to O’Neil, companies needed something new to drive the sort of growth required for CANSLIM companies.
New may mean a few different things, which is arguably the criterion open to the most interpretation. The most obvious example of something new is a new line or product, but this is not the only option. A new company or a company with new management may also meet the new requirement.
While new is open to some interpretation, it’s essential to keep in mind the strategy’s essence.
Every company is always changing and evolving in some way. It’s easy to look at a company, especially one you want to meet all the requirements, and consider any minor update as sufficiently “new” to pass the test.
If you’re unsure if the company in question meets the new requirement, the question you need to ask yourself is whether this new element is relevant enough to impact the stock’s share price substantially. If the answer is anything other than a resounding yes, then you should probably exclude this company from your CANSLIM portfolio.
S – Supply and Demand
The “S” in CANSLIM stands for supply and demand.
The theory of supply and demand is one of the fundamental components of finance and economics. At its most basic level, the theory states that when there is more demand than supply, prices increase, and when there is more demand than supply, prices decrease.
In the context of stocks, supply and demand refer to the desire to purchase a stock related to stock shares available.
O’Neil recommends stocks with fewer shares outstanding as these stocks often can perform well since supply is restricted. The goal is to get into these future big movers before the institutional demand picks up, making these stocks rocket due to the already constrained supply.
There is academic evidence that suggests there is an illiquidity premium.
Additionally, O’Neil recommends buying stocks whose average daily trading volume is higher than the average of the last three months.
One event that O’Neil discusses that simultaneously increases volume and reduces supply is stock buybacks.
A stock buyback happens when a company purchases shares back from shareholders. When a stock buyback occurs, there are fewer shares available to traders, which automatically means less supply.
Stock buybacks also often signal that the company’s management feels confident about the direction in which the company is headed and anticipates an increase in demand.
As you can imagine, as a general rule, a recent stock buyback is likely to have a positive impact on supply and demand criteria. Still, like any indicator, it is not a guarantee about the state of a company.
A stock buyback typically makes a company look good. Companies know this, and therefore a company can conduct a stock buyback to obfuscate its poor shape.
In summary, the law of supply and demand is to your advantage. Lower liquidity stocks with increasing volume and confident management buying back shares is the trifecta for this CANSLIM category.
L – Leader or Laggard?
Is the company is a leader or a laggard in its industry?
According to O’Neil, the way to decide if a company met this requirement is to consider the company’s Relative Price Strength Rating, a proprietary rating published in O’Neil’s newspaper, the Investor’s Business Daily. The Relative Price Strength Rating compares a stock’s performance to other stocks in the market over the last year.
It’s essential to judge a potential stock relative to its competitors and the overall market. For example, even reasonably high returns may still leave a stock lagging behind others in its industry when the market performs well.
The proprietary RS Rating measures a company’s price performance compared to the rest of the market for the past year. Every stock is assigned a rating from 1 to 99. A 95 rating means that a company’s share price has performed better than 95% of all other companies. An RS score of 25 indicates that a company’s price performance is worse than 75% of all other companies. O’Neil recommended only considering stocks with a Relative Price Strength Rating of 80 or higher. Only at this level did he view a stock as a true leader.
I – Institutional Sponsorship
The penultimate requirement a stock must meet in the CANSLIM strategy is institutional investors. It takes big money to push stocks up big.
According to O’Neil, a company must have a sufficient amount of shareholders who are some form of institutional investors. Institutional investor sponsorship could include mutual funds, insurance companies, pension funds, or other institutional investors.
Why does it matter if shareholders are institutional investors?
Institutional investors have more expertise and resources than retail investors. Investment from an institutional investor bodes well for a company since it is essentially a vote of confidence in that company from someone that has a good chance of knowing what they are doing (at least more so than the average retail investor).
This is perhaps one of the most complicated of the seven CANLSIM criteria. That’s because while some institutional sponsorship is good, more is not better.
CANSLIM investors want to invest in a company before most institutions as institutional buying drives up stock prices.
Furthermore, not all institutional sponsorship is considered equal. This is because though institutional investors have more experience and resources, those with better performance carry more weight. For example, a mutual fund with good historical returns investing in a stock is viewed more favorably than a mutual fund with low historical returns investing in the same stock.
Therefore, the institutional sponsorship requirement includes considering both the quantity and quality of its shareholders.
O’Neil’s recommended way of determining institutional sponsorship quality was a mutual fund’s Month Performance Rating, another metric published in Investor’s Business Daily. Funds received a letter grade based on their performance over the previous 36 weeks. O’Neil recommended only considering sponsorship of value if the fund received a rating of B+ or higher.
M – Market Direction
The final of the seven CANSLIM criteria considers the general market direction.
O’Neil believed that even if a stock met the other six criteria if a trader were wrong about the market direction, that trader would likely lose money. O’Neil stated that recognizing when the market has topped or bottomed is 50% of the whole complicated investment game. This is why O’Neil recommended that traders follow market indices to understand market direction and market trends.
O’Neil suggested observing the following indices:
You can often gain a more well-rounded perspective of the market and the market direction if you also follow an index with many companies, such as following the S&P 500 instead of the DJIA.
Additionally, I feel that it’s wise to understand how the various stock market sectors are moving relative to the market direction as a whole.
If you add any additional indices to your watchlist, it’s essential to understand the different weighting practices. For example, information technology stocks make up 25.7% of the S&P 500, while almost half (48.39%) of the NASDAQ is made up of tech stocks. One is not inherently better than the other. Still, suppose tech stocks outperform other industries (as they have done many times in the last few years). In that case, you’ll see very different numbers for the two indices even though both theoretically track the same thing – the market’s overall performance.
How did O’Neil identify tops?
O’Neil believed that tops occurred when uptrends barely moved on high-volume. He would call this “Heavy volume without further price progress up”.
What if the market is not currently bullish?
While some opportunities may exist in any market environment, the CANSLIM method encourages waiting for opportunities with high levels of potential. If no great opportunities exist, it is better to wait than to make a trade that may cost you money. This goes double for bear markets when the market direction is down.
O’Neil said it’s best to wait in cash when the market direction is down, but if one must go short, be extra cautious as it’s a difficult skill that few master.
CANSLIM Trading Rules
Armed with the knowledge to pick the best stocks, the next step is to understand when to buy and sell them.
O’Neil states that the secret to winning in the stock market isn’t about being right all the time but losing the least amount of money when you’re wrong.
This leads us to the most important CANSLIM trading rule:
Cut All Losses at 8%
Large institutions are not able to move in and out of stocks quickly, but retail investors can. O’Neil says that being nimble is a secret to becoming rich for retail investors.
And while the rule is to cut all losses at 8%, that’s the maximum. Ideally, the average loss should be smaller. If you’ve followed my blog, you may realize that cutting losses at 8% may be a suboptimal stop-loss strategy.
The difference is to place stop losses at technical price levels and not arbitrary percentages. More specifically, below the cup-and-handle or VCP pattern, but more on this later.
The overall idea is to take your losses quickly to take your profits slowly.
Take Your Profits Slowly
O’Neil says that most investors have this backward. Instead of cutting losses quickly, most “hold their breath” and hope for the stock to come back to breakeven to sell. There is academic evidence supporting loss aversion.
O’Neil suggested taking profits at 20% – 25%. The only exception to this rule is if the stock vaulted 20% within two-three weeks, hold it for another eight weeks before taking profits.
Average Up Not Down
After reading about Jesse Livermore, O’Neil adopted his method of pyramiding, also known as averaging up.
Averaging up is a technique where you add to your initial position in smaller and smaller increments. The idea is that if you’re right on your initial purchase at a pivot and the stock has moved up by 2%-3%, add more as your thesis was correct.
This strategy also makes sense.
If you’re buying based on a technical price structure, and it moves against you, you lose less; however, if you are proven correct, you add to the position as there should be more room to run.
Buy At Bases
Using technical analysis to identify price bases is the most discretionary and subjective component of the CANSLIM strategy.
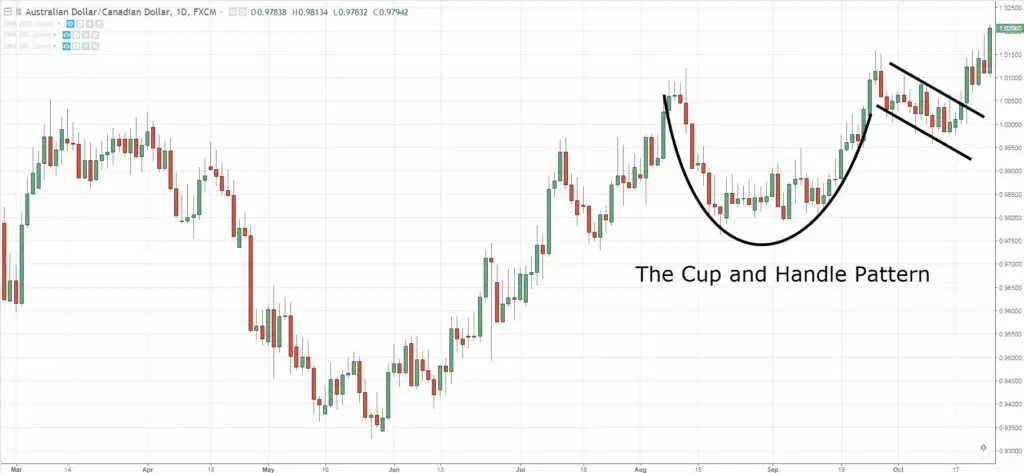
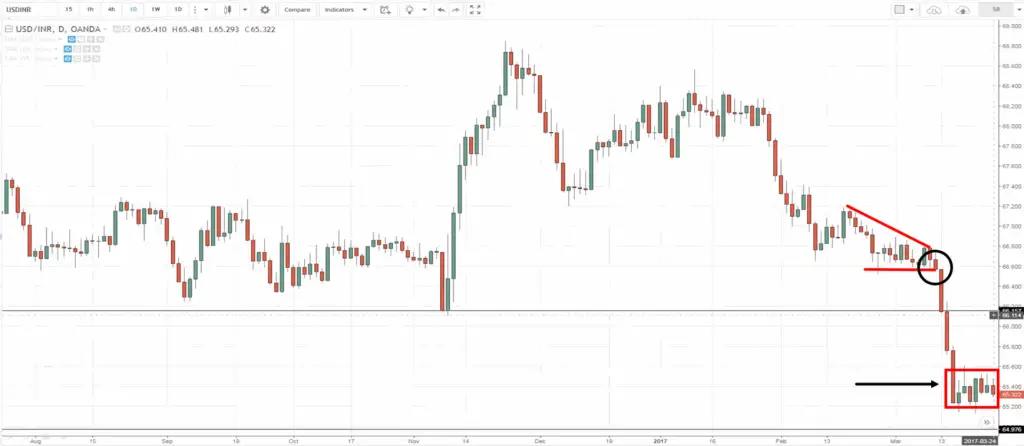
Bases are price consolidation areas often in the form of a cup-and-handle and volatility contraction chart patterns with at least seven weeks on a price chart.
Cup and Handle
Volatility Contraction
Does the CANSLIM Method Work?
As previously mentioned, each of the seven CANSLIM criteria is relatively simple and straightforward, and the trading rules are simple to implement for most traders. This may lead you to wonder, can something so simple truly help traders pick outperforming stocks?
Put another way, does the CANSLIM method work?
Historically, CANSLIM creates a portfolio that outperforms the market. CANSLIM, however, has underperformed the market in recent years.
Now, the details. The first “study” of the CANSLIM method in action is arguably O’Neil himself. We can point to his successful trading career to indicate that the system works, but one person’s success is not always guaranteed. Furthermore, O’Neil began his career in the 1950s. Over the last 70 years, the markets have evolved. Even if a strategy was effective 60 or 70 years ago, that is not a guarantee that it’ll prove useful in current markets.
Thankfully, we don’t need to rely exclusively on O’Neil’s trading record. We also have numerous studies that have aimed to test the effectiveness of the CANSLIM strategy, many of which were conducted within the last decade.
We’ll specifically look at two cases, one published in 2013 and one published in 2014.
CANSLIM Broad Market Study
The first case we’ll look at is described in the paper, Outperforming the Broad Market: An Application of Can Slim Strategy. It describes the results when investing using a simplified form of the CANSLIM strategy.
The portfolio’s total returns beat that of a buy-and-hold investor.
CANSLIM Broad Market Study II
The second study we’ll look at is described in the paper, OPBM II: An Interpretation of the CAN SLIM Investment Strategy. This study also used a simplified version of the CANSLIM strategy and also saw strong returns that outperformed the market. Specifically, the CANSLIM strategy outperformed the NASDAQ 100 Index by an average of .94% per month between 2010 and 2013.
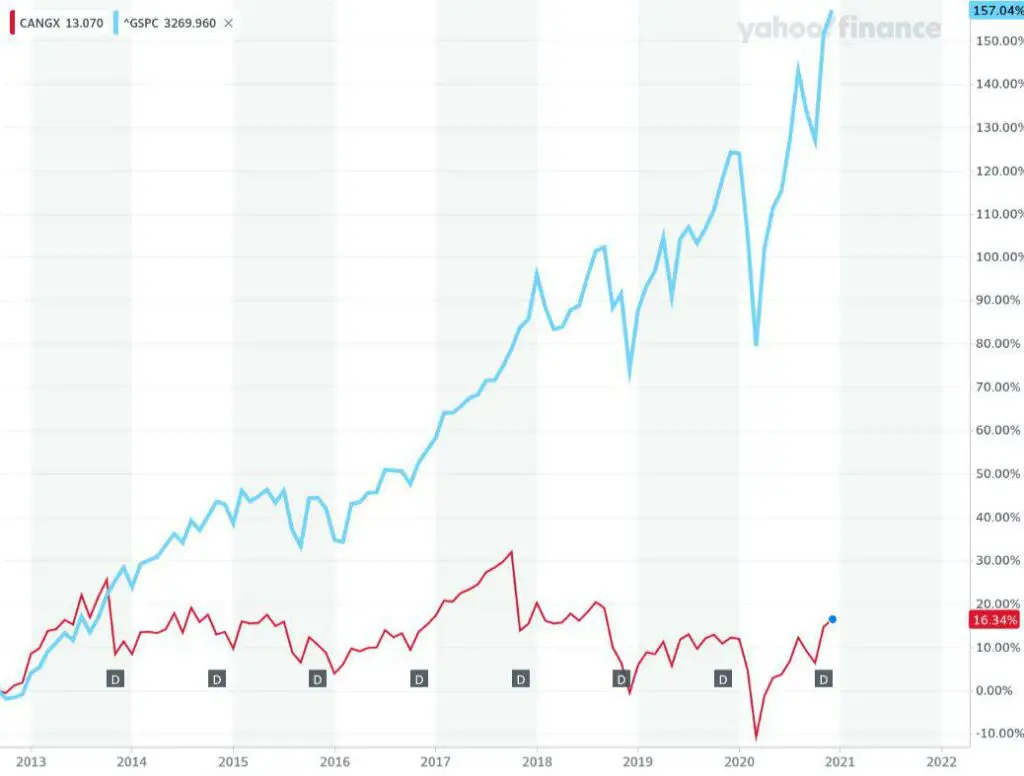
CANSLIM ETF Performance
But recent history shows that the CANSLIM, as CANSLIM Tactical Growth Fund (CANGX), has underperformed the S&P 500 drastically.
And while the recent performance of CANGX has been lackluster, others who implement it using smaller caps have had great success — even winning investing tournaments.
CANSLIM Stock Sources & Screeners
After learning about the CANSLIM method and seeing its historical success, you may be wondering how you can begin adding CANSLIM stocks to your portfolio. If you’re interested in finding stocks that meet all the CANSLIM criteria, you have a few options.
The first option is to compile a list of stocks and manually go through each and check it against each of the seven CANSLIM criteria. As you can probably imagine, this would be a relatively complicated and time-intensive endeavor. While each of the CANSLIM requirements is relatively straightforward, the process of applying each one to stocks one by one becomes labor-intensive.
The good news is that there’s no need to apply CANSLIM criteria one stock at a time manually.
You can avoid the effort of manually applying CANSLIM criteria by using a stock screener but be careful not to confuse relative strength, an annual rate of change calculation, with the relative strength index.
The following two screeners appear to have everything you need to screen for CANSLIM stocks:
While a stock screener is a far easier way to find CANSLIM stocks, there’s also an even quicker way – using the fund holdings list of CANSLIM funds.
Both the IBD 50 ETF and the CANSLIM Tactical Growth Fund contain a portfolio of stocks that have met all of the CANSLIM requirements.
Additionally, these funds have portfolio managers who oversee the fund and take into account additional aspects of the CANSLIM trading strategy and consider the holdings within the context of the larger market.
Finally, if none of those options work for you, you can go right to the source. Investor’s Business Daily provides a can-slim select service providing you with a list of CANSLIM stocks to choose from.
Disadvantages of CANSLIM
As with any trading strategy, the CANSLIM method has its limitations. If you’re planning to use the system, it’s essential to understand these limitations to ensure you’re using the strategy as effectively as possible.
One limitation appears to be CANSLIM’s performance in international or emerging markets.
Lackluster Emerging Market Performance
For example, one study tested the CANSLIM method in Indonesian markets and found that the CANSLIM stocks did not outperform the market on a daily, weekly, or monthly basis.
Subjective Chart Analysis
Additionally, the interpretation of chart patterns using the CANSLIM method can be subjective. Chart patterns, in general, are often more of an art than a science. And stock screeners, though helpful, are not always fully effective.
While these limitations are all essential to keep in mind, they do not diminish the CANSLIM strategy’s potential. Every system has its limits, and one of the best ways to keep the limitations from negatively impacting your portfolio is to become as familiar with the strategy as possible.
O’Neils CANSLIM Rules to Remember
- Avoid junk below $10. Don’t buy cheap stocks. The best stocks are from the NYSE and Nasdaq emerging from strong bases.
- Buy growth stocks where sales and earnings per share are up 25% for the last three years.
- Sales and earnings per share over the last two to three quarters should be up significantly.
- Buy stocks with a return of equity of 17% or higher. 5. Make sure the recent quarterly after-tax profit margins are improving.
- Stocks should be in the top 10% of Investor’s Business Daily’s “197 Industry Sub-Group Rankings”.
- Buy a stock because of its superiority, not because of its dividend or P/E.
- Buy stocks with Relative Price Strength of 85 or higher in “Investor’s Business Daily’s SmartSelect ratings” in bull markets.
- Stocks should trade an average daily volume of several hundred thousand shares or more.
- Learn to read daily and weekly charts and buy from bases.
- Average up, not down — and cut all losses at 8%.
- Write down your sell rules before you buy.
- Ensure that one or two great performing mutual funds have purchased the stock in the last reporting period.
- The company should have something new as a catalyst.
- The general market should be in an uptrend.
- Don’t be a Jack of all trades. Stick to U.S. stocks.
- Look for entrepreneurial companies where management owns stock.
- Read “Investor’s Corner” and “The Big Picture” on Investor’s Business Daily.
- Watch for companies that announce they are buying back 5% – 10% of their stock.
- Don’t try to buy a stock on the way down.