Ever felt lost tracking your trades? You’re not alone. Every trader, at some point, struggles with organizing their trading activities. Over the years, I’ve seen many traders face this challenge. The common missing element? A structured way to reflect and learn.
One effective solution is a trading journal. By integrating this tool into my trading routine, I noticed a marked clarity in my strategies and an uptick in performance. Dr. Brett Steenbarger, a renowned trading psychologist, conducted a study revealing that keeping a trading journal can significantly improve your learning curve and enhance self-awareness.
Intrigued?
Dive deeper to discover how to craft the ideal trading journal from scratch. Alternatively, if you prefer a ready-made solution, browse our curated list of top trading journal software or download the journal we create in this blog post.
Creating a Trading Journal Using a Spreadsheet

There are multiple types of trading journals based on their format, medium, features, and functionalities. However, for the sake of simplicity, in this article, we will explore how to create a spreadsheet-based trading journal.
Once you have gained experience in creating a trading journal from scratch using a spreadsheet, you will be in a better position to discern which specific types of trading journals align with your needs.
Step 1: Choose Your Spreadsheet Platform
First things first, decide on the platform for your trading journal template. Google Sheets and Microsoft Excel are both great options with user-friendly interfaces.
*Tip:* If you want access to your journal from anywhere, anytime, opt for Google Sheets or Office 365, which save automatically and can be accessed across multiple devices.
Step 2: Set Up Your Basic Structure
Now that we’ve selected our trading platform, it’s time to establish the foundational structure for your trading journal. In a trading journal, you can include any data that you find relevant to your trades. However, if you’re new to trading, I recommend including the following key entries. These entries encapsulate the most vital aspects of your trades:
- Status: The current status of the trade.
- Symbol: The ticker symbol or identifier for the asset being traded.
- Shares: Number of shares or contracts at entry.
- Setup: The trading setup or pattern leading to the trade.
- Long/Short: Specify if the trade was a long (buy) or short (sell).
- Entry Date: The date you entered the trade.
- Entry Price: The average price at which you entered the trade.
- Stop Loss: The price point at which you’ll exit to limit losses.
- Exit Price: The average price at which you exited the trade
- Followed Plan?: A Yes/No field indicating whether the trade adhered to the pre-defined trading plan or strategy.
- Trade Review: Reflections on what went well, what could have been done better, and lessons learned from the trade.
Below is an illustrative example of entries within your trading journal.
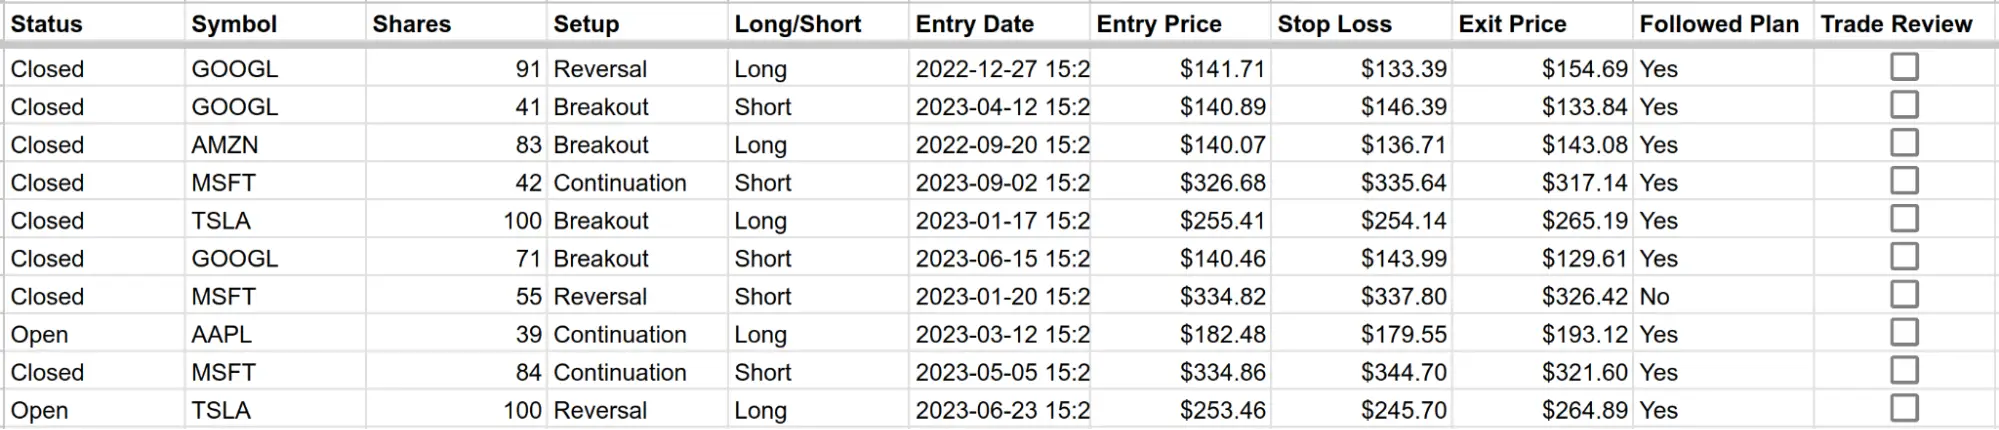
Using this structured format, you can systematically document and analyze your trades, helping you make informed decisions and improve your trading skills over time.
Step 3: Add Custom Fields
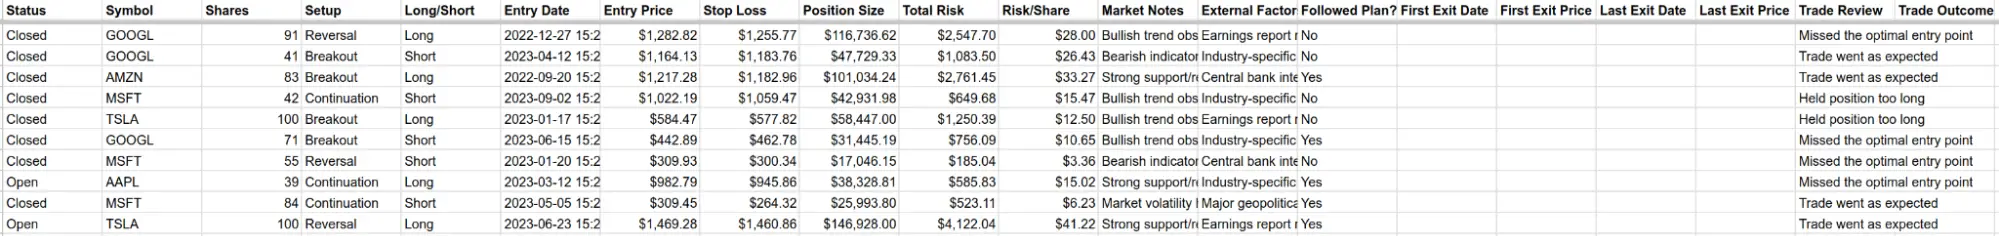
After establishing your trading journal’s fundamental framework, you can enrich it with additional entries tailored to your experience and needs. For instance, consider incorporating the following entries to provide a more comprehensive view of your trades:
- Entry Note: A brief description or observation at the time of entry.
- Reason for Trade: Contextual information on why the trade was initiated (e.g., technical indicators, news events).
- First Exit Date: The date of your first exit from the trade.
- First Exit Price: The price at which you made your first exit.
- # Shares Exited (First Exit): Number of shares or contracts exited during the first exit.
- Last Exit Date: The date of your final exit from the trade.
- Last Exit Price: The price at which you made your last exit.
- Average Exit Price: The average price at which you exited across all exits.
- Total Risk: The total risk for the trade.
- Risk/Share: The risk per share or contract.
- P/L $: Profit or loss in terms of currency.
- P/L %: Profit or loss in percentage.
- Position Size: The size of the position taken.
- Final Notes: Concluding observations or insights about the trade.
- Trade Outcome: The final result of the trade (e.g., profit, loss, break-even).
- Adjustments: Modifications made to the trade, if any, and the reasons behind them.
- External Factors: Major events or news that might have influenced the trade.
These additional details provide valuable insights into your decision-making process and outcomes.
Below is a screenshot of your trading journal, now updated with a few of the abovementioned entries.
Remember, throughout this process, simplicity is key. A clean and straightforward layout will help keep everything organized while providing clear visibility into your trades’ performance over time—no jargon, no complexity.
So, you’ve got your trading journal all set up and ready to go. But how can you leverage this tool to improve your performance? Let’s see that in the next section.
How to Use a Spreadsheet Trading Journal Effectively
I’ve authored a comprehensive article on using trading journals, offering in-depth guidance on how to use trading journals effectively. This section will show you how to get the most out of your spreadsheet-based trading journals.
Using User-defined and Built-in Functions
While spreadsheet trading journals fall under manual trading journals, they offer the advantage of automating various metrics calculations through built-in and user-defined spreadsheet functions.
I strongly advise embracing automation whenever feasible in your spreadsheet trading journals. This approach significantly reduces the time required and mitigates the risk of human error, which could otherwise result in inaccurate entries.
For instance, in your spreadsheet trading journal, you can automatically populate the values in the Position Size column using the following formula:
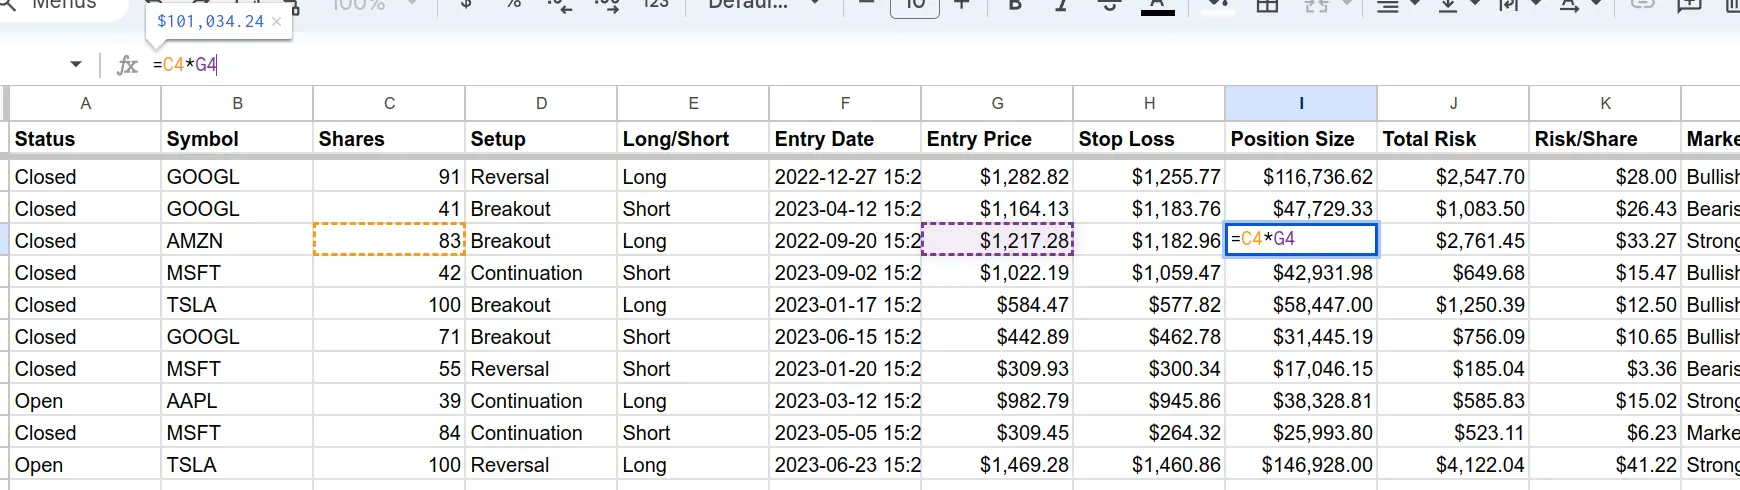
The formula multiplies the number of Shares by the Entry Price.
Similarly, you can automatically populate the values in the Risk/Share column using the following formula:
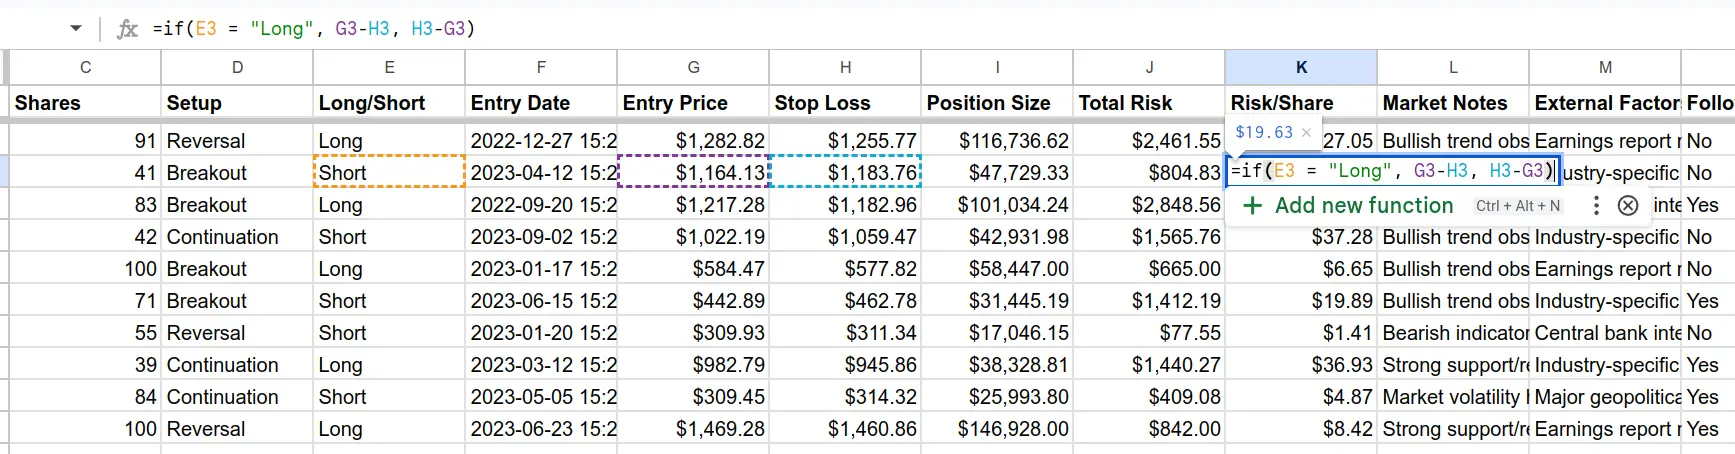
Basic spreadsheet skills help automate various calculations in your trading journal.
Using Charts and Graphs
A picture is worth a thousand words—or numbers, in our case! Using charts and graphs makes data easier to digest and helps identify patterns or trends that might be invisible otherwise. For instance, do you tend to perform better with high conviction? Or maybe there’s a specific time frame where most losses occur? Visual tools will help answer these questions.
Let’s illustrate this with an example. In the trading journal created earlier, it’s evident that whenever you had a high conviction about a trade, you achieved a profit in all five instances. However, manually tallying these occurrences can be a challenging task. Here’s where charts become invaluable.
For instance, you can streamline this process within Google Sheets using pivot tables and charts. This allows you to graphically represent the count of successful and unsuccessful trades within different conviction categories (high, low, moderate), as the following figure demonstrates.
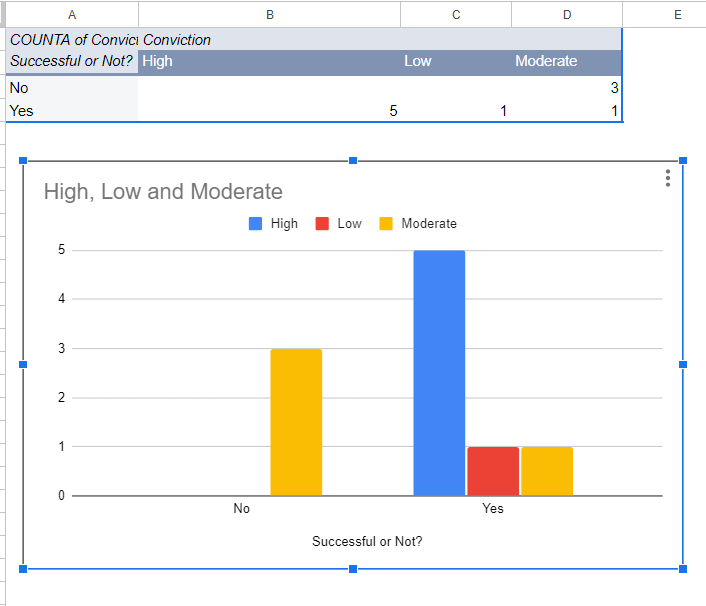
The figure clearly illustrates a 100% success rate when there is a high conviction about a specific trade. However, it’s important to note that you will rarely encounter such a scenario in actual trading.
Step-by-Step Guide on Creating a Pivot Table in Google Sheets
- Open Your Google Sheet: Open the Google Sheets document that contains the data you want to analyze.
- Select Your Data: Click and drag to highlight the cells you want to include in your pivot table. If you want to include all data in the sheet, you can simply click on any cell within the range of data.
- Access the Pivot Table Option: With the data selected, go to Data in the menu at the top and then select Pivot table from the dropdown menu.
- Choose Where to Place the Pivot Table: A dialog box will pop up asking where you want to place the pivot table. You can either place it in a new sheet or in the existing sheet. Usually, placing it in a new sheet is preferred so that it doesn’t interfere with your raw data.
- Configure the Pivot Table: Once you’ve selected the location for your pivot table, Google Sheets will create a blank pivot table and show a Pivot table editor on the right side.
- Rows: Click on ADD next to Rows to choose the data you want to analyze by rows.
- Columns: Click on ADD next to Columns to choose the data you want to analyze by columns.
- Values: Click on ADD next to Values to choose the value you want to see inside the table. You can also select the type of calculation (e.g., SUM, COUNTA, AVERAGE).
- Filters: Click on ADD next to Filters if you want to filter out specific data.
- Format and Analyze: Once you’ve set up your pivot table, you can format it as desired. You can also further refine your rows, columns, values, and filters using the Pivot table editor.
- Refresh Data (If Needed): If your source data changes, you might need to refresh the pivot table to see updated results. You can do this by right-clicking anywhere in the pivot table and selecting Update table.
That’s it! You’ve created a pivot table in Google Sheets. As you become more familiar with pivot tables, you’ll find they are a powerful tool for analyzing large sets of data quickly and easily.
Identifying and Fixing Your Mistakes
We all make mistakes—and traders are no exception! Your journal serves as an honest mirror reflecting both triumphs and blunders alike.
Let’s explore common pitfalls and provide guidelines on how to identify them using the columns in the spreadsheet trading journal you created in the previous section.
1. Overtrading: This is a common mistake where traders execute too many trades, often influenced by emotions rather than a well-thought-out strategy. Watch for days with unusually high entries to identify overtrading in your spreadsheet trading journal. Additionally, pay attention to frequent changes in the “Quantity” column, which can suggest impulsive trading decisions.
2. Chasing Losses: Chasing losses involves trying to recover lost money by taking more risks, often resulting in even more significant losses. To determine if you’re falling into this trap, search for instances in your trading journal where the “Profit/Loss” column consistently displays negative values. If you notice a sudden increase in the quantity of shares traded following these losses, it may indicate an attempt to recover losses through risky trades.
3. Cutting Profits Short: Traders sometimes exit winning positions prematurely out of fear that the market will reverse, missing out on potential gains. When reviewing your trading journal, pay close attention to trades where the “Profit/Loss” column shows a positive value but is followed by a swift exit. This pattern suggests a tendency to cut profits short due to apprehension.
4. Deviating from Your Plan: Refers to changing your trading strategy impulsively without proper analysis can lead to unexpected losses. For example, after thorough research and analysis, you have a solid trading plan to buy a stock at a specific support level. However, when you see the stock nearing that level, you hear news of market turbulence, prompting you to reconsider buying the stock.
In your trading journal, look for trades where you didn’t follow your plan. By identifying these mistakes in your journal, you can work towards fixing them and improving future performance.
Remember, using a trading journal effectively is not about dwelling on past failures but learning from them for better outcomes in the future!
Conclusion
In this article, you learned how to create a trading journal from scratch using a spreadsheet and how to utilize it effectively. Now, you can create your personal trading journal to enhance your performance. Always keep in mind that a trading journal serves as a tool for learning and growth. The more you employ it, the more you’ll progress as a trader.
But there’s another option worth considering. If you’re looking to enhance your trading journal experience, you might want to explore the benefits of an automated trading journal. Such a tool can streamline your process, reduce the potential for errors, and save you valuable time.