Founded in 2000, Floor & Decor Holdings is a high-growth, differentiated, multi-channel specialty retailer of hard surface flooring and related accessories.
According to their website, they offer the industry’s broadest in-stock assortment of tile, wood, laminate, and natural stone flooring along with decorative and installation accessories at everyday low prices, positioning them as the one-stop destination for their customers’ entire hard surface flooring needs. Their warehouse-format stores, which average approximately 75,000 square feet, are typically larger than any of their specialty retail flooring competitors’ stores. When their customers walk into a Floor & Decor store for the first time, they believe they are amazed by our visual presentation, our store size, our everyday low prices, and the breadth and depth of our merchandise.
Floor & Decor is a fast-growing company where its growth prospects and operating margins at maturity drive the majority of its value. To determine what Floor & Decor looks like in the future, we need to understand the industry in which it operates.
The Industry
Floor & Decor operates in the large, growing, and highly fragmented 13 billion hard surface flooring market (in manufacturers’ dollars), which is part of the larger 22 billion U.S. floor coverings market (in manufacturers’ dollars) based on Floor & Decor’s internal research as well as a 2018 research report by Catalina Research, Inc. Floor & Decor estimates that, after retail markup, the addressable hard surface flooring market for Floor & Decor is $21 billion, of which they represent approximately 8% according to their 2018 10-K.
We need to figure out where this industry is going with the above information. According to Market Research Future in their Hard Surface Flooring Market Research Report, they project the industry to grow at 5.12% through 2023. Assuming the manufacturer’s growth rate is roughly equivalent to the retailing growth rate gives us an industry growing at 5.12% through 2023. I then assume the industry growth rate slows by scaling down the growth rate by 10% each year with a terminal growth rate equaling that of the economy, using the 10-year treasury as a proxy giving us a total addressable market of 33 billion.
The Business
What’s so unique, and why is Floor & Decor growing at roughly 3x the rate of the industry in which it operates?
Floor & Decor completely changes the customer experience while acting as a low-cost provider.
Floor & Decor has two customer types:
- A retail customer (40%)
- A professional customer (60%).
Retail Customer
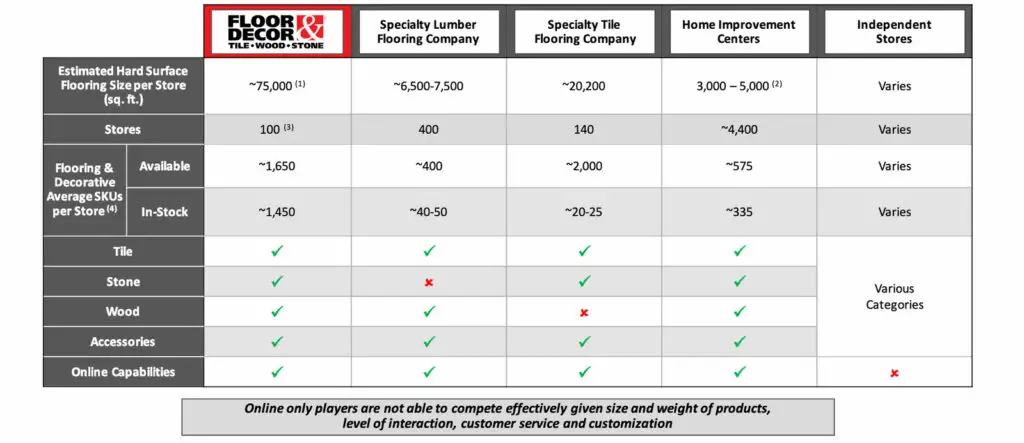
For the DIY customer, a shopper can walk in, have a designer help them free of charge, take a class on installing the materials, and walk out the same day and start working on their project. Compare that experience where dedicated flooring and decorative space are much more sparse and specialized help, let alone classes or designers, is hard to find. The following chart, taken from their investor presentation, sums it up nicely:
Professional Customer
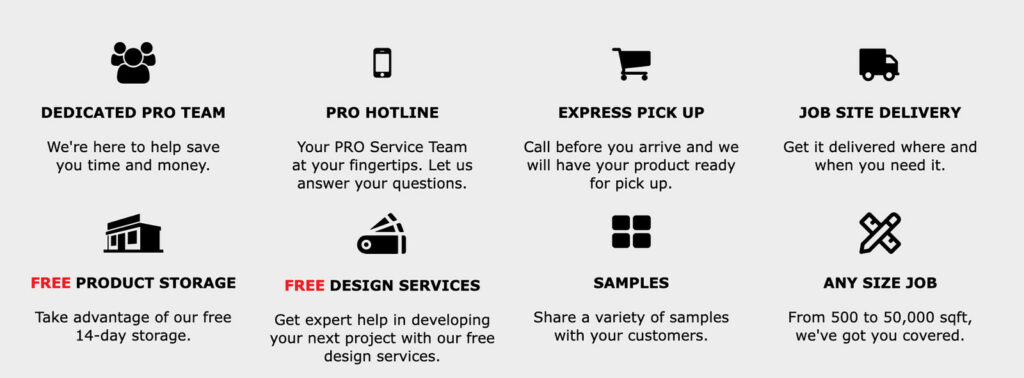
The professional customer also has a much better experience. Floor & Decor does not have installation services, unlike home improvement centers and other competitors, aligning its interests with the professional customer. Instead of being at odds with the professional, Floor & Decor empowers its professional customers with services like job site delivery, free design services, storage, website design, payroll, payment processing, and other rewards. This is vitally important as home buyers may update their flooring once every nine years, while professionals might have 2-3 jobs per week. It makes sense to empower, instead of competing against, your largest customer. See the following taken from their website.
Generally, improved customer experiences lead to higher product prices. This dynamic is not the case with Floor & Decor because they source directly instead of working through numerous other brokers and intermediaries. Their product sourcing model, which appears hard to replicate, allows them to offer a low price guarantee.
The Management
Floor & Decor’s management team is well tenured. The CEO started his career at Home Depot at age 16. He worked his way up to the executive vice president of operations, responsible for all 2200 stores. Most of the management team has been at Floor & Decor there for a considerable amount of time and have the requisite experience to continue this incredible growth story.
The Value
Let’s start with growth and then estimate margins.
Growth
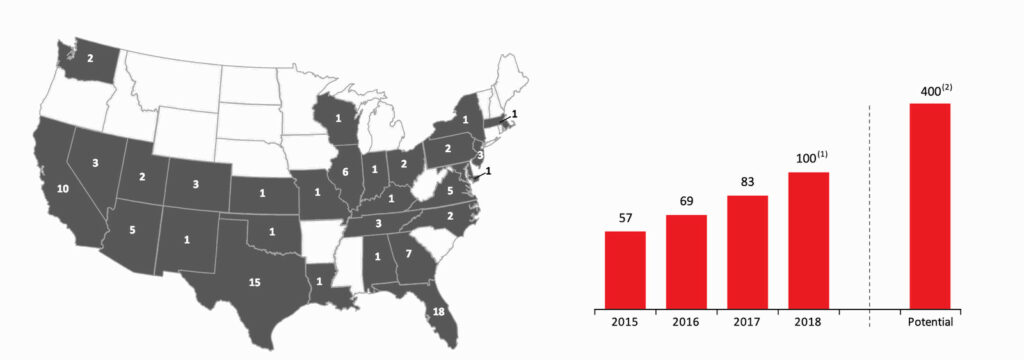
Floor & Decor’s incredible growth story results from a better, more aligned customer experience. Floor & Decor had 100 stores as of December 2018, 20 more than they had in 2017. They are targeting 400 stores in the U.S., up from the 350 stores they projected in their 2014 S-1 filing. This does not consider international growth. Additionally, management has wisely has decentralized much of the store operations allowing each to capture local trends. Decentralization also improves the ability of the company to grow at larger sizes due to centralized planning and corporate capacity constraints.
I’ve projected Floor & Decor to get to 390 stores at the end of year ten. I’ve done this by reducing their store count growth rate by 10% each year.
| Year | Growth Rate | New Stores | Total Stores |
|---|---|---|---|
| 2019 | 23% | 23 | 123 |
| 2020 | 20% | 25 | 147 |
| 2021 | 18% | 27 | 174 |
| 2022 | 16% | 29 | 203 |
| 2023 | 15% | 30 | 233 |
| 2024 | 13% | 31 | 264 |
| 2025 | 12% | 32 | 295 |
| 2026 | 11% | 32 | 327 |
| 2027 | 10% | 32 | 358 |
| 2028 | 9% | 31 | 390 |
Why not 400 stores? Management guided 400 stores, again up from 350, after 10-15 years. And while there doesn’t seem to be an issue adding new stores from a capacity perspective, I would rather err on the side of caution. Three hundred ninety stores puts Floor & Decor as the market share leader, with about 30% of the hard surfacing flooring market at maturity. This market share positions Floor & Decor as the Home Depot of the hard surface flooring industry even though the Lowe’s equivalent hasn’t shown up yet.
Now that we have an estimated store count, we can project the revenue. In understanding Floor & Decor’s revenue potential, the key is that half of their stores are less than five years old. This fact makes the company look a lot less profitable than its potential. The current revenue per square foot is 227.98. The revenue per square foot of the top 20% of stores, their most mature stores, is 341.97. This puts Floor & Decor’s revenue per square foot in line with Lowe’s, according to Statista.
| Stores | 100 |
|---|---|
| Total Revenue | $1.7B |
| Sq Ft. per Store | 75K |
| Rev per Sq Ft (Current) | $227.98 |
| Rev per Sq Ft (Mature) | $341.97 |
| Revenue @ 390 stores | $ 9.9B |
In case you’re curious, from a sensitivity standpoint, while increasing the store count to 400 does increase the value per share by roughly $3.00 in my model, the profit margin is a more significant factor.
Operating Margins
Understanding the revenue per square foot also allows us to derive the profit margins. Keeping gross margins the same and scaling up store costs as a percentage of revenue gives me a margin of 13.68%. I’ve also assumed the three stores relocate per year in maturity, which is the pre-opening expense is still there.
| 2018 Actual | 2018 Maturity | |
|---|---|---|
| Net sales | $1,709,848 | $2,564,772 |
| Cost of sales | 1,007,580 | 1,511,370 |
| Gross profit | 702,268 | 1,053,402 |
| Operating expenses: | ||
| Selling and store operating | 439,495 | 593,318 |
| General and administrative | 105,327 | 105,327 |
| Pre-opening | 26,145 | 3,922 |
| Total operating expenses | 570,967 | 702,567 |
| Operating income | 131,301 | 350,835 |
| Operating income margin | 7.68% | 13.68% |
This estimated operating margin is in-line with what Trevor Lang, the CFO of Floor & Decor, projects for margins at maturity in the Bank of America Merrill Lynch 2019 Consumer & Retail Technology Conference, stating he expects Floor & Decor to reach low to mid-double-digit operating margins. Because operating margin has a massive impact on the company value, I will project 12.5% margins at maturity, splitting the difference between low and mid-teens operating margins.
Reinvestment
Just like an investor, growth isn’t free. Businesses have to invest today to grow tomorrow. With this in mind, and now that we’ve estimated revenues and profits, we need to determine how much Floor & Decor will need to reinvest back into the business to generate that growth we’ve projected, ensuring the mathematical relationship between growth, ROIC, and invested capital stays intact.
I will use the sales to capital ratio to determine Floor & Decor’s capital needs as it’s a fast-growing company. Hard surface flooring fits into the building materials sector, which has a sales/capital ratio of 2.49, but since Floor & Decor is retail-facing, I would expect their margins to be higher and their sales/cap to be lower. Floor & Decor’s sales/capital ratio in the most recent year is 2.35. This would mean they generate 2.35 for every 1.00 of investment. The relationship and assumption hold. I will reduce Floor & Decor’s sales/cap ratio to 2.0 as the global, non-U.S. building materials sales/capital ratio is 1.68. 2.0 “feels” better to me.
Yes, investing is part storytelling and part science.
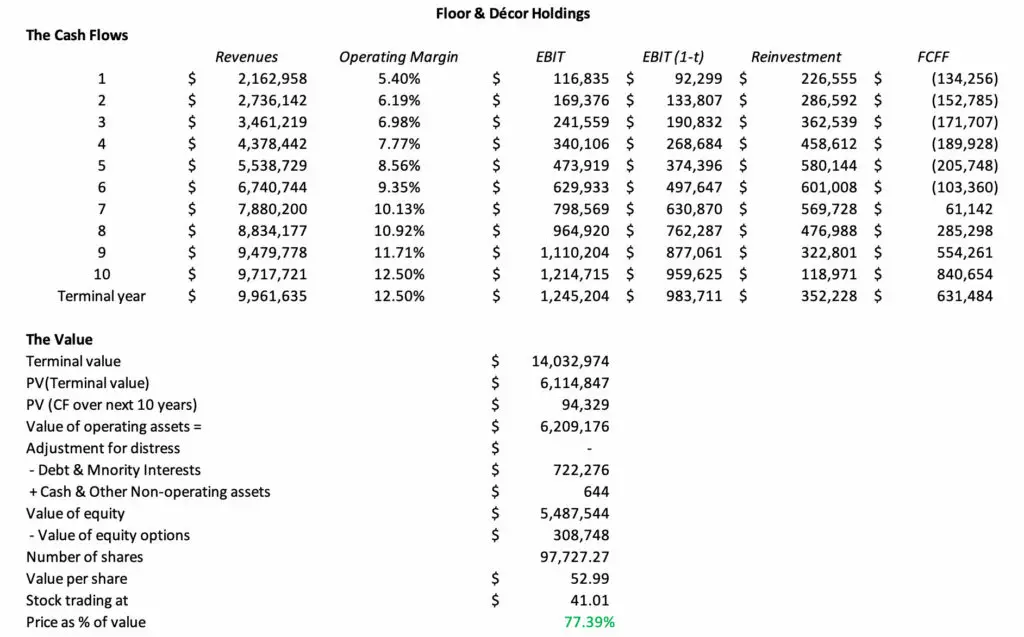
Now that we have revenues, profit margins, and reinvestment, we can get to the value for Floor & Decor. Discounting Floor & Decor’s free cash flows at 9.37% and scaling the cost of capital as the firm becomes more mature and less risky to 7% in perpetuity, and assuming no excess return considering competitive advantages are competed away gives us a value of $52.99 per share, which is 77.39%.
Full disclosure: I purchased Floor & Decor on 3/22/2019 at $40.07 share.