Explore the wide world of Nasdaq Data Link, your key to tons of free and paid data. This easy-to-understand guide shows you how to use its website and Python API to get the data you need.
I use Nasdaq Datalink’s Sharadar and other data sets. If you’re looking for what I think about this data provider, check out my full Nasdaq Data Link Review.
What Is Quandl / Nasdaq Data Link?
Nasdaq Data Link, previously known as Quandl, is a premier financial, economic, and alternative data marketplace.
Users can download free datasets, pay for premium data sets, and even get paid for providing data sets to Nasdaq Data Link users.
As a retail algorithmic trader, I use Quandl as one of my data providers, and I’m pretty happy with them. You might also notice I said one of my data providers, as while Quandl is a fantastic source, it’s not the be-all-end-all. Let’s cover the pros and cons of Quandl.
Pros of Quandl
- Massive amounts of data – Nasdaq Data Link brings together millions of financial and economic indicators from over 250 sources.
- Unified API – Most datasets on Nasdaq Data Link are available via a standardized API, irrespective of who originally published the data and its format.
- High quality – The data is well-vetted, with 650,000 users and 12 of the top 15 most significant hedge funds using the platform.
Cons of Quandl
- Quandl Pricing – Nasdaq Data Link is often more expensive than alternatives.
- No Master Asset List – You’ll need to create your master database to associate like assets from different data sets.
- Limited API – For some large datasets, API calls are limited, and the data must be exported.
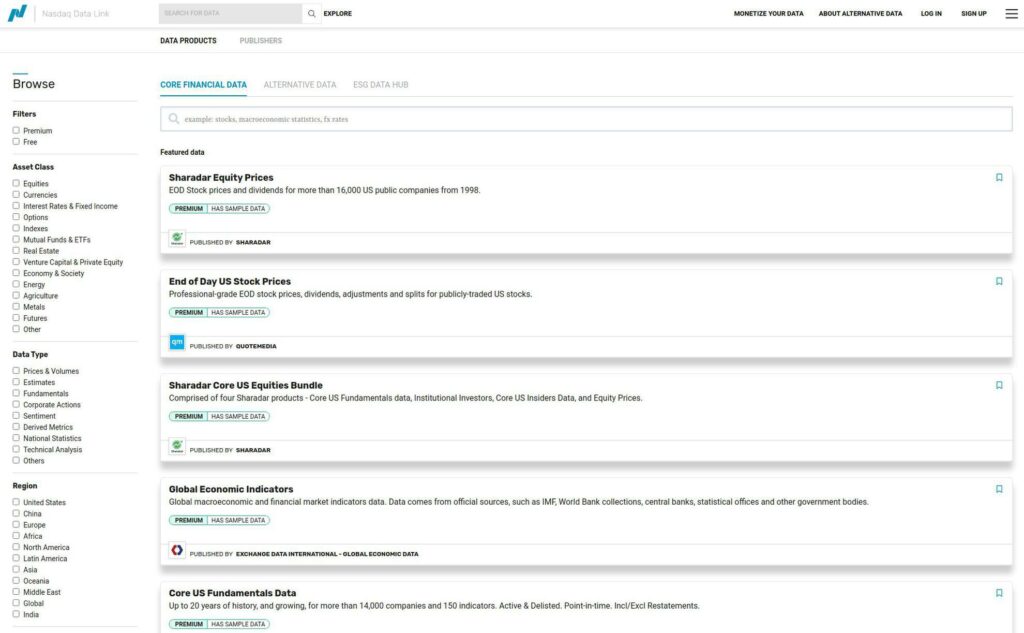
How to Browse Available Datasets
Before we dig into the code, let’s understand the vast amount of data residing on the Nasdaq Data Link. You can search for financial, economic, and alternative datasets using the Nasdaq Data Link Search.
With a dataset or two in mind, let’s log into Nasdaq Data Link and create a free account.
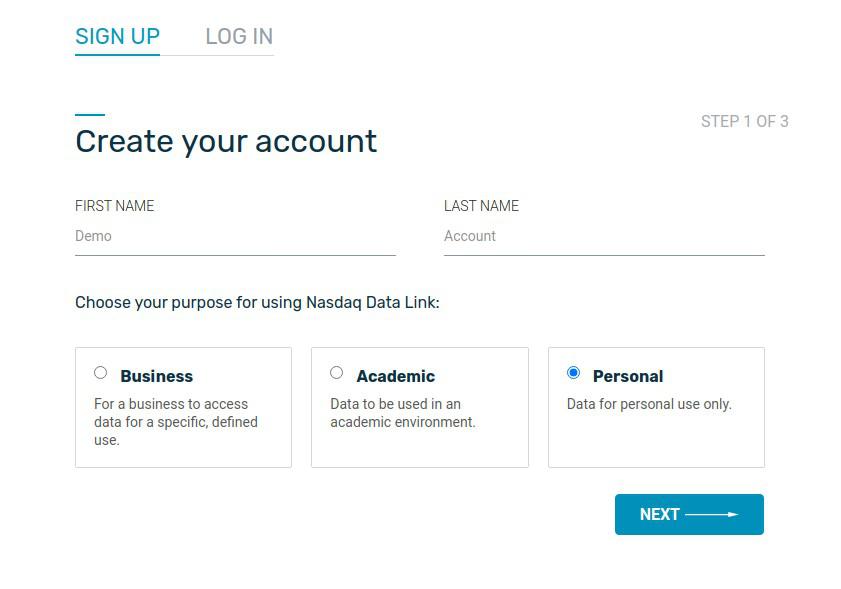
How to Create a Quandl Account
You need to create a Nasdaq Data Link account to obtain a free API key. You can do this at the Nasdaq Data Link sign-up page. Here are the steps:
You can always find your API key in your account settings, also.
Understanding the Quandl API
With your free API key in hand, we can start using Quandl. While we’ll cover most of what you need, please review the Nasdaq Data Link API Documentation if you run into questions at any point.
There are four ways to access the data using the API and various packages:
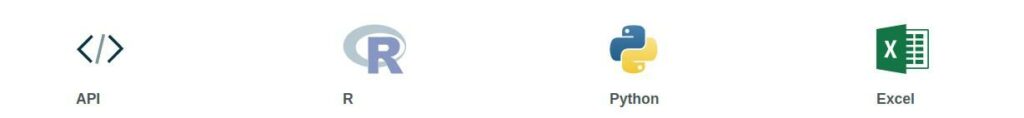
I will cover connecting to the API directly and using the Python API. Sorry, Microsoft users — after learning Pandas, using Excel feels underwhelming.
Access the Nasdaq Data Link API Directly
It’s rare to access the Nasdaq Data Link API directly, but it’s simple to do.
All you need to do is make a GET request in the following format:
GET https://data.nasdaq.com/api/v3/datasets/{database_code}/{dataset_code}/data.{return_format}?api_key=your_api_keySo to get Facebook’s price data in JSON format, you would send the following GET request using Insomnia, Curl, or put it in your browser window using the following URL structure:
https://data.nasdaq.com/api/v3/datasets/WIKI/FB/data.json?api_key=YOURAPIKEY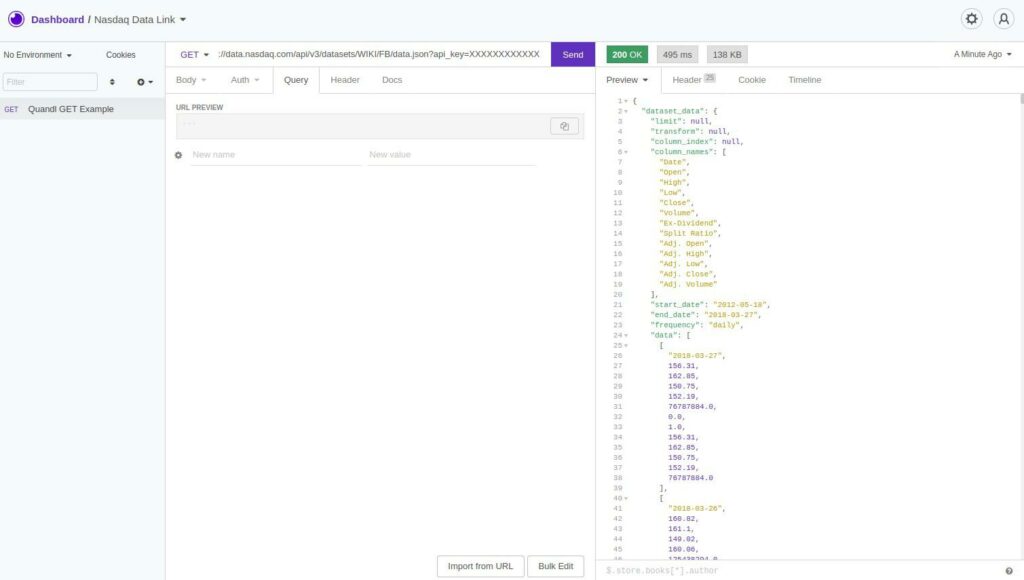
How to Use the Nasdaq Data Link Quandl Python API
Installation & Authentication
Installing the Quandl Python API package is simple. You can install it from GitHub or PyPy by running it with your virtual environment activated:
!pip install quandlAuthenticating is just as easy. Import quandl and set its api_key attribute to your API key.
import quandl
quandl.ApiConfig.api_key = ‘YOUR_API_KEY_HERE’
Now that we’ve performed the authentication let’s grab some data!
Getting Data
Quandl returns data as either a time series or a dataframe. This is fitting because using Pandas is my favorite tool for data analysis. Let’s go through a few examples.
We’ll start the quandl.get method, which returns a time series.
Quarterly GDP Data
Below we grab the FRED/GDP data.
data = quandl.get("FRED/GDP", start_date="2011-01-01", end_date="2021-12-31")data.head(10)
Value
Date
2011-01-01 15351.444
2011-04-01 15557.535
2011-07-01 15647.681
2011-10-01 15842.267
2012-01-01 16068.824
2012-04-01 16207.130
2012-07-01 16319.540
2012-10-01 16420.386
2013-01-01 16629.050
2013-04-01 16699.551
...Instead of returning a dataframe, we can produce a ndarray or a recarry more specifically.
data = quandl.get("FRED/GDP", start_date="2011-01-01", end_date="2021-12-31", returns=’numpy’)rec.array([('2011-01-01T00:00:00.000000000', 15351.444),
('2011-04-01T00:00:00.000000000', 15557.535),
('2011-07-01T00:00:00.000000000', 15647.681),
('2011-10-01T00:00:00.000000000', 15842.267),
('2012-01-01T00:00:00.000000000', 16068.824),
('2012-04-01T00:00:00.000000000', 16207.13 ),
('2012-07-01T00:00:00.000000000', 16319.54 ),
('2012-10-01T00:00:00.000000000', 16420.386),
('2013-01-01T00:00:00.000000000', 16629.05 ),
('2013-04-01T00:00:00.000000000', 16699.551)],
dtype=[('Date', '<M8[ns]'), ('Value', '<f8')])Now let’s see a few examples of the quandl.get_table method.
Quandl WIKI Prices
The below grabs data from the ‘WIKI/PRICES’ table and uses the qopts parameter to select the desired columns, the AAPL and MSFT tickers, and applies a date filter.
Please note that due to the large volume of API calls, the free stock prices program was discontinued on April 11, 2018.
data = quandl.get_table('WIKI/PRICES',
                        qopts = { 'columns': ['ticker', 'date', 'close'] },
                        ticker = ['AAPL', 'MSFT'],
                        date = { 'gte': '2016-01-01', 'lte': '2016-12-31' })
ticker date close
None
0 MSFT 2016-12-30 62.14
1 MSFT 2016-12-29 62.90
2 MSFT 2016-12-28 62.99
3 MSFT 2016-12-27 63.28
4 MSFT 2016-12-23 63.24
... ... ... ...
499 AAPL 2016-01-08 96.96
500 AAPL 2016-01-07 96.45
501 AAPL 2016-01-06 100.70
502 AAPL 2016-01-05 102.71
503 AAPL 2016-01-04 105.35You can download an entire table with get_table:
quandl.get_table('MER/F1', paginate=True)If there are more than 1,000,000 rows, you’ll need to use quandl.export_table, saving it as a zipped CSV file.
quandl.export_table('MER/F1', filename='/my/path/db.zip')At this point, you might say, Leo, these are great, but they are basic examples from the help documentation. You’re right. Let’s get to something more useful. Let’s build our RESTClient for Quandl using the popular paid SHARADAR database. It’s time for some python code!
Using the Paid Quandl Price Database (SHARADAR)
We’ll create a RESTClient to access the Sharadar data from Quandl/Nasdaq Data Link. This will be very similar to getting historical price data from polygon.io.
Creating our RESTClient makes our lives easier in the long run. The __init__ method initializes quandl with various settings. We’ll then create a get_tickers method and a get_bars method for our convenience.
Install Quandl Python API
If you haven’t already, activate your virtual environment and install quandl. We covered this above, but I’m keeping it here for completeness.
!pip install quandlImport Required Packages
from datetime import date
import quandl
import numpy as np
import pandas as pd
from local_settings import quandl as settings
Create MyRESTClient
class MyRESTClient():
    def __init__(self, auth_key: str=None):
        '''
        Input: dictionary with configuration parameters
        Returns: Configured quandl connection
        '''
        if not ('api_key' in settings.keys() and
            'number_of_retries' in settings.keys() and
            'max_wait_between_retries' in settings.keys() and
            'retry_backoff_factor' in settings.keys() and
            'retry_status_codes' in settings.keys()):
            raise Exception('Bad quandl config file.')

        # https://github.com/quandl/quandl-python#configuration
        quandl.ApiConfig.api_key = settings['api_key']
        quandl.ApiConfig.NUMBER_OF_RETRIES = settings['number_of_retries']
        quandl.ApiConfig.MAX_WAIT_BEWTEEN_RETRIES = settings['max_wait_between_retries']
        quandl.ApiConfig.RETRY_BACKOFF_FACTOR = settings['retry_backoff_factor']
        quandl.ApiConfig.RETRY_STATUS_CODES = settings['retry_status_codes']

        self._session = quandl
Create Get Tickers Method
def get_tickers(self) -> pd.DataFrame:

    tickers = self._session.get_table('SHARADAR/TICKERS', paginate=True)

    # Filter tickers for equities and funds. Remove instituational tables.
    tickers = tickers[(tickers['table'] == 'SEP') | \
                      (tickers['table'] == 'SFP')]


    # Set NaNs to None and strings to boolean
    tickers.replace({np.nan: None}, inplace=True)

    # Convert isdelated to active
    tickers['active'] = tickers['isdelisted'].apply(lambda x: bool(x == 'N'))

    # Rename and get only fields of interest
    tickers = tickers.rename(columns={'permaticker':'quandl_id',
                                      'siccode':'sic'})

    # Set type of quandl_id to int64
    tickers['quandl_id'] = tickers['quandl_id'].astype(int)

    # Return only columns we want
    cols = ['ticker', 'name', 'active', 'sic',
            'sector', 'industry', 'quandl_id', 'category']
    tickers = tickers[cols]

    # Prevents duplicate data sent by API provider
    tickers = tickers.drop_duplicates(subset='ticker')
    return tickers
Create Get Bars Method
      def get_bars(self, market:str='stock', ticker:str=None,
                 from_:date=None, to:date=None) -> pd.DataFrame:

        # Convert np.NaT to None
        from_ = None if pd.isnull(from_) else from_
        to = None if pd.isnull(to) else to

        # Set datea to most recent year if None
        to = to if to else date.today()
        from_ = from_ if from_ else date(2000,1,1)

        tables = ['SHARADAR/SEP', 'SHARADAR/SFP']

        for table in tables:
            df = self._session.get_table(table,
                                         ticker=ticker,
                                         date={'gte':from_,'lte':to},
                                         paginate=True)

            if not df.empty:
                df['date'] = pd.to_datetime(df['date'])
                df = df.sort_values(by='date')
                df = df[['date', 'open','high','low','close','volume']]
                return df

        return None
The Python Code
    def get_bars(self, market:str='stock', ticker:str=None,
                 from_:date=None, to:date=None) -> pd.DataFrame:

        # Convert np.NaT to None
        from_ = None if pd.isnull(from_) else from_
        to = None if pd.isnull(to) else to

        # Set datea to most recent year if None
        to = to if to else date.today()
        from_ = from_ if from_ else date(2000,1,1)

        tables = ['SHARADAR/SEP', 'SHARADAR/SFP']

        for table in tables:
            df = self._session.get_table(table,
                                         ticker=ticker,
                                         date={'gte':from_,'lte':to},
                                         paginate=True)

            if not df.empty:
                df['date'] = pd.to_datetime(df['date'])
                df = df.sort_values(by='date')
                df = df[['date', 'open','high','low','close','volume']]
                return df

        return None
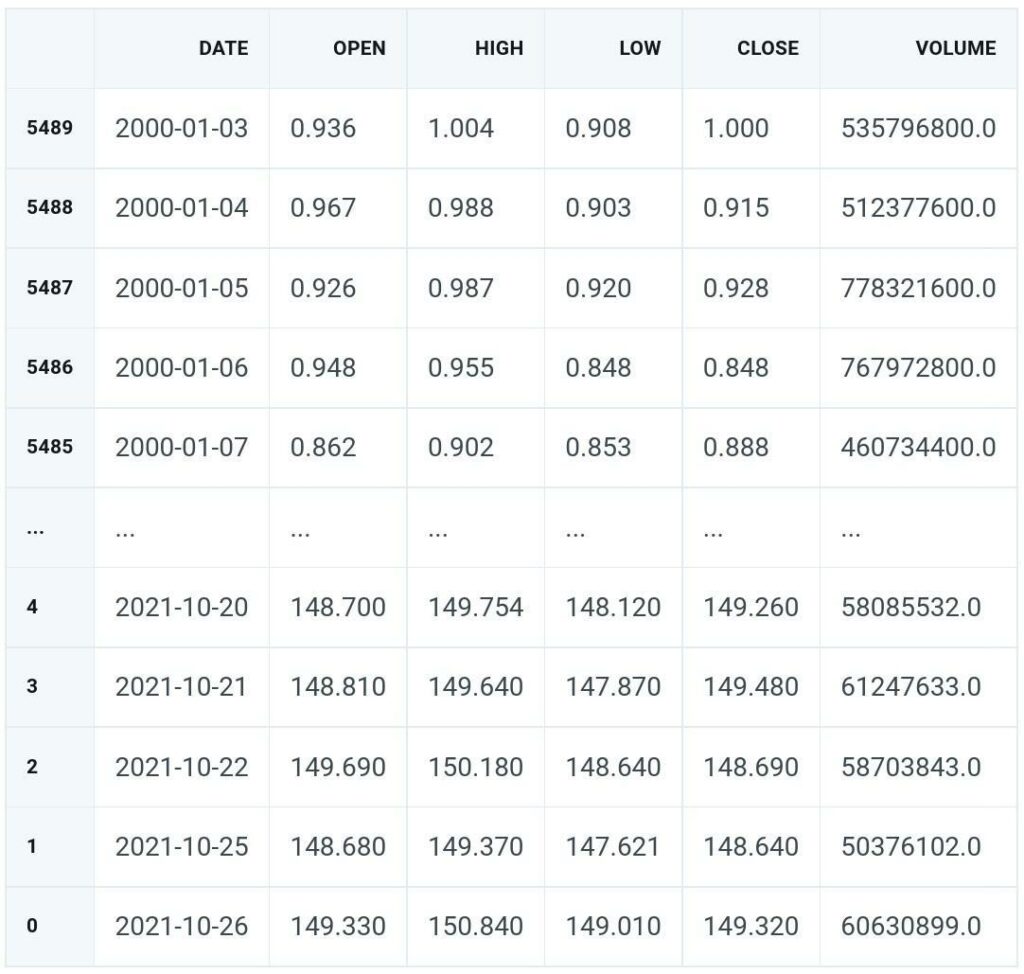
Get Apple’s Prices
client = MyRESTClient()
client.get_bars(ticker='AAPL')