In stock trading, the high and low refer to the maximum and minimum prices in a given time period. Open and close are the prices at which a stock began and ended trading in the same period. Volume is the total amount of trading activity—adjusted values factor in corporate actions such as dividends, stock splits, and new share issuance.
Valuable information can be gleaned from understanding the open, high, low, and close of a stock and its trading volume. Traders often visualize price actions through bars and bar charts.
Let’s dive into what these terms mean and how they can be used to fine-tune our trading strategy.
Time Matters
It’s essential to understand the period when discussing the open, high, low, close, and volume (OHLCV) of a securities price. Unless otherwise specified, the period is commonly daily; however, traders incorporate multiple periods when reviewing the price action of a security. This is called multiple timeframe analysis. For example, a stock could be in a daily uptrend with a series of higher highs and higher lows but be in a weekly downtrend with a string of lower highs and lower lows. With this out of the way, let’s dig deeper into these definitions through the lens of the most common trading period: the daily time period.
“Open” and “Close” Prices
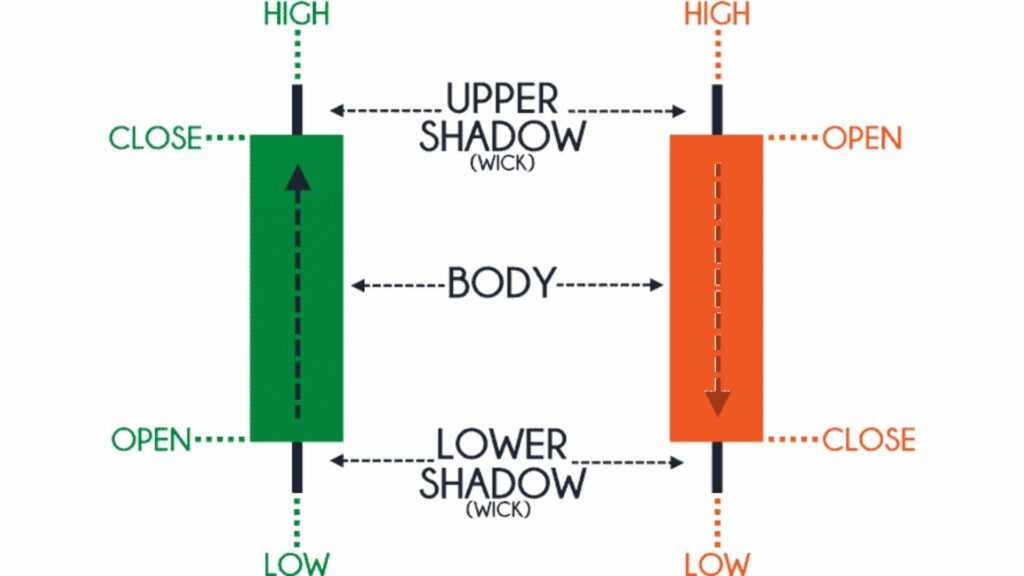
With coffee in hand, we browse through the stock market section of the morning newspaper. We locate our favorite stock but see there is more than just one price next to it. The header on one of them is “open”. Open means the price at which a stock started trading when the opening bell rang.
It can be the same as where the stock closed the night before, but not always. Sometimes events such as company earnings reports in after-hours trading can alter a stock’s price overnight. Then there is “close”.
Close refers to the price of an individual stock when the stock exchange closed shop for the day. It represents the last buy-sell order executed between two traders. This occurs in the final seconds of the trading day in many cases. For less actively traded stocks, the day’s last trade could be well before the closing bell, depending on when the last buy and sell orders were last paired.
“High” and “Low” Prices
Financial periodicals and websites often include a stock’s “high” and “low” prices. The high is the highest price at which a stock is traded during a period. The low is the lowest price of the period. A stock’s high and low points for the day are often called its intraday high and low.
It is also common to see a stock’s 52-week high and 52-week low listed. This is the highest and lowest daily close for a stock for over one year. It gives us an idea of the stock’s trading range annually. These points can be easily identified if we look at one year-prices chart because they are the peak of the mountain and the lowest point in the valley.
Why is a Stock’s Closing Price Significant?
While much fanfare surrounds the stock market’s opening bell and opening prices, a stock’s closing price determines how a share performs during the day.
The close price is considered the reference point for any time frame. It’s the price traders agreed on after all the action throughout the day. When researching historical stock price data, financial institutions, regulators, and individual investors use the closing price as the standard measure of the stock’s value as of a specific date. For example, a stock’s close on December 31, 2019, was the closing price for that day and that week, month, quarter, and year.
The difference between the stocks open and close divided by the open is the stock’s return or performance in percentage terms. If we want to take a longer-term view of a stock’s performance, such as one year, we would use the closing price from a year ago and compare it to the closing price from today to get the annual return.
Adjusting for Corporate Actions
Let’s say a company pays a quarterly dividend in cash or additional shares of stock. We can incorporate these into the share price by adding them back with an adjusted value that reflects the shareholder payments. Although dividends are a welcomed bonus for shareholders, they lower a stock’s value. By distributing dividends, a company moves cash or stock to shareholders’ pockets rather than investing the funds back into the business.
A company may also split its shares to reduce the stock price or perform a reverse split to increase it. With more shares out there, each share has a lower claim on the company than before. The opposite is also true. With fewer shares available in the case of a reverse stock split, the stock’s price will increase.
A company may also decide to issue additional shares of stock to raise capital for growth projects, debt repayment, or acquisitions. This has a similar effect to stock splits as more shares are out there. However, issuing new equity changes the company’s cost of capital. Unlike splits, these actions affect a company’s value, and the adjusted price may drop or increase depending on how investors perceive how the company will invest the new funds.
Pump Up the Volume
Volume is the total number of shares traded in a security period. Every time buyers and sellers exchange shares, the amount gets added to the period’s total volume. Studying volume patterns are an essential aspect of technical analysis because it can show the significance of a stock’s price movement.
A price change that occurs in high volume can carry more weight because it indicates that many traders were behind the move. Conversely, a lower volume price move can be perceived as less critical.
The Bottom Line
We often hear about the highs and lows of the stock market. “Buy low and sell high” is a familiar battle cry among investors, but what does it mean?
Low is the minimum price of a stock in a period, while high is the maximum value reached in the same period. These terms are most often discussed in a single trading day but could easily refer to the highs and lows of any period, including minute, hour, week, month, year, etc., or even a stock’s entire trading history.
The open and close reference the prices at which a stock begins and ends the period.
Adjusted values incorporate changes resulting from corporate actions such as dividend payments, stock splits, or new share issuance.
Volume refers to the number of shares that exchange hands for a stock within a specific period.
Closing on a ‘high’ note, all of these terms help give us a better picture of a stock’s price action at a given point in time, helping us make better trading decisions.