Post Earnings Announcement Drift (PEAD) is the tendency of a stock’s abnormal returns to move towards the direction of an earnings surprise for nearly 60 days after the earnings announcement.
PEAD is also known as the SUE effect or standardized unexpected earnings. SUE is the difference between actual and expected earnings, measured by the standard deviation of the forecast errors during the estimation period. PEAD was first introduced by the study of Ball and Brown (1968). Other researchers who have studied the phenomenon were Jones and Litzenberger (1970), Foster, Olsen, and Shevlin (1984), and Bernard and Thomas (1989).5,6,7
This article discusses the factors impacting the post-earnings announcement drift and how investors can use it for earning profits.
One of the most significant events that an investor looks forward to is the quarterly earnings announcement of a company. Earnings and revenue are the two primary benchmarks that help the market gauge their financial health and ascertain if they are on their path to progress.
Typically, these earnings announcement events are no less than a bag of surprises. Before the earnings release, the investors set an expectation while the company prepares its forward-looking statement (guidance). At the same time, wall street analysts set their projections based on their analysis.
When the company reports earnings that are different from the analyst estimates, it’s called an Earnings surprise. A positive surprise mostly leads to a sharp rise in the company’s stock price, while a negative surprise leads to a rapid downslide.
This tendency of a stock’s cumulative abnormal returns to drift towards earnings surprise is known as Post Earnings Announcement Drift or PEAD. One of the most widely accepted explanations of PEAD is the investor’s underreaction to the earnings announcement.
This article takes a deep look at the PEAD strategy, its evolution, and how investors can take advantage of the post-earnings drift while portfolio building.
What is Post Earnings Announcement Drift?
Based on how the market receives a company’s earnings report, there could be large price swings, thus impacting large price swings. It is widespread for a stock price to witness a sharp rise or decline immediately after an earnings report. The tendency for a stock to shift by massive magnitude in a specific direction after an earnings report creates active trading opportunities is known as Post Earnings Announcement Drift.
Understanding Standardized Unexpected Earnings (SUE)
Post Earnings announcement drift is also known as the SUE effect or standardized unexpected earnings.1 SUE is the difference between actual and expected earnings, measured by the standard deviation of the forecast errors during the estimation period. The estimation period is the time taken by the analyst to forecast the expected earnings. It can also be a time series model of earnings that helps to derive it.
According to researchers, there are three general explanations for the SUE effect.2 Some believe the drift is due to methodological shortcomings of the studies, and some believe that the drift represents systematic misestimation of expected returns following earnings surprises.
However, SUE has certain downsides. Although it captures the earnings surprises, it fails to capture the new information released around earnings announcement dates. SUE also doesn’t capture the way the market reacts to the data.
In a research paper, Victor L. Bernard and Jacob K. Thomas developed earnings surprise elasticity (ESE) as a new measure to capture both earnings surprises and stock market reactions to all the available information disclosed around earnings announcement dates.3 They defined it as the absolute value of earnings announcement abnormal returns (EARs) in terms of earnings surprises (in percentage).
The stock return is the percentage change in stock price if there are no corporate actions. This ratio is an elasticity measure: the percentage change in stock prices due to a percent change in earnings surprises.
Historical Evolution of the PEAD Phenomenon
Price formation to firm earnings news has been an area of research and analysis since the study of Ball and Brown (1968), which is commonly associated with Post Earnings Announcement Drift.4 This anomaly has been studied in detail in other research papers too, which include Jones and Litzenberger (1970), Foster, Olsen, and Shevlin (1984), and Bernard and Thomas (1989).56
According to Bernard & Thomas (1989), Post Earnings Announcement Drift patterns include two components. The first is a positive autocorrelation between the difference between the actual returns and forecasted returns. Second, there is a negative autocorrelation between seasonal differences that are four quarters apart.
The efficient market hypothesis (EMH) is that stocks reflect all available information. Based on “information,” efficiency has three forms–the weak, strong, and semi-strong.
In the semi-strong form of market efficiency, all the publicly available information regarding the firms must be reflected already in the stock price.
An earnings announcement is a piece of publicly available information, and the semi-strong form of market efficiency implies that the stock prices should immediately reflect this data. Any delay in such reflection or the ability to predict the stock price movement is an anomaly against a semi-strong form of efficiency. The post-earnings-announcement-drift, therefore, is termed an anomaly because its presence signifies market inefficiency.
If the surprise element in the earnings announcement is positive, the stock prices move positively and vice versa. This means that the direction of the price drift can be predicted based on the magnitude of an earnings surprise.
The abnormal security returns of the firms reporting positive news in quarterly earnings tend to drift upwards for at least 60 days after their earnings announcement. In the same way, firms reporting bad earnings news tend to see their abnormal security returns shift downwards for a similar period. This occurrence is known as post-announcement drift, initially proposed by Ray J. Ball & P. Brown’s, ‘An empirical evaluation of accounting income numbers, Journal of Accounting Research, Autumn.2
Why Do Stocks Fall Even after a Positive Earnings Surprise?
The market often sees strange behavior of stock prices. It has witnessed stock prices falling several times despite a positive earnings surprise. The possible reasons are:
1) Overoptimistic investor: Several times, investors have expectations that can be different from Wall Street analysts. If investors were too optimistic ahead of the release, the actual earnings failed to impress. This is the most common reason some stocks fall after a “supposed” earnings beat.
2) Quality of Earnings: When robust revenue growth is the main driving force behind high earnings, we can call it quality earnings. This implies that the company’s products or services are witnessing high demand and would continue. However, if the earnings result from cost-cutting, they are deemed unsustainable, and the shares are most likely to drop.
3) Forward Guidance: Most investors are more interested in the forward guidance than the earnings. Even the company management cares more about the stream of future earnings. So, even if a company surpasses the earnings expectations for the quarter but cautions about a weaker coming quarter, then that stock is likely to tank rapidly.
How Do Investors Take Advantage of Post Earnings Announcement Drift?
Post Earnings Announcement Drift is a form of trend trading that leverages breakouts or technical momentum price signals of higher highs. According to some analysts, Post Earnings Announcement Drift can also be a form of growth investing based on the company fundamentals.
As we mentioned, Post Earnings Announcement Drift is an inefficiency that investors can capitalize on if they buy stocks with high earnings surprises and hold them for nearly two months.
Trading on earnings and revenue surprises is a few decades-old strategies. At the same time, most academic researchers focussed on the magnitude and direction of the surprise and the price changes immediately after the announcement.
Morgan Stanley’s Boris Lerner highlighted the importance of earnings quality and revenue stability.8 He suggested the best ways for investors to profit from this situation: buy high-quality stocks that have beaten consensus earnings and revenue estimates during the latest quarter and sell low-quality stocks that trailed expectations.
According to David Bartosiak of Zacks, purchase shares in any company that rose the day following the news of its earnings surprise.9 He said these stocks usually outperform the market during the next nine months. Similarly, he stated that investors should sell any stock in their portfolio that misses its earnings because it is more likely to underperform the market for the next few quarters.
Bartosiak also suggests investors look for stocks about which they can get an earnings tip-off even before the actual announcement. Purchasing these shares just before the official announcement could allow investors to enjoy gains of 10%-20% when the official earnings surprise is revealed.
What Are Some Factors That Can Influence Post Earnings Announcement Drift Movements?
There have been several types of research on the factors that impact the Post Earnings Announcement Drift movement. As a result of most research, analysts have pointed out some factors influencing the Post Earnings Announcement Drift movement. A few important ones of them are:
1. Risk and uncertainty
Research by Ball in 1993 states that betas rise for firms with high unexpected earnings and decline for firms with low unexpected earnings. A rise or a fall in beta (or risk) results from the seemingly abnormal returns after earnings announcements. Also, the Post Earnings Announcement Drift was more intense in subsequent announcement windows.
2. Trading frictions
Trading frictions like transaction costs or liquidity are positively related to Post Earnings Announcement Drift. They can be direct transaction costs (bid-ask spreads, commissions) and indirect transaction costs (illiquidity, market impact costs). It is debatable whether such frictions allow for profitable arbitrage opportunities, depending on trading strategy specifications and risk factors. If there is mispricing within transaction costs, then it might prevent trades.
3. Information Uncertainty
Information uncertainty results in underreaction to earnings news, and the delayed reaction leads to Post Earnings Announcement Drift. The delayed price correction results from the time taken to resolve the uncertainty. It is challenging to distinguish and define behavioral and rational explanations for anomalies in asset pricing.
4. Category of Traders
Active institutional ownership dilutes the impact of Post Earnings Announcement Drift. Small or individual traders form expectations different from sophisticated and institutional investors. There is a mixed conclusion over whether small investors cause Post Earnings Announcement Drift. However, many studies have proven that institutional ownership negatively correlates with Post Earnings Announcement Drift.
5. Types of Institutional Traders
Different classes of institutional investors have a different effect on Post Earnings Announcement Drift. Active institutional investors make prices more efficient. On the other hand, occasional investors exploit the Post Earnings Announcement Drift and lower its occurrence.
High-frequency traders supply liquidity and mitigate market inefficiency, which implies the HFT actions lower the magnitude of the PEAD. On the other hand, a higher portion of passive institutional investors investing in ETFs and Index funds reduce the informational efficiency of prices and accentuate Post Earnings Announcement Drift. According to the Journal of Behavioral and Experimental Finance by Josef Fink, high concentrations of institutional ownership can impede price adjustment.
6. Quality of Earnings
Boris Lerner, Global Head of Quantitative Equity Research at Morgan Stanley, believes that high-quality earnings were more impactful than revenue surprises because they reflected the overall health of the underlying company. In a simulation covering the period starting January 1994 to June 2020, a strategy combining surprise and earnings quality delivered a 7.7% annual return compared to 2.5% for a strategy only involving composite surprise and 5.0% for the other focused on earnings quality.8
7 Market Capitalization
Many investors believe that combining earnings and revenue surprises are primarily for smaller companies and liquid stocks. Yet, researchers found that post-earnings announcement drift persists across all capitalization categories and trading-volume levels. However, the team also found that earnings-surprise outperformance was higher in small- and mid-cap stocks in bear markets. As for large-cap stocks, the performance led by revenue surprises tends to be higher during bull markets.
Empirical Evidence of Post Earnings Announcement Drift Performance
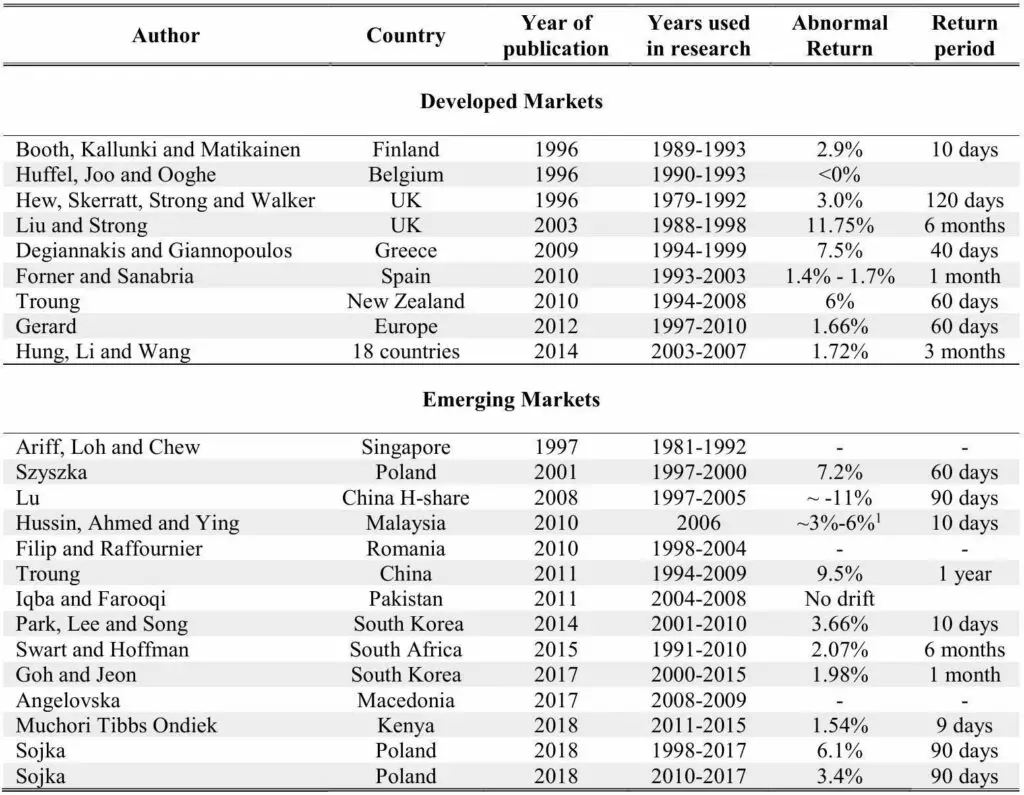
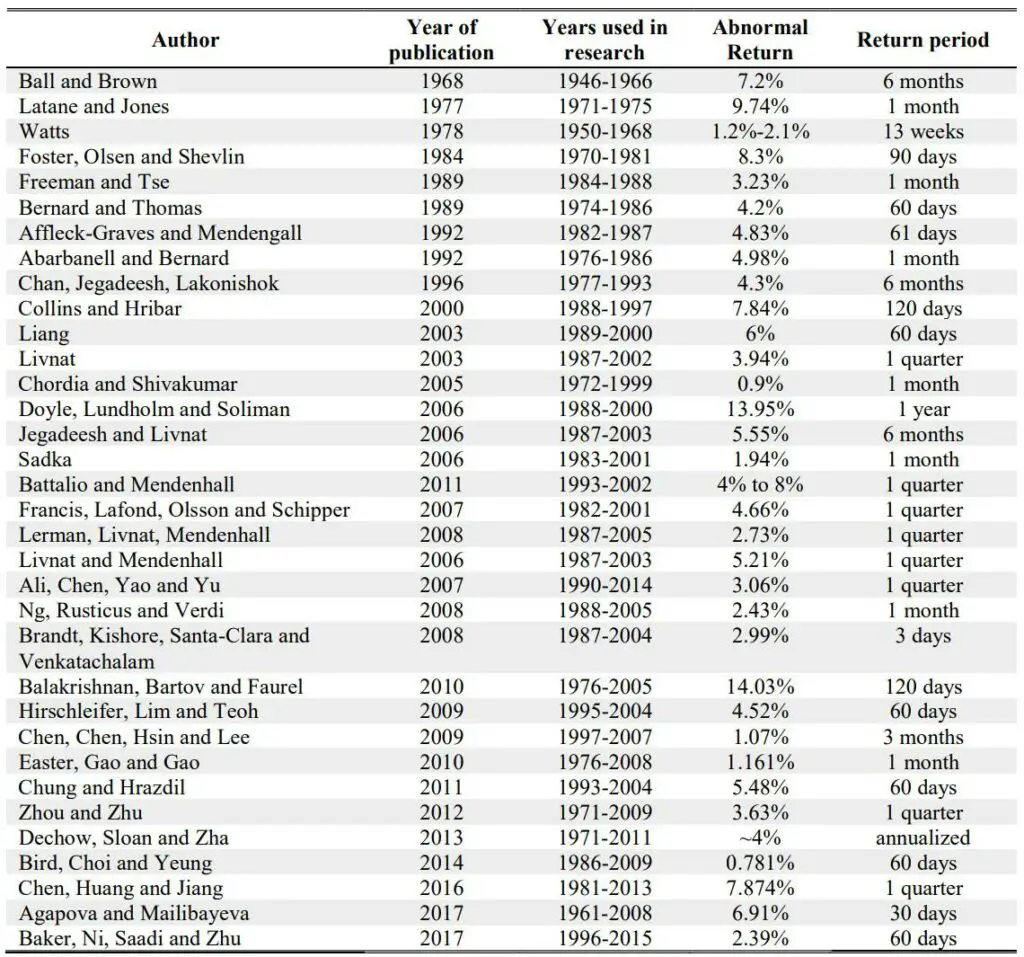
Post Earnings Announcement Drift exists in highly developed and less developed financial markets. It was launched as a concept in 1967 by two Chicago University Professors, Ray Ball and Philip Brown, during the seminar “Analysis of Security Prices.”
Over the next four decades, various academics researched Post Earnings Announcement Drift, a well-documented anomaly.10 Academic evidence reveals that this Post Earnings Announcement Drift strategy produces an abnormal return between 2.6% and 9.37% per quarter.
Since it was first spotted by Ball and Brown (1968) and then tested by various researchers, there were more variations and explanations to Post Earnings Announcement Drift in due course than before.
The whole market reaction attributed to the earnings report, measured from 60 days before and after the earnings release, is estimated at 18%, which means that about a third of the whole market response is delayed.
Post Earnings Announcement Drift profits were very consistent up to the late ’90s. There were dips in the abnormal returns during the internet bubble (1991-2001) and market recovery after the 2008 crash. During the Global Financial Crisis in 2008, investors shunned companies that failed to report revenue and earnings as per expectations. On the other hand, they picked stocks that missed earnings but exceeded revenue.10
Since the middle of the ’90s, Post Earnings Announcement Drift returns fluctuated and became lower than in the previous two decades. Analysts attribute it to the broader academic research in the field and broader recognition of the phenomenon among investors.
A significant part of the Post Earnings Announcement Drift research was conducted in the US and based on US stock market data. The magnitude of Post Earnings Announcement Drift calculated by academics from 1968 until 2017 is mentioned below.
The Bottom Line
The Post Earnings Announcement Drift strategy is rather challenging to implement as it requires data collection and processing at a larger scale. Moreover, recent advancements in information processing technologies may also impact the magnitude of Post Earnings Announcement Drift exploitation.
In a research paper, Charles Martineau derived that as financial markets have evolved, stock prices have begun to fully reflect earnings surprises on the announcement date, and the post-earnings announcement drift has disappeared.11 For large stocks, Post Earnings Announcement Drift has been non-existent since 2006 but has only disappeared recently for microcap stocks.
The cumulative evidence of Martineau showed striking evidence that stock prices have become more efficient following earnings announcements. His results highlight that market efficiency is dynamic and continuously adapts to changes in the environment of financial markets.
Also, things have begun to change after the COVID-19. As a result of the global economic shutdown forced many companies to withdraw earnings guidance. Just 26% of companies in the Russell 1000 are now providing guidance, compared with 47% in 2019.8