The bearish engulfing is a one-bar bearish reversal Japanese candlestick pattern that backtests show suggests volatility.
History shows traditional bearish engulfing methods have a negative edge in all markets tested.
Who likes losing money in every market? I don’t!
But what if I told you that you could turn this unprofitable pattern into a winning trading strategy by listening to the data?
Would you be intrigued?
If so, read on if you want to learn how to trade bearish engulfing candlestick patterns like a technical analysis samurai warrior.
What Is a Bearish Engulfing Candlestick Pattern?

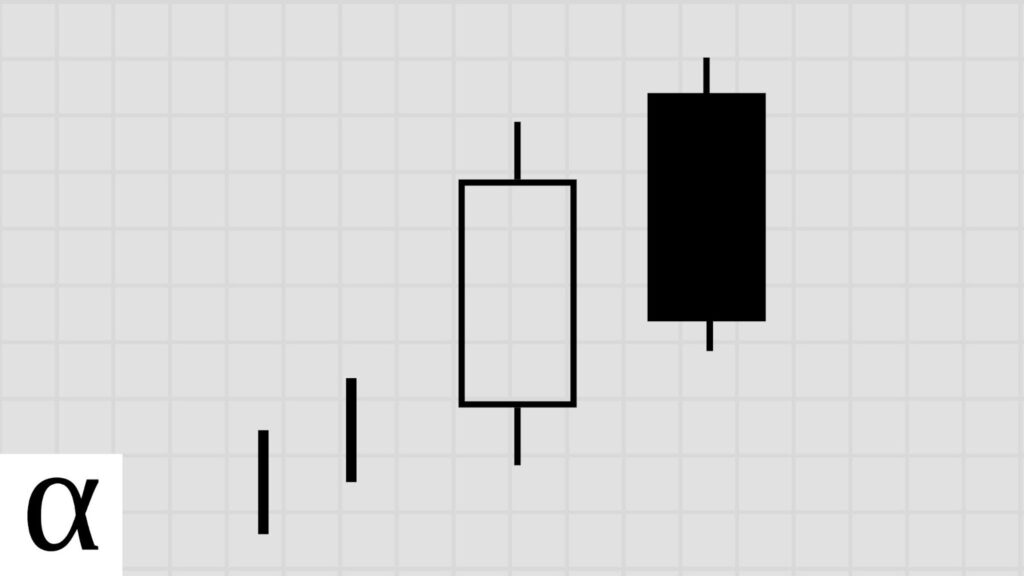
The bearish engulfing is a two-bar engulfing pattern that supposedly alerts traders of a bearish reversal.
The bearish engulfing name comes from the second candle engulfing the prior candle.
But before we dive into the pitiful traditional past performance of this bearish engulfing pattern, let’s learn how to identify it on our candlestick charts.
How to Identify the Bearish Engulfing Candlestick Pattern

The following are the requirements for a valid bearish engulfing pattern:
- The first candle must be a bullish green candle.
- The second candle must have a bearish real body that engulfs the previous candle.
- The bearish engulfing must occur in an uptrend.
Engulfing means that one candle’s open and close fit within the real body of the engulfing candle. The bullish candle is engulfed by the next red candle in bearish engulfing patterns.
We saw the bearish engulfing pattern on the daily Danaher (DHR) chart on November 11th, 2021. Price is in an uptrend as it’s above the 50-day moving average. The second candle is a large red candle that completely engulfs the previous candle.
Now that we can identify this supposed bearish reversal pattern, let’s learn how to trade this pattern using data-driven technical analysis.
How to Trade the Bearish Doji Candlestick Pattern
The bearish engulfing is traded optimally using a bullish mean reversion trading strategy in the crypto and stock markets and executing a bearish mean reversion trading setup in the forex markets.
But before we learn how to trade this engulfing pattern guided by history, let’s understand how most traditional technical analysts unprofitably trade this pattern.
Bearish Engulfing Bearish Reversal Trade Setup

The bearish engulfing candlestick pattern occurs on Tesla’s December 1st, 2021, daily chart. The price exceeds the 50-day simple moving average, fulfilling the uptrend requirement. The first candle is green, with the next candle being a large bearish closing marubozu engulfing the prior day’s real body.
Now that the pattern is identified, traders traditionally enter short on a break of the low of the second candle and place a stop loss above the high of the same engulfing candle.
It was this Apple trader’s lucky day. The trade was profitable, but only by luck – not by statistics.
So if we want to get the odds on our side, how should we trade this bearish engulfing pattern?
Bearish Engulfing Bullish Mean Reversion Trade Setup

Let’s practice identifying the bearish engulfing pattern one more time.
The price is above the 50-day moving average, giving us a shorter-term bull market uptrend. We then identify a bullish candle followed by a bearish candle engulfing the previous candle.
With the pattern identified, we wait for the price to cross the pattern’s low, and we enter long when the price moves back above that low, setting a stop loss of one ATR from our entry price.
To illuminate this, let’s use the above Netflix example. We see the pattern low of $625.16 occurring on the second candle. The next day, the price movies below the pattern low and moves back up, causing an entry at $625.16, leading to a profitable trade for our data-driven trader.
And while this is the best setup for stock and crypto traders, forex traders should go in the other direction.
Bearish Engulfing Bearish Mean Reversion Trade Setup

Smart forex traders wait until the price crosses above the pattern high and then enter short when the price comes back down through that same price.
Using the Amazon chart above as an example, the pattern high occurs on the first bar at $108.51. The price moves above the pattern high two days after the engulfing candle and comes back down to our buy point at $108.51 the very same day.
With a stop loss set at one ATR above the pattern high, this forex trading strategy produced profits.
But what type of profits should we expect?
Does the Bearish Engulfing Pattern Work? (Backtest Results)
Using the following rules, I backtested the bearish engulfing candlestick pattern on the daily timeframe in the crypto, forex, and stock markets.
- A close above the 50-day SMA constitutes an uptrend.
- I tested risk-reward ranges from 1 to 5.
- The optimal risk-reward ratio is selected using profit per bar.
- Entry and exits are discussed in the how-to trade section above.
- Confirmation must occur within three days of the pattern signal.
| Id | Pattern | Pattern Bars | Required Trend | Traditional Strategy | Market | Strategy | Setup | RR | Trades | Edge | Tickers | Signals | Trade Bars | Edge Per Bar | Confirm % | Win % | Cons Wins | Cons Losses | Avg. Trade Bars | Avg. Win Bars | Avg. Loss Bars | Details |
|---|---|---|---|---|---|---|---|---|---|---|---|---|---|---|---|---|---|---|---|---|---|---|
| 7,886 | bearish_engulfing | 2 | uptrend | bearish reversal | crypto | bearish reversal | high-low | 1 | 1,740 | -0.082 | 211 | 2,398 | 11,168 | 18/01/2026 | 0.73 | 0.46 | 21 | 10 | 6.42 | 5.88 | 6.87 | https://analyzingalpha.com/bearish-engulfing-candlestick-pattern |
| 7,887 | bearish_engulfing | 2 | uptrend | bearish reversal | crypto | bearish reversal | high-low | 2 | 1,595 | -0.170 | 211 | 2,224 | 18,425 | 18/01/2026 | 0.72 | 0.28 | 11 | 10 | 11.55 | 13.59 | 10.78 | https://analyzingalpha.com/bearish-engulfing-candlestick-pattern |
| 7,888 | bearish_engulfing | 2 | uptrend | bearish reversal | crypto | bearish reversal | high-low | 3 | 1,464 | -0.265 | 211 | 2,072 | 25,743 | 18/01/2026 | 0.71 | 0.19 | 9 | 17 | 17.58 | 29.57 | 14.86 | https://analyzingalpha.com/bearish-engulfing-candlestick-pattern |
| 7,889 | bearish_engulfing | 2 | uptrend | bearish reversal | crypto | bearish reversal | high-low | 4 | 1,340 | -0.312 | 211 | 1,915 | 31,744 | 18/01/1560 | 0.70 | 0.14 | 8 | 17 | 23.69 | 37.87 | 21.45 | https://analyzingalpha.com/bearish-engulfing-candlestick-pattern |
| 7,890 | bearish_engulfing | 2 | uptrend | bearish reversal | crypto | bearish reversal | high-low | 5 | 1,266 | -0.395 | 211 | 1,824 | 34,528 | 18/01/1975 | 0.69 | 0.10 | 5 | 23 | 27.27 | 46.61 | 25.10 | https://analyzingalpha.com/bearish-engulfing-candlestick-pattern |
| 7,891 | bearish_engulfing | 2 | uptrend | bearish reversal | forex | bearish reversal | high-low | 1 | 22,671 | -0.083 | 847 | 29,679 | 145,894 | 18/01/2026 | 0.76 | 0.46 | 39 | 16 | 6.44 | 6.94 | 6.01 | https://analyzingalpha.com/bearish-engulfing-candlestick-pattern |
| 7,892 | bearish_engulfing | 2 | uptrend | bearish reversal | forex | bearish reversal | high-low | 2 | 21,503 | -0.102 | 847 | 28,218 | 261,459 | 18/01/2026 | 0.76 | 0.30 | 26 | 28 | 12.16 | 16.65 | 10.25 | https://analyzingalpha.com/bearish-engulfing-candlestick-pattern |
| 7,893 | bearish_engulfing | 2 | uptrend | bearish reversal | forex | bearish reversal | high-low | 3 | 20,603 | -0.123 | 847 | 27,094 | 376,181 | 18/01/2026 | 0.76 | 0.22 | 20 | 35 | 18.26 | 32.90 | 14.16 | https://analyzingalpha.com/bearish-engulfing-candlestick-pattern |
| 7,894 | bearish_engulfing | 2 | uptrend | bearish reversal | forex | bearish reversal | high-low | 4 | 19,743 | -0.146 | 847 | 26,039 | 471,505 | 18/01/2026 | 0.76 | 0.17 | 15 | 35 | 23.88 | 51.83 | 18.12 | https://analyzingalpha.com/bearish-engulfing-candlestick-pattern |
| 7,895 | bearish_engulfing | 2 | uptrend | bearish reversal | forex | bearish reversal | high-low | 5 | 18,897 | -0.175 | 847 | 24,985 | 546,554 | 18/01/0875 | 0.76 | 0.14 | 14 | 35 | 28.92 | 70.20 | 22.35 | https://analyzingalpha.com/bearish-engulfing-candlestick-pattern |
| 7,896 | bearish_engulfing | 2 | uptrend | bearish reversal | stock | bearish reversal | high-low | 1 | 206,110 | -0.042 | 5,246 | 265,192 | 1,068,074 | 18/01/2026 | 0.78 | 0.48 | 62 | 15 | 5.18 | 5.10 | 5.26 | https://analyzingalpha.com/bearish-engulfing-candlestick-pattern |
| 7,897 | bearish_engulfing | 2 | uptrend | bearish reversal | stock | bearish reversal | high-low | 2 | 195,559 | -0.062 | 5,246 | 251,911 | 1,835,516 | 18/01/2026 | 0.78 | 0.31 | 38 | 23 | 9.39 | 11.90 | 8.24 | https://analyzingalpha.com/bearish-engulfing-candlestick-pattern |
| 7,898 | bearish_engulfing | 2 | uptrend | bearish reversal | stock | bearish reversal | high-low | 3 | 187,860 | -0.086 | 5,246 | 242,308 | 2,544,913 | 18/01/2026 | 0.78 | 0.23 | 30 | 30 | 13.55 | 21.46 | 11.21 | https://analyzingalpha.com/bearish-engulfing-candlestick-pattern |
| 7,899 | bearish_engulfing | 2 | uptrend | bearish reversal | stock | bearish reversal | high-low | 4 | 180,360 | -0.112 | 5,246 | 233,082 | 3,143,518 | 18/01/0560 | 0.77 | 0.18 | 23 | 48 | 17.43 | 32.17 | 14.26 | https://analyzingalpha.com/bearish-engulfing-candlestick-pattern |
| 7,900 | bearish_engulfing | 2 | uptrend | bearish reversal | stock | bearish reversal | high-low | 5 | 173,281 | -0.150 | 5,246 | 224,410 | 3,631,513 | 18/01/2026 | 0.77 | 0.14 | 21 | 59 | 20.96 | 44.32 | 17.08 | https://analyzingalpha.com/bearish-engulfing-candlestick-pattern |
| 7,976 | bearish_engulfing | 2 | uptrend | bearish reversal | crypto | bullish continuation | low-high | 1 | 1,106 | -0.143 | 211 | 2,533 | 3,457 | 18/01/2026 | 0.44 | 0.43 | 5 | 9 | 3.13 | 3.81 | 2.62 | https://analyzingalpha.com/bearish-engulfing-candlestick-pattern |
| 7,977 | bearish_engulfing | 2 | uptrend | bearish reversal | crypto | bullish continuation | low-high | 2 | 1,075 | -0.068 | 211 | 2,467 | 5,369 | 18/01/2026 | 0.44 | 0.31 | 3 | 9 | 4.99 | 6.58 | 4.28 | https://analyzingalpha.com/bearish-engulfing-candlestick-pattern |
| 7,978 | bearish_engulfing | 2 | uptrend | bearish reversal | crypto | bullish continuation | low-high | 3 | 1,061 | -0.028 | 211 | 2,427 | 6,686 | 18/01/2026 | 0.44 | 0.24 | 3 | 14 | 6.30 | 9.36 | 5.31 | https://analyzingalpha.com/bearish-engulfing-candlestick-pattern |
| 7,979 | bearish_engulfing | 2 | uptrend | bearish reversal | crypto | bullish continuation | low-high | 4 | 1,038 | 0.016 | 211 | 2,382 | 8,340 | 0.44 | 0.20 | 3 | 16 | 8.03 | 12.08 | 7.00 | https://analyzingalpha.com/bearish-engulfing-candlestick-pattern | |
| 7,980 | bearish_engulfing | 2 | uptrend | bearish reversal | crypto | bullish continuation | low-high | 5 | 1,028 | 0.095 | 211 | 2,356 | 9,137 | 0.44 | 0.18 | 3 | 16 | 8.89 | 15.56 | 7.39 | https://analyzingalpha.com/bearish-engulfing-candlestick-pattern | |
| 7,981 | bearish_engulfing | 2 | uptrend | bearish reversal | forex | bullish continuation | low-high | 1 | 11,439 | -0.362 | 847 | 30,681 | 49,357 | 18/01/2026 | 0.37 | 0.32 | 4 | 25 | 4.31 | 5.64 | 3.69 | https://analyzingalpha.com/bearish-engulfing-candlestick-pattern |
| 7,982 | bearish_engulfing | 2 | uptrend | bearish reversal | forex | bullish continuation | low-high | 2 | 11,085 | -0.390 | 847 | 29,763 | 80,735 | 18/01/2026 | 0.37 | 0.21 | 4 | 25 | 7.28 | 12.69 | 5.89 | https://analyzingalpha.com/bearish-engulfing-candlestick-pattern |
| 7,983 | bearish_engulfing | 2 | uptrend | bearish reversal | forex | bullish continuation | low-high | 3 | 10,809 | -0.394 | 847 | 28,998 | 110,379 | 18/01/1970 | 0.37 | 0.15 | 2 | 25 | 10.21 | 22.78 | 7.96 | https://analyzingalpha.com/bearish-engulfing-candlestick-pattern |
| 7,984 | bearish_engulfing | 2 | uptrend | bearish reversal | forex | bullish continuation | low-high | 4 | 10,601 | -0.400 | 847 | 28,393 | 135,408 | 18/01/2026 | 0.37 | 0.12 | 2 | 31 | 12.77 | 35.17 | 9.73 | https://analyzingalpha.com/bearish-engulfing-candlestick-pattern |
| 7,985 | bearish_engulfing | 2 | uptrend | bearish reversal | forex | bullish continuation | low-high | 5 | 10,401 | -0.410 | 847 | 27,910 | 157,916 | 18/01/2026 | 0.37 | 0.10 | 2 | 31 | 15.18 | 48.83 | 11.52 | https://analyzingalpha.com/bearish-engulfing-candlestick-pattern |
| 7,986 | bearish_engulfing | 2 | uptrend | bearish reversal | stock | bullish continuation | low-high | 1 | 114,172 | -0.163 | 5,246 | 271,399 | 405,298 | 18/01/2026 | 0.42 | 0.42 | 11 | 21 | 3.55 | 4.09 | 3.16 | https://analyzingalpha.com/bearish-engulfing-candlestick-pattern |
| 7,987 | bearish_engulfing | 2 | uptrend | bearish reversal | stock | bullish continuation | low-high | 2 | 110,450 | -0.106 | 5,246 | 262,788 | 637,997 | 18/01/2026 | 0.42 | 0.30 | 7 | 21 | 5.78 | 8.58 | 4.59 | https://analyzingalpha.com/bearish-engulfing-candlestick-pattern |
| 7,988 | bearish_engulfing | 2 | uptrend | bearish reversal | stock | bullish continuation | low-high | 3 | 107,292 | -0.068 | 5,246 | 255,438 | 847,731 | 18/01/2026 | 0.42 | 0.23 | 5 | 31 | 7.90 | 14.31 | 5.94 | https://analyzingalpha.com/bearish-engulfing-candlestick-pattern |
| 7,989 | bearish_engulfing | 2 | uptrend | bearish reversal | stock | bullish continuation | low-high | 4 | 104,687 | -0.016 | 5,246 | 249,291 | 1,037,684 | 18/01/0080 | 0.42 | 0.20 | 5 | 31 | 9.91 | 21.28 | 7.14 | https://analyzingalpha.com/bearish-engulfing-candlestick-pattern |
| 7,990 | bearish_engulfing | 2 | uptrend | bearish reversal | stock | bullish continuation | low-high | 5 | 102,415 | 0.020 | 5,246 | 244,043 | 1,215,516 | 0.42 | 0.17 | 5 | 43 | 11.87 | 29.20 | 8.31 | https://analyzingalpha.com/bearish-engulfing-candlestick-pattern | |
| 9,131 | bearish_engulfing | 2 | uptrend | bearish reversal | crypto | bullish mean reversion | atr-pattern_low | 1 | 1,456 | 0.184 | 211 | 2,386 | 8,651 | 0.61 | 0.59 | 7 | 4 | 5.94 | 5.57 | 6.49 | https://analyzingalpha.com/bearish-engulfing-candlestick-pattern | |
| 9,132 | bearish_engulfing | 2 | uptrend | bearish reversal | crypto | bullish mean reversion | atr-pattern_low | 2 | 1,351 | 0.328 | 211 | 2,231 | 13,638 | 0.61 | 0.44 | 7 | 5 | 10.09 | 11.22 | 9.19 | https://analyzingalpha.com/bearish-engulfing-candlestick-pattern | |
| 9,133 | bearish_engulfing | 2 | uptrend | bearish reversal | crypto | bullish mean reversion | atr-pattern_low | 3 | 1,273 | 0.391 | 211 | 2,107 | 16,497 | 0.60 | 0.35 | 4 | 14 | 12.96 | 15.98 | 11.35 | https://analyzingalpha.com/bearish-engulfing-candlestick-pattern | |
| 9,134 | bearish_engulfing | 2 | uptrend | bearish reversal | crypto | bullish mean reversion | atr-pattern_low | 4 | 1,234 | 0.550 | 211 | 2,046 | 18,655 | 0.60 | 0.31 | 4 | 14 | 15.12 | 19.97 | 12.93 | https://analyzingalpha.com/bearish-engulfing-candlestick-pattern | |
| 9,135 | bearish_engulfing | 2 | uptrend | bearish reversal | crypto | bullish mean reversion | atr-pattern_low | 5 | 1,189 | 0.575 | 211 | 1,982 | 19,861 | 0.60 | 0.26 | 3 | 17 | 16.70 | 23.64 | 14.23 | https://analyzingalpha.com/bearish-engulfing-candlestick-pattern | |
| 9,136 | bearish_engulfing | 2 | uptrend | bearish reversal | forex | bullish mean reversion | atr-pattern_low | 1 | 19,356 | 0.195 | 847 | 30,351 | 88,434 | 0.64 | 0.60 | 17 | 7 | 4.57 | 4.28 | 5.00 | https://analyzingalpha.com/bearish-engulfing-candlestick-pattern | |
| 9,137 | bearish_engulfing | 2 | uptrend | bearish reversal | forex | bullish mean reversion | atr-pattern_low | 2 | 17,774 | 0.166 | 847 | 27,927 | 182,558 | 0.64 | 0.39 | 8 | 13 | 10.27 | 12.18 | 9.06 | https://analyzingalpha.com/bearish-engulfing-candlestick-pattern | |
| 9,138 | bearish_engulfing | 2 | uptrend | bearish reversal | forex | bullish mean reversion | atr-pattern_low | 3 | 16,624 | 0.135 | 847 | 26,146 | 256,368 | 0.64 | 0.29 | 4 | 20 | 15.42 | 22.77 | 12.49 | https://analyzingalpha.com/bearish-engulfing-candlestick-pattern | |
| 9,139 | bearish_engulfing | 2 | uptrend | bearish reversal | forex | bullish mean reversion | atr-pattern_low | 4 | 15,679 | 0.146 | 847 | 24,717 | 314,477 | 0.63 | 0.23 | 4 | 25 | 20.06 | 35.23 | 15.54 | https://analyzingalpha.com/bearish-engulfing-candlestick-pattern | |
| 9,140 | bearish_engulfing | 2 | uptrend | bearish reversal | forex | bullish mean reversion | atr-pattern_low | 5 | 14,932 | 0.130 | 847 | 23,612 | 368,806 | 0.63 | 0.19 | 4 | 27 | 24.70 | 51.92 | 18.39 | https://analyzingalpha.com/bearish-engulfing-candlestick-pattern | |
| 9,141 | bearish_engulfing | 2 | uptrend | bearish reversal | stock | bullish mean reversion | atr-pattern_low | 1 | 168,692 | 0.179 | 5,246 | 267,208 | 705,799 | 0.63 | 0.59 | 17 | 10 | 4.18 | 3.96 | 4.50 | https://analyzingalpha.com/bearish-engulfing-candlestick-pattern | |
| 9,142 | bearish_engulfing | 2 | uptrend | bearish reversal | stock | bullish mean reversion | atr-pattern_low | 2 | 156,593 | 0.226 | 5,246 | 248,845 | 1,234,191 | 0.63 | 0.41 | 9 | 16 | 7.88 | 9.24 | 6.94 | https://analyzingalpha.com/bearish-engulfing-candlestick-pattern | |
| 9,143 | bearish_engulfing | 2 | uptrend | bearish reversal | stock | bullish mean reversion | atr-pattern_low | 3 | 147,499 | 0.277 | 5,246 | 235,005 | 1,647,555 | 0.63 | 0.32 | 6 | 29 | 11.17 | 15.61 | 9.09 | https://analyzingalpha.com/bearish-engulfing-candlestick-pattern | |
| 9,144 | bearish_engulfing | 2 | uptrend | bearish reversal | stock | bullish mean reversion | atr-pattern_low | 4 | 140,315 | 0.320 | 5,246 | 224,111 | 2,008,078 | 0.63 | 0.27 | 6 | 32 | 14.31 | 23.44 | 11.02 | https://analyzingalpha.com/bearish-engulfing-candlestick-pattern | |
| 9,145 | bearish_engulfing | 2 | uptrend | bearish reversal | stock | bullish mean reversion | atr-pattern_low | 5 | 134,351 | 0.375 | 5,246 | 214,991 | 2,317,605 | 0.62 | 0.23 | 5 | 32 | 17.25 | 32.38 | 12.75 | https://analyzingalpha.com/bearish-engulfing-candlestick-pattern | |
| 9,736 | bearish_engulfing | 2 | uptrend | bearish reversal | crypto | bearish mean reversion | atr-pattern_high | 1 | 819 | 0.001 | 211 | 2,531 | 2,850 | 0.32 | 0.50 | 10 | 6 | 3.48 | 3.34 | 3.62 | https://analyzingalpha.com/bearish-engulfing-candlestick-pattern | |
| 9,737 | bearish_engulfing | 2 | uptrend | bearish reversal | crypto | bearish mean reversion | atr-pattern_high | 2 | 784 | -0.068 | 211 | 2,436 | 5,575 | 18/01/2026 | 0.32 | 0.31 | 7 | 8 | 7.11 | 8.07 | 6.68 | https://analyzingalpha.com/bearish-engulfing-candlestick-pattern |
| 9,738 | bearish_engulfing | 2 | uptrend | bearish reversal | crypto | bearish mean reversion | atr-pattern_high | 3 | 764 | -0.129 | 211 | 2,387 | 8,199 | 18/01/2026 | 0.32 | 0.22 | 5 | 12 | 10.73 | 18.51 | 8.57 | https://analyzingalpha.com/bearish-engulfing-candlestick-pattern |
| 9,739 | bearish_engulfing | 2 | uptrend | bearish reversal | crypto | bearish mean reversion | atr-pattern_high | 4 | 736 | -0.242 | 211 | 2,333 | 10,251 | 18/01/2026 | 0.32 | 0.15 | 4 | 12 | 13.93 | 30.54 | 10.95 | https://analyzingalpha.com/bearish-engulfing-candlestick-pattern |
| 9,740 | bearish_engulfing | 2 | uptrend | bearish reversal | crypto | bearish mean reversion | atr-pattern_high | 5 | 711 | -0.415 | 211 | 2,277 | 12,162 | 18/01/2075 | 0.31 | 0.10 | 3 | 12 | 17.11 | 47.52 | 13.84 | https://analyzingalpha.com/bearish-engulfing-candlestick-pattern |
| 9,741 | bearish_engulfing | 2 | uptrend | bearish reversal | forex | bearish mean reversion | atr-pattern_high | 1 | 8,845 | 0.221 | 847 | 30,937 | 33,900 | 0.29 | 0.61 | 29 | 6 | 3.83 | 3.62 | 4.17 | https://analyzingalpha.com/bearish-engulfing-candlestick-pattern | |
| 9,742 | bearish_engulfing | 2 | uptrend | bearish reversal | forex | bearish mean reversion | atr-pattern_high | 2 | 8,453 | 0.252 | 847 | 29,711 | 73,790 | 0.28 | 0.42 | 19 | 12 | 8.73 | 10.35 | 7.57 | https://analyzingalpha.com/bearish-engulfing-candlestick-pattern | |
| 9,743 | bearish_engulfing | 2 | uptrend | bearish reversal | forex | bearish mean reversion | atr-pattern_high | 3 | 8,273 | 0.212 | 847 | 29,153 | 112,302 | 0.28 | 0.30 | 13 | 15 | 13.57 | 19.38 | 11.04 | https://analyzingalpha.com/bearish-engulfing-candlestick-pattern | |
| 9,744 | bearish_engulfing | 2 | uptrend | bearish reversal | forex | bearish mean reversion | atr-pattern_high | 4 | 8,136 | 0.192 | 847 | 28,734 | 148,810 | 0.28 | 0.24 | 11 | 17 | 18.29 | 31.37 | 14.21 | https://analyzingalpha.com/bearish-engulfing-candlestick-pattern | |
| 9,745 | bearish_engulfing | 2 | uptrend | bearish reversal | forex | bearish mean reversion | atr-pattern_high | 5 | 8,036 | 0.160 | 847 | 28,448 | 183,850 | 0.28 | 0.19 | 10 | 26 | 22.88 | 47.00 | 17.07 | https://analyzingalpha.com/bearish-engulfing-candlestick-pattern | |
| 9,746 | bearish_engulfing | 2 | uptrend | bearish reversal | stock | bearish mean reversion | atr-pattern_high | 1 | 86,299 | 0.140 | 5,246 | 270,882 | 295,163 | 0.32 | 0.57 | 38 | 9 | 3.42 | 3.26 | 3.63 | https://analyzingalpha.com/bearish-engulfing-candlestick-pattern | |
| 9,747 | bearish_engulfing | 2 | uptrend | bearish reversal | stock | bearish mean reversion | atr-pattern_high | 2 | 83,322 | 0.134 | 5,246 | 261,617 | 540,643 | 0.32 | 0.38 | 28 | 17 | 6.49 | 7.48 | 5.89 | https://analyzingalpha.com/bearish-engulfing-candlestick-pattern | |
| 9,748 | bearish_engulfing | 2 | uptrend | bearish reversal | stock | bearish mean reversion | atr-pattern_high | 3 | 81,685 | 0.105 | 5,246 | 256,852 | 774,493 | 0.32 | 0.28 | 20 | 26 | 9.48 | 13.21 | 8.07 | https://analyzingalpha.com/bearish-engulfing-candlestick-pattern | |
| 9,749 | bearish_engulfing | 2 | uptrend | bearish reversal | stock | bearish mean reversion | atr-pattern_high | 4 | 80,569 | 0.062 | 5,246 | 253,809 | 997,850 | 0.32 | 0.21 | 19 | 28 | 12.39 | 20.74 | 10.12 | https://analyzingalpha.com/bearish-engulfing-candlestick-pattern | |
| 9,750 | bearish_engulfing | 2 | uptrend | bearish reversal | stock | bearish mean reversion | atr-pattern_high | 5 | 79,594 | 0.030 | 5,246 | 251,286 | 1,211,542 | 0.32 | 0.17 | 15 | 35 | 15.22 | 30.03 | 12.15 | https://analyzingalpha.com/bearish-engulfing-candlestick-pattern | |
| 10,856 | bearish_engulfing | 2 | uptrend | bearish reversal | crypto | bearish reversal | high-close | 1 | 2,410 | -0.063 | 211 | 2,484 | 11,252 | 18/01/2026 | 0.97 | 0.47 | 27 | 8 | 4.67 | 3.90 | 5.34 | https://analyzingalpha.com/bearish-engulfing-candlestick-pattern |
| 10,857 | bearish_engulfing | 2 | uptrend | bearish reversal | crypto | bearish reversal | high-close | 2 | 2,204 | -0.050 | 211 | 2,284 | 18,971 | 18/01/2026 | 0.96 | 0.32 | 18 | 9 | 8.61 | 10.73 | 7.63 | https://analyzingalpha.com/bearish-engulfing-candlestick-pattern |
| 10,858 | bearish_engulfing | 2 | uptrend | bearish reversal | crypto | bearish reversal | high-close | 3 | 2,050 | -0.111 | 211 | 2,147 | 24,762 | 18/01/2026 | 0.95 | 0.22 | 17 | 15 | 12.08 | 16.86 | 10.70 | https://analyzingalpha.com/bearish-engulfing-candlestick-pattern |
| 10,859 | bearish_engulfing | 2 | uptrend | bearish reversal | crypto | bearish reversal | high-close | 4 | 1,914 | -0.204 | 211 | 2,022 | 30,479 | 18/01/2026 | 0.95 | 0.16 | 10 | 16 | 15.92 | 24.32 | 14.34 | https://analyzingalpha.com/bearish-engulfing-candlestick-pattern |
| 10,860 | bearish_engulfing | 2 | uptrend | bearish reversal | crypto | bearish reversal | high-close | 5 | 1,776 | -0.260 | 211 | 1,891 | 35,981 | 18/01/2026 | 0.94 | 0.12 | 7 | 20 | 20.26 | 35.80 | 18.06 | https://analyzingalpha.com/bearish-engulfing-candlestick-pattern |
| 10,861 | bearish_engulfing | 2 | uptrend | bearish reversal | forex | bearish reversal | high-close | 1 | 29,799 | -0.004 | 847 | 30,464 | 124,652 | 18/01/2026 | 0.98 | 0.50 | 54 | 23 | 4.18 | 4.23 | 4.14 | https://analyzingalpha.com/bearish-engulfing-candlestick-pattern |
| 10,862 | bearish_engulfing | 2 | uptrend | bearish reversal | forex | bearish reversal | high-close | 2 | 28,140 | 0.018 | 847 | 28,809 | 222,503 | 0.98 | 0.34 | 37 | 23 | 7.91 | 9.82 | 6.93 | https://analyzingalpha.com/bearish-engulfing-candlestick-pattern | |
| 10,863 | bearish_engulfing | 2 | uptrend | bearish reversal | forex | bearish reversal | high-close | 3 | 27,059 | 0.006 | 847 | 27,760 | 319,983 | 0.97 | 0.25 | 31 | 28 | 11.83 | 18.41 | 9.61 | https://analyzingalpha.com/bearish-engulfing-candlestick-pattern | |
| 10,864 | bearish_engulfing | 2 | uptrend | bearish reversal | forex | bearish reversal | high-close | 4 | 26,054 | -0.020 | 847 | 26,771 | 407,892 | 18/01/2026 | 0.97 | 0.20 | 23 | 42 | 15.66 | 30.07 | 12.17 | https://analyzingalpha.com/bearish-engulfing-candlestick-pattern |
| 10,865 | bearish_engulfing | 2 | uptrend | bearish reversal | forex | bearish reversal | high-close | 5 | 25,043 | -0.040 | 847 | 25,786 | 496,907 | 18/01/2026 | 0.97 | 0.16 | 21 | 42 | 19.84 | 44.77 | 15.09 | https://analyzingalpha.com/bearish-engulfing-candlestick-pattern |
| 10,866 | bearish_engulfing | 2 | uptrend | bearish reversal | stock | bearish reversal | high-close | 1 | 243,821 | -0.002 | 5,246 | 270,759 | 991,273 | 18/01/2026 | 0.90 | 0.50 | 73 | 13 | 4.07 | 3.89 | 4.24 | https://analyzingalpha.com/bearish-engulfing-candlestick-pattern |
| 10,867 | bearish_engulfing | 2 | uptrend | bearish reversal | stock | bearish reversal | high-close | 2 | 231,149 | 0.014 | 5,246 | 256,969 | 1,680,969 | 0.90 | 0.34 | 45 | 19 | 7.27 | 8.73 | 6.53 | https://analyzingalpha.com/bearish-engulfing-candlestick-pattern | |
| 10,868 | bearish_engulfing | 2 | uptrend | bearish reversal | stock | bearish reversal | high-close | 3 | 222,123 | 0.000 | 5,246 | 247,250 | 2,335,751 | 0.90 | 0.25 | 34 | 27 | 10.52 | 15.21 | 8.95 | https://analyzingalpha.com/bearish-engulfing-candlestick-pattern | |
| 10,869 | bearish_engulfing | 2 | uptrend | bearish reversal | stock | bearish reversal | high-close | 4 | 214,312 | -0.012 | 5,246 | 238,941 | 2,882,125 | 18/01/0060 | 0.90 | 0.20 | 28 | 36 | 13.45 | 22.86 | 11.14 | https://analyzingalpha.com/bearish-engulfing-candlestick-pattern |
| 10,870 | bearish_engulfing | 2 | uptrend | bearish reversal | stock | bearish reversal | high-close | 5 | 206,863 | -0.035 | 5,246 | 231,068 | 3,365,662 | 18/01/0175 | 0.90 | 0.16 | 24 | 70 | 16.27 | 31.62 | 13.33 | https://analyzingalpha.com/bearish-engulfing-candlestick-pattern |
| 12,556 | bearish_engulfing | 2 | uptrend | bearish reversal | crypto | bullish continuation | low-close | 1 | 2,647 | -0.299 | 211 | 2,692 | 4,008 | 18/01/1495 | 0.98 | 0.35 | 6 | 13 | 1.51 | 1.90 | 1.31 | https://analyzingalpha.com/bearish-engulfing-candlestick-pattern |
| 12,557 | bearish_engulfing | 2 | uptrend | bearish reversal | crypto | bullish continuation | low-close | 2 | 2,595 | -0.132 | 211 | 2,641 | 5,370 | 18/01/0660 | 0.98 | 0.29 | 5 | 12 | 2.07 | 2.91 | 1.73 | https://analyzingalpha.com/bearish-engulfing-candlestick-pattern |
| 12,558 | bearish_engulfing | 2 | uptrend | bearish reversal | crypto | bullish continuation | low-close | 3 | 2,547 | -0.006 | 211 | 2,594 | 6,234 | 18/01/2026 | 0.98 | 0.25 | 4 | 14 | 2.45 | 3.89 | 1.97 | https://analyzingalpha.com/bearish-engulfing-candlestick-pattern |
| 12,559 | bearish_engulfing | 2 | uptrend | bearish reversal | crypto | bullish continuation | low-close | 4 | 2,516 | 0.104 | 211 | 2,563 | 7,233 | 0.98 | 0.22 | 4 | 18 | 2.87 | 4.87 | 2.31 | https://analyzingalpha.com/bearish-engulfing-candlestick-pattern | |
| 12,560 | bearish_engulfing | 2 | uptrend | bearish reversal | crypto | bullish continuation | low-close | 5 | 2,481 | 0.205 | 211 | 2,528 | 8,161 | 0.98 | 0.20 | 4 | 18 | 3.29 | 5.75 | 2.67 | https://analyzingalpha.com/bearish-engulfing-candlestick-pattern | |
| 12,561 | bearish_engulfing | 2 | uptrend | bearish reversal | forex | bullish continuation | low-close | 1 | 32,168 | -0.403 | 847 | 32,467 | 50,435 | 18/01/2026 | 0.99 | 0.30 | 5 | 25 | 1.57 | 1.87 | 1.44 | https://analyzingalpha.com/bearish-engulfing-candlestick-pattern |
| 12,562 | bearish_engulfing | 2 | uptrend | bearish reversal | forex | bullish continuation | low-close | 2 | 31,789 | -0.290 | 847 | 32,092 | 66,462 | 18/01/2026 | 0.99 | 0.24 | 4 | 29 | 2.09 | 2.78 | 1.88 | https://analyzingalpha.com/bearish-engulfing-candlestick-pattern |
| 12,563 | bearish_engulfing | 2 | uptrend | bearish reversal | forex | bullish continuation | low-close | 3 | 31,441 | -0.228 | 847 | 31,749 | 80,347 | 18/01/2026 | 0.99 | 0.19 | 4 | 38 | 2.56 | 3.97 | 2.21 | https://analyzingalpha.com/bearish-engulfing-candlestick-pattern |
| 12,564 | bearish_engulfing | 2 | uptrend | bearish reversal | forex | bullish continuation | low-close | 4 | 31,067 | -0.184 | 847 | 31,377 | 95,640 | 18/01/2026 | 0.99 | 0.16 | 4 | 38 | 3.08 | 5.57 | 2.59 | https://analyzingalpha.com/bearish-engulfing-candlestick-pattern |
| 12,565 | bearish_engulfing | 2 | uptrend | bearish reversal | forex | bullish continuation | low-close | 5 | 30,711 | -0.145 | 847 | 31,027 | 107,516 | 18/01/2026 | 0.99 | 0.14 | 4 | 58 | 3.50 | 7.12 | 2.90 | https://analyzingalpha.com/bearish-engulfing-candlestick-pattern |
| 12,566 | bearish_engulfing | 2 | uptrend | bearish reversal | stock | bullish continuation | low-close | 1 | 270,312 | -0.341 | 5,246 | 291,356 | 354,109 | 18/01/2026 | 0.93 | 0.33 | 7 | 21 | 1.31 | 1.46 | 1.23 | https://analyzingalpha.com/bearish-engulfing-candlestick-pattern |
| 12,567 | bearish_engulfing | 2 | uptrend | bearish reversal | stock | bullish continuation | low-close | 2 | 268,001 | -0.150 | 5,246 | 288,902 | 430,921 | 18/01/2026 | 0.93 | 0.29 | 7 | 25 | 1.61 | 2.00 | 1.45 | https://analyzingalpha.com/bearish-engulfing-candlestick-pattern |
| 12,568 | bearish_engulfing | 2 | uptrend | bearish reversal | stock | bullish continuation | low-close | 3 | 265,645 | 0.003 | 5,246 | 286,420 | 502,171 | 0.93 | 0.25 | 6 | 28 | 1.89 | 2.62 | 1.64 | https://analyzingalpha.com/bearish-engulfing-candlestick-pattern | |
| 12,569 | bearish_engulfing | 2 | uptrend | bearish reversal | stock | bullish continuation | low-close | 4 | 263,420 | 0.138 | 5,246 | 284,066 | 570,456 | 0.93 | 0.23 | 6 | 32 | 2.17 | 3.31 | 1.83 | https://analyzingalpha.com/bearish-engulfing-candlestick-pattern | |
| 12,570 | bearish_engulfing | 2 | uptrend | bearish reversal | stock | bullish continuation | low-close | 5 | 261,230 | 0.250 | 5,246 | 281,734 | 635,942 | 0.93 | 0.21 | 6 | 57 | 2.43 | 4.05 | 2.01 | https://analyzingalpha.com/bearish-engulfing-candlestick-pattern | |
| Market | Strategy | Setup | Trades | Edge |
Pattern:
Pattern Bars:
Required Trend:
Traditional Strategy:
Market:
Strategy:
Setup:
RR:
Trades:
Edge:
Tickers:
Signals:
Trade Bars:
Edge Per Bar:
Confirm %:
Win %:
Cons Wins:
Cons Losses:
Avg. Trade Bars:
Avg. Win Bars:
Avg. Loss Bars:
Similar Candlestick Patterns
Multiple candlestick patterns are similar to the bearish engulfing. It’s essential to understand the differences between these patterns when using candlestick pattern technical analysis.
Bullish Engulfing vs. Bearish Engulfing Candlestick Patterns

The bullish engulfing candlestick pattern is a mirror image of its bearish counterpart. The bullish engulfing pattern occurs in a downtrend, with the first candle being bearish and the second candle turning bull and fully engulfing the previous.
Bearish Harami vs. Bearish Engulfing Candlestick Patterns

The bearish harami and the bearish engulfing candlestick patterns are also highly similar. The only difference between them is the order of their candles. In the bearish harami, the first candle engulfs the second, whereas, in the bearish engulfing, the second candle engulfs the first.
Dark Cloud Cover vs. Bearish Engulfing Candlestick Patterns
The dark cloud cover candlestick pattern sometimes gets confused with the bearish engulfing pattern.
Both patterns occur in an uptrend, and both supposedly signal a reversal. Still, in the case of the dark cloud cover, the second candle only engulfs the upper portion of the real body and closes roughly within the middle of the last candle’s real body.
The Bottom Line
The bearish engulfing occurs in all markets and supposedly portends a bearish reversal; however, history tells us otherwise. In all markets, the bearish engulfing tells us that volatility is incoming, and the best way to profit from this volatility is to use a bullish mean reversion trading strategy.
I ranked and reviewed every candlestick pattern, so you don’t have to guess when trading candlestick patterns.