I analyzed over seven hundred million Japanese candlestick pattern trades in the crypto, forex, and stock market spanning multiple decades to determine what works and doesn’t.
Isn’t data science cool?
If you’re a trader struggling to make money with candlestick patterns or if you’re just interested in learning about this ancient Japanese art, you’ve found the holy grail.
Almost all traders use candlestick patterns incorrectly, but I’ve created a solution.
I believe it’s 100x better than anything else out there. I hope you agree and enjoy learning about these candlestick patterns as much as I enjoy profiting from them.
You’ll learn everything you need to know about trading candlestick patterns, like Homma Munehisa, the ancient Japanese rice farmer who discovered candlestick patterns leading to untold riches.
But let’s slice through the pleasantries and get right to business.
This article is massive and is continually updated with new content and data (I will update the candlestick results every year). You should read this article from start to finish if you’re a beginner. If you’re an experienced trader, feel free to jump to exactly what you’re looking for:
Let me know in the comments below if you enjoy this article or have any suggestions for improvement. You can also run your own analysis, as I’ve listed the summary backtest results on GitHub.
What Are Candlestick Charts?
Candlestick charts are a technical analysis tool traders use to understand past market moves to profit from future price action.
Our human brains are notoriously bad at understanding large data sets, but more on that shortly.
Candlestick charts are aptly named because when the price is grouped into periods, such as a day or an hour, it forms a candle shape, which we’ll see in a second.
Each period has an opening price (first price), a high (highest price), a low (lowest price), and a closing price (last price), as seen in the image below.
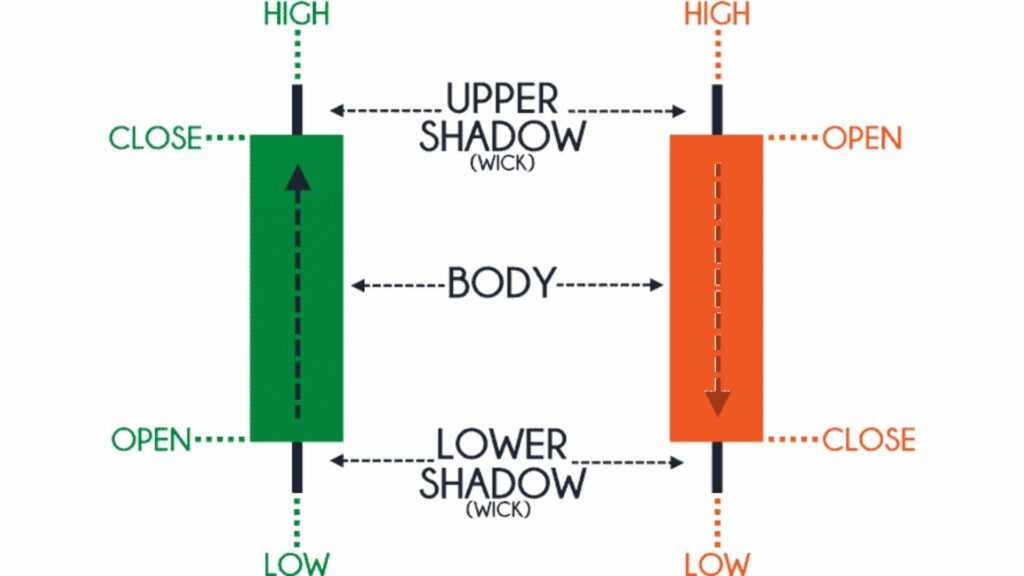
Green candles are bullish, meaning that the price closed higher than the open. Red candles are bearish, where the price closed lower than where it started. The real body groups all of the price action between the open and the close. The wicks, also known as the shadows, show the price action above and below the real body price action.
You can color your candlestick charts however you want, but green/white are the most common colors for bullish, while red/black are typical bearish colors.
Why are candlesticks called bullish and bearish?
The terms come from how bulls and bears fight their enemies. Bullish thrust their horns in the air while a bear strikes their prey in a downward motion.

Why Are Candlestick Charts Important?
Prices move due to supply and demand. Supply and demand move based on fundamentals and human emotion. Understanding how prices moved in the past gives traders an insight into how prices will likely move in the future.
Traders who can read price action and shift the probabilities in their favor can make millions in the markets.
The problem is that, unlike computers, humans are terrible at digesting large datasets.
Take a look at Apple’s minute prices for the first hour of trading on December 31st, 2021.

There are 390 minutes in a standard stock market trading day and much more in other markets. Imagine trying to decipher prices for 390 minutes each day, let alone for a week or a month of data.
Candlesticks help tease out the important prices for that period and help us visualize it.
You can turn any duration into a period. All you need to know is the OHLC values, which are the shorthand for open, high, low, and close prices.
Notice the Microsoft candlestick charts below:

The chart on the left shows the daily price action for Microsoft, while the prices on the right are hourly bars. You can use any period you would like, even 90 minutes or 45-minutes, but the most common are:
- Weekly
- Daily
- Hourly
- 15-minute
- 5-minute
- 1-minute
Henceforth, we’ll use the daily period for all of our candlestick charts.
What Are Candlestick Patterns?
Candlestick patterns are a technical trading tool used for centuries to help predict price moments. Each candlestick pattern has a distinct name and a traditional trading strategy.
A picture is worth a thousand words, so let’s use a few to shine a light on candlesticks.
Let’s look at a single candle pattern named the bullish closing marubozu.

A candlestick must meet the following to be a valid bullish closing marubozu:
- A long white body.
- A close price very close to the high. (A tiny upper shadow)
While we might not have the 390-minute data points and know the exact path price took, we understand that price moved lower than the open and then reversed and went bullish in a big way closing near the high.
The bullish closing marubozu is said to lead to further bull action, but data-driven traders understand that profit-taking in the near term is the likely result of this pattern.
Don’t worry, I’ll show you the optimal strategy for every pattern in the future. For now, let’s practice identifying a more complex, three-bar pattern.

The three white soldiers is a three-bar pattern. It’s said the three white soldiers are three white knights fighting against the darkness. Do you think they’ll prevail? We’ll discuss that shortly, for now, let’s understand that three white soldiers occur in a downtrend and requires the following:
- Three bullish medium to large candlesticks with consecutively higher closes of relatively similar size.
- Each candle must open within or near the previous candle’s real body and close at or near the high of the day.
A downtrend is a series of lower highs and lows. Determining if the candlestick pattern appears in a downtrend is a mix of art and science.
To keep things simple, we’ll use the 50-day moving average as our guide. If the price is above the 50-day simple moving average, it’s in an uptrend; otherwise, the price is in a downtrend.
What do you think is most likely to happen with three consecutive bullish days in a downtrend? And even if you knew the likely direction, how would you go about trading it? That’s what’s up next.
How to Trade Candlestick Patterns
We’re going to keep it simple and not talk about support and resistance areas, volume, or any other technical analysis tools used in conjunction with candlestick patterns. The goal is to isolate the best candlestick patterns and teach you how to trade them according to the data.
To become a candlestick samurai, you need to understand three elements:
- What we can trade: possible setups
- What we should trade: highest edge
- How much to trade: optimal sizing
Let’s start off with what to trade in the context of candlestick patterns.
What We Can Trade: Bull, Bear & Fish?
Prices can go up, down, or move sideways. That’s it. When in the context of a trend, the price movements can either continue the trend or reverse it.
This leads us to the following potential trade setups:
- Bullish Continuation – Bull move in an uptrend
- Bearish Continuation – Bearish move in a downtrend
- Bullish Reversal – Bull move in a downtrend
- Bearish Reversal – Bearish move in an uptrend
- Bullish Mean Reversion – Going bullish in sideways action
- Bearish Mean Reversion – Going bearish in sideways action
This gives us six potential pattern classifications. Understanding this is essential so let’s make this concrete with examples.
Bullish Continuation

The upside tasuki gap is a three-bar pattern. It’s considered a bullish continuation as it occurs in an uptrend, and the price is expected to continue upward after pattern identification.
We’ll learn a better way to trade this pattern than what’s traditionally taught, but for now, just understand a bullish continuation pattern expects the bullish trend to continue.
Bearish Continuation

The downside tasuki gap is the mirror opposite of the upside tasuki gap. It occurs in a downtrend, and traditional traders expect prices to fall after this pattern forms.
With the bullish and bearish continuation patterns under our belt, let’s look at reversing the trend.
Bullish Reversal
Let’s use our charting software to get us more comfortable with these candlestick patterns.

We see that the last close of the three white soldiers is below the 50-day simple moving average, giving us a downtrend. The price moves up and to the right after pattern identification, leading to a profitable bullish reversal trade.
Bearish Reversal

The three black crow’s last close is above the 50-day moving average, giving us a bullish trend. The three black crows is a bearish reversal, meaning traders expect prices to reverse the bullish trend and move downward.
Easy enough, right?
Continuations continue the trend, and reversals reverse it. Traders expect bullish patterns to move upward and bearish patterns to push prices downward.
Now let’s cover sideways price action.
Bullish Mean Reversion
Some patterns don’t lead to bullish or bearish action but to sideways volatility. We can profit from this volatility by using mean reversion strategies.
Here are the steps in a bullish mean reversion trade:
- Identify the pattern
- Wait for the pattern to cross below the pattern’s low.
- Go long if the price moves above the pattern low within a confirmation period, typically three bars.
- Set a stop loss using a volatility measure, such as the average true range (ATR).

We see the three white soldier’s forms on the PhenixFin February 27th, 2018, daily chart. A mean reversion trader waits for the price to move below and back above the low that occurred on the first three white soldier’s candlestick. This occurs on the third day after pattern formation and leads to a profitable trade.
The bearish version is exactly the same in the opposite direction.
Bearish Mean Reversion

We saw the three black crows on the daily chart for Avis on July 19th, 2004. Bearish mean reversion traders expect prices to resolve to the downside. These traders wait for prices to move up above and back below the three black crow pattern high, setting a stop loss of one ATR. We see this happen the day after pattern formation. Prices move higher but never reach the stop loss and move heavily toward the downside for a large bearish gain.
You must understand the six possible trading setups to trade candlestick patterns optimally. Reread this section if you don’t.
What We Should Trade: Understanding Edge
An edge occurs when your expected payout is greater than the money you put in.
Let’s think about an American roulette wheel at a casino.
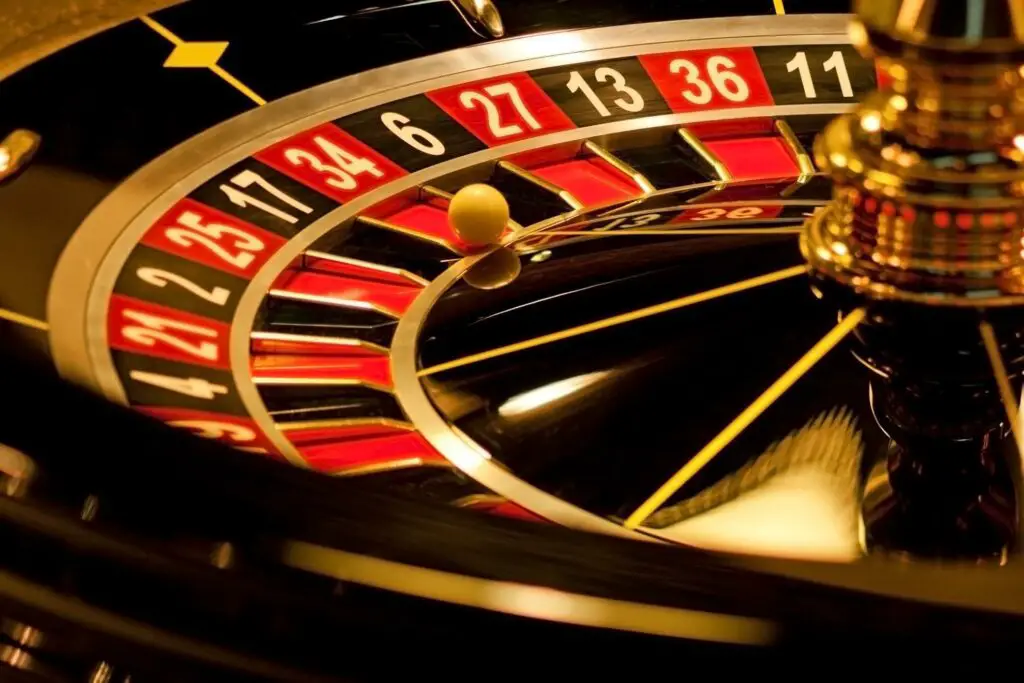
There are eighteen red, eighteen black, and two green spaces. If you bet red, you’ll have a 47% chance to win. The casino owns the other side of the bet with a 53% chance. The difference between the odds is a positive edge for the casino and a negative edge for you.
Sure, the casino will lose sometimes, but over time that positive edge will add up, and they’ll take your money.
In other words, be the casino.
Never make a bet without an edge. You will lose. You will lose often. But if you have a positive edge, you will make money.
Now that we understand what an edge is and why it’s essential, let’s learn optimal bet sizing.
How Much To Trade: Optimal Sizing
When we make a bet, we will do it in terms of risk. We will always set a stop loss. The risk is how much we’ll lose if our stop loss is hit.
If a stock is $100 and we place our stop loss at $90, we’ll be risking $10. Those of you who are more advanced or quantitative can argue with this measure of risk — rightfully so, but for now, it’ll do.
If we take a profit at $110, we’ll be risking $10 to make $10. This is fine if we’re like the casino exploiting its roulette wheel edge above and have a greater than 50% win rate.
When we risk $10 to make $10, we have a 1:1 risk-reward ratio. If we risk $10 to make $20, we’ll have a 1:2 risk-reward ratio.
If we have a 1:2 risk-reward ratio, our win percentage can go down and still be profitable since we make twice as much as we risk. To be precise, if we win greater than 33% of the time with a 1:2 risk-reward ratio, we’ll end up in the money. One win out of three total bets gets us to break even.
Here’s the formula for those interested:
- Expectancy = Average Win * WinPercent – AverageLoss * LossPercent
- .1 = $20 * X – $10 * (1-X)
So how do we determine the optimal risk-reward ratio systematically?
You can code up an algorithm to test every pattern in multiple markets using every setup we discussed earlier with various entry and exit points and iterate through each risk-reward ratio to determine the optimal setup — or you can just use the table below because I’ve done all the heavy lifting for you.
The Best Candlestick Patterns
As you’ll soon find out, different candlestick patterns work in different markets. This is because each market has its own personality. Take a look at the historical performance of the stock market vs. the commodity market.

The stock market has an upward bias that data-driven traders exploit.
A trading “guru” that tells you the best candlestick patterns to trade without providing a market is either uneducated or worse.
But again, I will solve all of this for you and make the data public.
Additionally, some of the candlestick patterns occur infrequently, leading to statistically insignificant returns. And as mentioned previously, good traders don’t trade without a well-defined statistical edge.
So instead, feel free to use the interactive table below to analyze what patterns work best for the market you’re trading.
Here are the three steps you’ll want to take to determine the best setups for your market:
- Select the market you trade.
- Select the required trend. It’s an uptrend if the market is above the 50-day moving average.
- Select the minimum number of traders desired. I suggest 100+
Each row contains the optimum trading strategy, risk-reward, and set up for the pattern. You can click on each row to review the details.
| Id | Market | Required Trend | Pattern | Pattern Bars | Traditional Strategy | Strategy | RR | Setup | Tickers | Signals | Trades | Trade Bars | Edge | Edge Per Bar | Confirm % | Win % | Cons Wins | Cons Losses | Avg. Trade Bars | Avg. Win Bars | Avg. Loss Bars | Details |
|---|---|---|---|---|---|---|---|---|---|---|---|---|---|---|---|---|---|---|---|---|---|---|
| 7,375 | stock | downtrend | unique_three_river_bottom | 3 | bullish reversal | bullish mean reversion | 5 | atr-pattern_low | 2,778 | 10,193 | 3,980 | 65,378 | 0.39 | 0.13 | 0.39 | 0.23 | 4 | 6 | 16.43 | 31.69 | 11.82 | https://analyzingalpha.com/unique-three-river-bottom-candlestick-pattern |
| 7,380 | crypto | uptrend | bearish_harami | 2 | bearish reversal | bullish mean reversion | 5 | atr-pattern_low | 206 | 1,964 | 706 | 11,829 | 0.67 | 0.34 | 0.36 | 0.28 | 4 | 9 | 16.75 | 23.87 | 14.02 | https://analyzingalpha.com/bearish-harami-candlestick-pattern |
| 7,390 | stock | uptrend | bearish_harami | 2 | bearish reversal | bullish mean reversion | 5 | atr-pattern_low | 5,382 | 247,256 | 98,125 | 1,596,838 | 0.40 | 0.20 | 0.40 | 0.23 | 5 | 27 | 16.27 | 30.56 | 11.94 | https://analyzingalpha.com/bearish-harami-candlestick-pattern |
| 7,420 | forex | none | long_legged_doji | 1 | indecision | bearish | 5 | high-close | 1,220 | 336,852 | 318,685 | 1,344,783 | 0.39 | 0.39 | 0.95 | 0.23 | 1,619 | 50 | 4.22 | 6.28 | 3.60 | https://analyzingalpha.com/long-legged-doji-candlestick-pattern |
| 7,435 | crypto | downtrend | down_gap_side_by_side | 3 | bearish continuation | bullish reversal | 5 | low-close | 11 | 26 | 25 | 58 | 1.88 | 0.63 | 0.96 | 0.48 | 2 | 2 | 2.32 | 2.58 | 2.08 | https://analyzingalpha.com/down-gap-side-by-side-candlestick-pattern |
| 7,440 | forex | downtrend | down_gap_side_by_side | 3 | bearish continuation | bullish reversal | 5 | low-close | 200 | 751 | 698 | 4,237 | 1.09 | 0.36 | 0.93 | 0.35 | 6 | 9 | 6.07 | 2.10 | 8.18 | https://analyzingalpha.com/down-gap-side-by-side-candlestick-pattern |
| 7,465 | crypto | uptrend | dark_cloud_cover | 2 | bearish reversal | bearish reversal | 5 | high-low | 1 | 2 | 2 | 49 | 2.00 | 1.00 | 1.00 | 0.50 | 1 | 0 | 24.50 | 44.00 | 5.00 | https://analyzingalpha.com/dark-cloud-cover-candlestick-pattern |
| 7,480 | crypto | downtrend | matching_low | 2 | bullish reversal | bullish reversal | 5 | low-close | 236 | 4,265 | 4,054 | 13,786 | 1.06 | 0.53 | 0.95 | 0.34 | 8 | 20 | 3.40 | 4.19 | 2.99 | https://analyzingalpha.com/matching-low-candlestick-pattern |
| 7,485 | forex | downtrend | matching_low | 2 | bullish reversal | bullish reversal | 5 | low-close | 1,193 | 59,071 | 57,532 | 188,912 | 0.80 | 0.40 | 0.97 | 0.30 | 106 | 131 | 3.28 | 3.58 | 3.16 | https://analyzingalpha.com/matching-low-candlestick-pattern |
| 7,490 | stock | downtrend | matching_low | 2 | bullish reversal | bullish reversal | 5 | low-close | 5,670 | 154,436 | 142,463 | 458,668 | 0.45 | 0.22 | 0.92 | 0.24 | 8 | 32 | 3.22 | 5.07 | 2.63 | https://analyzingalpha.com/matching-low-candlestick-pattern |
| 7,510 | crypto | none | rickshaw_man | 1 | indecision | bullish | 5 | atr-pattern_low | 251 | 10,966 | 6,666 | 71,786 | 0.39 | 0.39 | 0.61 | 0.23 | 2 | 19 | 10.77 | 18.07 | 8.57 | https://analyzingalpha.com/rickshaw-man-candlestick-pattern |
| 7,520 | stock | none | rickshaw_man | 1 | indecision | bullish | 5 | atr-pattern_low | 6,025 | 814,858 | 482,729 | 4,949,451 | 0.34 | 0.34 | 0.59 | 0.22 | 4 | 25 | 10.25 | 19.27 | 7.65 | https://analyzingalpha.com/rickshaw-man-candlestick-pattern |
| 7,608 | forex | uptrend | evening_doji_star | 3 | bearish reversal | bearish mean reversion | 3 | atr-pattern_high | 297 | 890 | 160 | 2,808 | 0.48 | 0.16 | 0.18 | 0.37 | 2 | 3 | 17.55 | 26.12 | 12.54 | https://analyzingalpha.com/evening-doji-star-candlestick-pattern |
| 7,680 | stock | downtrend | stick_sandwich | 3 | bullish reversal | bearish continuation | 5 | high-close | 3,042 | 12,308 | 12,111 | 51,432 | 1.38 | 0.46 | 0.98 | 0.40 | 8 | 10 | 4.25 | 4.26 | 4.24 | https://analyzingalpha.com/stick-sandwich-candlestick-pattern |
| 7,707 | forex | uptrend | bullish_separating_lines | 2 | bullish continuation | bearish mean reversion | 2 | atr-pattern_high | 913 | 7,008 | 4,102 | 63,136 | 0.34 | 0.17 | 0.59 | 0.45 | 21 | 10 | 15.39 | 17.06 | 14.06 | https://analyzingalpha.com/bullish-separating-lines-candlestick-pattern |
| 7,777 | stock | none | bearish_kicking | 2 | bearish | bearish | 2 | atr-pattern_high | 176 | 508 | 74 | 719 | 0.54 | 0.27 | 0.15 | 0.51 | 2 | 2 | 9.72 | 10.29 | 9.11 | https://analyzingalpha.com/bearish-kicking-candlestick-pattern |
| 7,795 | stock | downtrend | homing_pigeon | 2 | bullish reversal | bullish mean reversion | 5 | atr-pattern_low | 5,103 | 94,059 | 47,602 | 845,411 | 0.44 | 0.22 | 0.51 | 0.24 | 5 | 20 | 17.76 | 33.41 | 12.84 | https://analyzingalpha.com/homing-pigeon-candlestick-pattern |
| 7,960 | stock | downtrend | thrusting | 2 | bearish continuation | bullish mean reversion | 5 | atr-pattern_low | 4,471 | 50,017 | 20,602 | 416,671 | 0.38 | 0.19 | 0.41 | 0.23 | 5 | 14 | 20.22 | 38.19 | 14.88 | https://analyzingalpha.com/thrusting-candlestick-pattern |
| 8,025 | crypto | none | bullish_short_line | 1 | indecision | bearish | 5 | high-close | 257 | 28,755 | 24,447 | 40,962 | 0.79 | 0.79 | 0.85 | 0.30 | 82 | 43 | 1.68 | 1.86 | 1.60 | https://analyzingalpha.com/bullish-short-line-candlestick-pattern |
| 8,030 | forex | none | bullish_short_line | 1 | indecision | bearish | 5 | high-close | 1,276 | 619,384 | 557,225 | 643,027 | 0.93 | 0.93 | 0.90 | 0.32 | 498 | 52 | 1.15 | 1.21 | 1.13 | https://analyzingalpha.com/bullish-short-line-candlestick-pattern |
| 8,035 | stock | none | bullish_short_line | 1 | indecision | bearish | 5 | high-close | 6,574 | 1,275,995 | 1,106,449 | 1,771,269 | 0.56 | 0.56 | 0.87 | 0.26 | 401 | 70 | 1.60 | 2.07 | 1.43 | https://analyzingalpha.com/bullish-short-line-candlestick-pattern |
| 8,040 | crypto | none | bullish_closing_marubozu | 1 | bullish | bearish | 5 | high-close | 239 | 17,905 | 16,707 | 18,631 | 1.26 | 1.26 | 0.93 | 0.38 | 177 | 46 | 1.12 | 1.15 | 1.09 | https://analyzingalpha.com/bullish-closing-marubozu-candlestick-pattern |
| 8,045 | forex | none | bullish_closing_marubozu | 1 | bullish | bearish | 5 | high-close | 1,284 | 328,958 | 283,662 | 323,116 | 1.86 | 1.86 | 0.86 | 0.48 | 593 | 67 | 1.14 | 1.14 | 1.14 | https://analyzingalpha.com/bullish-closing-marubozu-candlestick-pattern |
| 8,050 | stock | none | bullish_closing_marubozu | 1 | bullish | bearish | 5 | high-close | 6,448 | 1,217,570 | 1,116,973 | 1,340,142 | 0.68 | 0.68 | 0.92 | 0.28 | 382 | 49 | 1.20 | 1.38 | 1.13 | https://analyzingalpha.com/bullish-closing-marubozu-candlestick-pattern |
| 8,067 | forex | downtrend | morning_doji_star | 3 | bullish reversal | bullish mean reversion | 2 | atr-pattern_low | 221 | 589 | 115 | 1,186 | 0.33 | 0.11 | 0.20 | 0.44 | 2 | 2 | 10.31 | 10.98 | 9.78 | https://analyzingalpha.com/morning-doji-star-candlestick-pattern |
| 8,075 | stock | downtrend | morning_doji_star | 3 | bullish reversal | bullish mean reversion | 5 | atr-pattern_low | 2,904 | 11,167 | 2,349 | 41,474 | 0.40 | 0.13 | 0.21 | 0.23 | 3 | 6 | 17.66 | 34.77 | 12.46 | https://analyzingalpha.com/morning-doji-star-candlestick-pattern |
| 8,132 | forex | uptrend | up_gap_side_by_side | 3 | bullish continuation | bearish mean reversion | 2 | atr-pattern_high | 515 | 2,211 | 1,218 | 16,310 | 0.41 | 0.14 | 0.55 | 0.47 | 11 | 7 | 13.39 | 14.11 | 12.75 | https://analyzingalpha.com/up-gap-side-by-side-candlestick-pattern |
| 8,207 | forex | downtrend | downside_gap_three_methods | 3 | bearish continuation | bearish mean reversion | 2 | atr-pattern_high | 454 | 2,189 | 828 | 8,399 | 0.28 | 0.09 | 0.38 | 0.43 | 5 | 3 | 10.14 | 11.41 | 9.20 | https://analyzingalpha.com/downside-gap-three-methods-candlestick-pattern |
| 8,280 | crypto | uptrend | three_outside_down | 3 | bearish reversal | bullish mean reversion | 5 | atr-pattern_low | 142 | 841 | 455 | 7,045 | 0.33 | 0.11 | 0.54 | 0.22 | 2 | 7 | 15.48 | 20.44 | 14.07 | https://analyzingalpha.com/three-outside-down-candlestick-pattern |
| 8,290 | stock | uptrend | three_outside_down | 3 | bearish reversal | bullish mean reversion | 5 | atr-pattern_low | 4,709 | 101,187 | 60,577 | 979,791 | 0.40 | 0.13 | 0.60 | 0.23 | 7 | 22 | 16.17 | 29.48 | 12.12 | https://analyzingalpha.com/three-outside-down-candlestick-pattern |
| 8,295 | crypto | uptrend | upside_gap_three_methods | 3 | bullish continuation | bullish mean reversion | 5 | atr-pattern_low | 78 | 256 | 112 | 1,518 | 0.45 | 0.15 | 0.44 | 0.24 | 2 | 4 | 13.55 | 22.15 | 10.82 | https://analyzingalpha.com/upside-gap-three-methods-candlestick-pattern |
| 8,305 | stock | uptrend | upside_gap_three_methods | 3 | bullish continuation | bullish mean reversion | 5 | atr-pattern_low | 3,320 | 23,240 | 10,673 | 180,695 | 0.40 | 0.13 | 0.46 | 0.23 | 4 | 11 | 16.93 | 31.88 | 12.38 | https://analyzingalpha.com/upside-gap-three-methods-candlestick-pattern |
| 8,327 | forex | uptrend | evening_star | 3 | bearish reversal | bearish mean reversion | 2 | atr-pattern_high | 544 | 2,766 | 431 | 3,720 | 0.40 | 0.13 | 0.16 | 0.47 | 4 | 3 | 8.63 | 10.72 | 6.81 | https://analyzingalpha.com/evening-star-candlestick-pattern |
| 8,410 | crypto | downtrend | hammer | 1 | bullish reversal | bearish continuation | 5 | high-close | 238 | 4,411 | 4,217 | 8,236 | 0.55 | 0.55 | 0.96 | 0.26 | 17 | 22 | 1.95 | 2.50 | 1.76 | https://analyzingalpha.com/hammer-candlestick-pattern |
| 8,415 | forex | downtrend | hammer | 1 | bullish reversal | bearish continuation | 5 | high-close | 1,193 | 64,778 | 61,780 | 100,056 | 0.23 | 0.23 | 0.95 | 0.21 | 73 | 81 | 1.62 | 2.30 | 1.44 | https://analyzingalpha.com/hammer-candlestick-pattern |
| 8,420 | stock | downtrend | hammer | 1 | bullish reversal | bearish continuation | 5 | high-close | 5,886 | 208,980 | 190,149 | 389,372 | 0.44 | 0.44 | 0.91 | 0.24 | 63 | 37 | 2.05 | 2.89 | 1.78 | https://analyzingalpha.com/hammer-candlestick-pattern |
| 8,430 | stock | downtrend | on_neck | 2 | bearish continuation | bullish mean reversion | 5 | atr-pattern_low | 3,699 | 21,789 | 10,912 | 180,912 | 0.36 | 0.18 | 0.50 | 0.23 | 5 | 9 | 16.58 | 31.52 | 12.23 | https://analyzingalpha.com/on-neck-candlestick-pattern |
| 8,495 | crypto | uptrend | bearish_harami_cross | 2 | bearish reversal | bullish mean reversion | 5 | atr-pattern_low | 130 | 621 | 215 | 4,189 | 0.73 | 0.37 | 0.35 | 0.29 | 3 | 5 | 19.48 | 23.87 | 17.71 | https://analyzingalpha.com/bearish-harami-cross-candlestick-pattern |
| 8,505 | stock | uptrend | bearish_harami_cross | 2 | bearish reversal | bullish mean reversion | 5 | atr-pattern_low | 4,784 | 99,585 | 37,470 | 556,322 | 0.40 | 0.20 | 0.38 | 0.23 | 4 | 18 | 14.85 | 27.92 | 10.85 | https://analyzingalpha.com/bearish-harami-cross-candlestick-pattern |
| 8,520 | forex | none | doji | 1 | indecision | bearish | 5 | high-close | 1,285 | 733,323 | 635,089 | 1,656,767 | 0.91 | 0.91 | 0.87 | 0.32 | 668 | 51 | 2.61 | 2.91 | 2.47 | https://analyzingalpha.com/doji-candlestick-pattern |
| 8,530 | crypto | none | bearish_closing_marubozu | 1 | bearish | bullish | 5 | low-close | 247 | 19,255 | 17,814 | 20,775 | 1.26 | 1.26 | 0.93 | 0.38 | 16 | 62 | 1.17 | 1.22 | 1.13 | https://analyzingalpha.com/bearish-closing-marubozu-candlestick-pattern |
| 8,535 | forex | none | bearish_closing_marubozu | 1 | bearish | bullish | 5 | low-close | 1,279 | 333,203 | 288,313 | 320,640 | 2.01 | 2.01 | 0.87 | 0.50 | 88 | 43 | 1.11 | 1.08 | 1.14 | https://analyzingalpha.com/bearish-closing-marubozu-candlestick-pattern |
| 8,540 | stock | none | bearish_closing_marubozu | 1 | bearish | bullish | 5 | low-close | 6,434 | 1,140,569 | 1,056,137 | 1,228,935 | 0.64 | 0.64 | 0.93 | 0.27 | 10 | 30 | 1.16 | 1.29 | 1.11 | https://analyzingalpha.com/bearish-closing-marubozu-candlestick-pattern |
| 8,560 | crypto | uptrend | bearish_counterattack | 2 | bearish reversal | bullish mean reversion | 5 | atr-pattern_low | 7 | 18 | 10 | 143 | 0.80 | 0.40 | 0.56 | 0.30 | 1 | 4 | 14.30 | 33.00 | 6.29 | https://analyzingalpha.com/bearish-counterattack-candlestick-pattern |
| 8,595 | forex | downtrend | bullish_tri_star | 3 | bullish reversal | bearish continuation | 5 | high-close | 67 | 230 | 221 | 1,531 | 0.46 | 0.15 | 0.96 | 0.24 | 12 | 16 | 6.93 | 7.61 | 6.71 | https://analyzingalpha.com/bullish-tri-star-candlestick-pattern |
| 8,620 | crypto | none | gravestone_doji | 1 | indecision | bullish | 5 | low-close | 242 | 7,943 | 7,599 | 9,384 | 1.06 | 1.06 | 0.96 | 0.34 | 11 | 24 | 1.23 | 1.26 | 1.22 | https://analyzingalpha.com/gravestone-doji-candlestick-pattern |
| 8,625 | forex | none | gravestone_doji | 1 | indecision | bullish | 5 | low-close | 1,190 | 88,914 | 83,987 | 105,840 | 1.62 | 1.62 | 0.94 | 0.44 | 177 | 44 | 1.26 | 1.16 | 1.34 | https://analyzingalpha.com/gravestone-doji-candlestick-pattern |
| 8,630 | stock | none | gravestone_doji | 1 | indecision | bullish | 5 | low-close | 6,104 | 336,640 | 311,916 | 395,573 | 0.75 | 0.75 | 0.93 | 0.29 | 14 | 35 | 1.27 | 1.42 | 1.21 | https://analyzingalpha.com/gravestone-doji-candlestick-pattern |
| 8,710 | crypto | uptrend | upside_tasuki_gap | 3 | bullish continuation | bullish mean reversion | 5 | atr-pattern_low | 4 | 8 | 4 | 59 | 2.00 | 0.67 | 0.50 | 0.50 | 1 | 1 | 14.75 | 23.00 | 6.50 | https://analyzingalpha.com/upside-tasuki-gap-candlestick-pattern |
| 8,720 | stock | uptrend | upside_tasuki_gap | 3 | bullish continuation | bullish mean reversion | 5 | atr-pattern_low | 3,065 | 18,861 | 6,871 | 106,473 | 0.44 | 0.15 | 0.36 | 0.24 | 4 | 8 | 15.50 | 30.62 | 10.75 | https://analyzingalpha.com/upside-tasuki-gap-candlestick-pattern |
| 8,722 | forex | uptrend | bearish_breakaway | 5 | bearish reversal | bearish reversal | 2 | high-low | 1 | 2 | 1 | 1 | 2.00 | 0.40 | 0.50 | 1.00 | 1 | 0 | 1.00 | 1.00 | https://analyzingalpha.com/bearish-breakaway-candlestick-pattern | |
| 8,734 | crypto | uptrend | advance_block | 3 | bearish reversal | bullish mean reversion | 4 | atr-pattern_low | 178 | 1,094 | 144 | 2,691 | 0.66 | 0.22 | 0.13 | 0.33 | 2 | 2 | 18.69 | 27.27 | 14.40 | https://analyzingalpha.com/advance-block-candlestick-pattern |
| 8,745 | stock | uptrend | advance_block | 3 | bearish reversal | bullish mean reversion | 5 | atr-pattern_low | 4,086 | 58,824 | 6,135 | 87,596 | 0.44 | 0.15 | 0.10 | 0.24 | 4 | 8 | 14.28 | 26.01 | 10.60 | https://analyzingalpha.com/advance-block-candlestick-pattern |
| 8,808 | forex | uptrend | bullish_three_line_strike | 4 | bullish continuation | bearish mean reversion | 3 | atr-pattern_high | 471 | 2,106 | 454 | 5,517 | 0.32 | 0.08 | 0.22 | 0.33 | 3 | 4 | 12.15 | 14.72 | 10.88 | https://analyzingalpha.com/bullish-three-line-strike-candlestick-pattern |
| 8,855 | forex | uptrend | stalled | 3 | bearish reversal | bearish reversal | 5 | high-close | 961 | 7,303 | 5,836 | 14,504 | 1.80 | 0.60 | 0.80 | 0.47 | 24 | 11 | 2.49 | 2.13 | 2.80 | https://analyzingalpha.com/stalled-candlestick-pattern |
| 8,867 | forex | none | bearish_spinning_top | 1 | indecision | bearish | 2 | atr-pattern_high | 1,087 | 178,187 | 94,110 | 849,993 | 0.20 | 0.20 | 0.53 | 0.40 | 98 | 16 | 9.03 | 10.67 | 7.93 | https://analyzingalpha.com/bearish-spinning-top-candlestick-pattern |
| 8,910 | forex | downtrend | on_neck | 2 | bearish continuation | bearish continuation | 5 | high-low | 3 | 6 | 3 | 93 | 3.01 | 1.50 | 0.50 | 0.67 | 1 | 1 | 31.00 | 39.00 | 15.00 | https://analyzingalpha.com/on-neck-candlestick-pattern |
| 8,945 | stock | none | long_legged_doji | 1 | indecision | bullish | 5 | atr-pattern_low | 6,472 | 1,031,959 | 587,487 | 6,887,151 | 0.34 | 0.34 | 0.57 | 0.22 | 5 | 34 | 11.72 | 22.53 | 8.62 | https://analyzingalpha.com/long-legged-doji-candlestick-pattern |
| 8,980 | crypto | none | bearish_spinning_top | 1 | indecision | bullish | 5 | atr-pattern_low | 250 | 9,589 | 5,411 | 93,389 | 0.49 | 0.49 | 0.56 | 0.25 | 4 | 19 | 17.26 | 30.45 | 12.94 | https://analyzingalpha.com/bearish-spinning-top-candlestick-pattern |
| 8,990 | stock | none | bearish_spinning_top | 1 | indecision | bullish | 5 | atr-pattern_low | 5,895 | 703,725 | 410,370 | 6,071,340 | 0.37 | 0.37 | 0.58 | 0.23 | 4 | 24 | 14.79 | 28.40 | 10.77 | https://analyzingalpha.com/bearish-spinning-top-candlestick-pattern |
| 9,008 | forex | downtrend | thrusting | 2 | bearish continuation | bearish mean reversion | 3 | atr-pattern_high | 57 | 142 | 22 | 362 | 0.83 | 0.41 | 0.15 | 0.46 | 1 | 1 | 16.45 | 13.40 | 19.00 | https://analyzingalpha.com/thrusting-candlestick-pattern |
| 9,053 | forex | none | bullish_spinning_top | 1 | indecision | bearish | 3 | atr-pattern_high | 1,126 | 162,136 | 95,099 | 1,275,338 | 0.23 | 0.23 | 0.59 | 0.31 | 101 | 31 | 13.41 | 18.86 | 11.01 | https://analyzingalpha.com/bullish-spinning-top-candlestick-pattern |
| 9,065 | crypto | uptrend | stalled | 3 | bearish reversal | bullish continuation | 5 | low-close | 77 | 228 | 210 | 1,292 | 0.49 | 0.16 | 0.92 | 0.25 | 2 | 8 | 6.15 | 11.06 | 4.54 | https://analyzingalpha.com/stalled-candlestick-pattern |
| 9,090 | stock | downtrend | concealing_baby_swallow | 4 | bullish reversal | bullish reversal | 5 | low-close | 4 | 8 | 8 | 11 | 0.50 | 0.13 | 1.00 | 0.25 | 2 | 2 | 1.38 | 1.00 | 1.50 | https://analyzingalpha.com/concealing-baby-swallow-candlestick-pattern |
| 9,130 | stock | downtrend | piercing | 2 | bullish reversal | bullish mean reversion | 5 | atr-pattern_low | 3,541 | 21,214 | 6,765 | 153,566 | 0.43 | 0.22 | 0.32 | 0.24 | 3 | 8 | 22.70 | 43.48 | 16.23 | https://analyzingalpha.com/piercing-candlestick-pattern |
| 9,135 | crypto | uptrend | bearish_engulfing | 2 | bearish reversal | bullish mean reversion | 5 | atr-pattern_low | 211 | 1,982 | 1,189 | 19,861 | 0.58 | 0.29 | 0.60 | 0.26 | 3 | 17 | 16.70 | 23.64 | 14.23 | https://analyzingalpha.com/bearish-engulfing-candlestick-pattern |
| 9,145 | stock | uptrend | bearish_engulfing | 2 | bearish reversal | bullish mean reversion | 5 | atr-pattern_low | 5,246 | 214,991 | 134,351 | 2,317,605 | 0.38 | 0.19 | 0.62 | 0.23 | 5 | 32 | 17.25 | 32.38 | 12.75 | https://analyzingalpha.com/bearish-engulfing-candlestick-pattern |
| 9,164 | crypto | downtrend | downside_tasuki_gap | 3 | bearish continuation | bearish continuation | 4 | high-low | 3 | 6 | 1 | 50 | 4.00 | 1.33 | 0.17 | 1.00 | 1 | 0 | 50.00 | 50.00 | https://analyzingalpha.com/downside-tasuki-gap-candlestick-pattern | |
| 9,195 | crypto | uptrend | bullish_harami_cross | 2 | bullish reversal | bullish mean reversion | 5 | atr-pattern_low | 168 | 860 | 423 | 8,749 | 0.31 | 0.15 | 0.49 | 0.22 | 2 | 7 | 20.68 | 46.32 | 13.56 | https://analyzingalpha.com/bullish-harami-cross-candlestick-pattern |
| 9,205 | stock | uptrend | bullish_harami_cross | 2 | bullish reversal | bullish mean reversion | 5 | atr-pattern_low | 5,305 | 102,763 | 49,179 | 811,760 | 0.42 | 0.21 | 0.48 | 0.24 | 5 | 23 | 16.51 | 31.22 | 12.00 | https://analyzingalpha.com/bullish-harami-cross-candlestick-pattern |
| 9,270 | crypto | uptrend | evening_star | 3 | bearish reversal | bullish mean reversion | 5 | atr-pattern_low | 68 | 185 | 80 | 1,409 | 0.66 | 0.22 | 0.43 | 0.28 | 2 | 3 | 17.61 | 30.32 | 12.79 | https://analyzingalpha.com/evening-star-candlestick-pattern |
| 9,280 | stock | uptrend | evening_star | 3 | bearish reversal | bullish mean reversion | 5 | atr-pattern_low | 3,972 | 37,082 | 20,155 | 366,216 | 0.39 | 0.13 | 0.54 | 0.23 | 5 | 14 | 18.17 | 33.40 | 13.57 | https://analyzingalpha.com/evening-star-candlestick-pattern |
| 9,370 | stock | downtrend | three_white_soldiers | 3 | bullish reversal | bullish reversal | 5 | low-close | 436 | 926 | 788 | 51,649 | 0.45 | 0.15 | 0.85 | 0.24 | 3 | 4 | 65.54 | 135.06 | 43.30 | https://analyzingalpha.com/three-white-soldiers-candlestick-pattern |
| 9,410 | crypto | downtrend | falling_three_methods | 5 | bearish continuation | bullish mean reversion | 5 | atr-pattern_low | 4 | 8 | 3 | 346 | 1.00 | 0.20 | 0.38 | 0.33 | 1 | 1 | 115.33 | 334.00 | 6.00 | https://analyzingalpha.com/falling-three-methods-candlestick-pattern |
| 9,413 | forex | downtrend | falling_three_methods | 5 | bearish continuation | bullish mean reversion | 3 | atr-pattern_low | 83 | 184 | 130 | 1,322 | 0.51 | 0.10 | 0.71 | 0.38 | 2 | 4 | 10.17 | 16.80 | 6.16 | https://analyzingalpha.com/falling-three-methods-candlestick-pattern |
| 9,426 | forex | downtrend | bullish_engulfing | 2 | bullish reversal | bearish mean reversion | 1 | atr-pattern_high | 856 | 26,895 | 17,282 | 83,114 | 0.28 | 0.14 | 0.64 | 0.64 | 40 | 6 | 4.81 | 4.44 | 5.48 | https://analyzingalpha.com/bullish-engulfing-candlestick-pattern |
| 9,455 | stock | none | bullish_kicking | 2 | bullish | bullish | 5 | low-close | 216 | 605 | 349 | 19,398 | 0.93 | 0.46 | 0.58 | 0.32 | 4 | 4 | 55.58 | 91.92 | 38.41 | https://analyzingalpha.com/bullish-kicking-candlestick-pattern |
| 9,465 | forex | uptrend | dark_cloud_cover | 2 | bearish reversal | bullish mean reversion | 5 | atr-pattern_low | 32 | 72 | 29 | 1,113 | 0.66 | 0.33 | 0.40 | 0.28 | 1 | 2 | 38.38 | 81.25 | 22.05 | https://analyzingalpha.com/dark-cloud-cover-candlestick-pattern |
| 9,470 | stock | uptrend | dark_cloud_cover | 2 | bearish reversal | bullish mean reversion | 5 | atr-pattern_low | 3,834 | 30,976 | 16,379 | 331,221 | 0.42 | 0.21 | 0.53 | 0.24 | 6 | 13 | 20.22 | 37.90 | 14.75 | https://analyzingalpha.com/dark-cloud-cover-candlestick-pattern |
| 9,645 | forex | downtrend | three_stars_in_the_south | 3 | bullish reversal | bearish mean reversion | 5 | atr-pattern_high | 10 | 32 | 9 | 290 | 1.66 | 0.55 | 0.28 | 0.44 | 2 | 2 | 32.22 | 62.00 | 8.40 | https://analyzingalpha.com/three-stars-in-the-south-candlestick-pattern |
| 9,720 | stock | downtrend | bullish_belt_hold | 1 | bullish reversal | bullish mean reversion | 5 | atr-pattern_low | 6,466 | 372,105 | 133,186 | 3,120,788 | 0.42 | 0.42 | 0.36 | 0.24 | 6 | 36 | 23.43 | 45.02 | 16.78 | https://analyzingalpha.com/bullish-belt-hold-candlestick-pattern |
| 9,742 | forex | uptrend | bearish_engulfing | 2 | bearish reversal | bearish mean reversion | 2 | atr-pattern_high | 847 | 29,711 | 8,453 | 73,790 | 0.25 | 0.13 | 0.28 | 0.42 | 19 | 12 | 8.73 | 10.35 | 7.57 | https://analyzingalpha.com/bearish-engulfing-candlestick-pattern |
| 9,755 | crypto | uptrend | bearish_belt_hold | 1 | bearish reversal | bullish continuation | 5 | low-close | 236 | 6,157 | 5,685 | 23,969 | 0.80 | 0.80 | 0.92 | 0.30 | 4 | 17 | 4.22 | 6.09 | 3.41 | https://analyzingalpha.com/bearish-belt-hold-candlestick-pattern |
| 9,760 | forex | uptrend | bearish_belt_hold | 1 | bearish reversal | bullish continuation | 5 | low-close | 1,259 | 124,053 | 104,185 | 324,193 | 1.27 | 1.27 | 0.84 | 0.38 | 36 | 34 | 3.11 | 2.80 | 3.30 | https://analyzingalpha.com/bearish-belt-hold-candlestick-pattern |
| 9,768 | forex | downtrend | piercing | 2 | bullish reversal | bearish mean reversion | 3 | atr-pattern_high | 22 | 51 | 25 | 762 | 0.92 | 0.46 | 0.49 | 0.48 | 2 | 1 | 30.48 | 36.17 | 25.23 | https://analyzingalpha.com/piercing-candlestick-pattern |
| 9,840 | stock | downtrend | ladder_bottom | 5 | bullish reversal | bullish reversal | 5 | low-close | 2,331 | 8,433 | 7,661 | 233,093 | 0.44 | 0.09 | 0.91 | 0.24 | 4 | 9 | 30.43 | 62.41 | 20.35 | https://analyzingalpha.com/ladder-bottom-candlestick-pattern |
| 9,870 | stock | uptrend | stalled | 3 | bearish reversal | bullish mean reversion | 5 | atr-pattern_low | 3,365 | 25,999 | 2,364 | 34,515 | 0.46 | 0.15 | 0.09 | 0.24 | 2 | 6 | 14.60 | 26.92 | 10.65 | https://analyzingalpha.com/stalled-candlestick-pattern |
| 9,900 | stock | downtrend | downside_tasuki_gap | 3 | bearish continuation | bullish mean reversion | 5 | atr-pattern_low | 3,270 | 17,043 | 6,090 | 121,678 | 0.52 | 0.17 | 0.36 | 0.25 | 4 | 7 | 19.98 | 42.66 | 12.29 | https://analyzingalpha.com/downside-tasuki-gap-candlestick-pattern |
| 9,934 | forex | uptrend | three_inside_down | 3 | bearish reversal | bearish mean reversion | 4 | atr-pattern_high | 498 | 2,112 | 267 | 6,566 | 0.28 | 0.09 | 0.13 | 0.26 | 2 | 3 | 24.59 | 58.59 | 12.97 | https://analyzingalpha.com/three-inside-down-candlestick-pattern |
| 10,032 | forex | downtrend | bullish_counterattack | 2 | bullish reversal | bearish mean reversion | 2 | atr-pattern_high | 127 | 465 | 150 | 6,525 | 0.40 | 0.20 | 0.32 | 0.47 | 4 | 5 | 43.50 | 41.87 | 44.92 | https://analyzingalpha.com/bullish-counterattack-candlestick-pattern |
| 10,065 | crypto | downtrend | takuri | 1 | bullish reversal | bearish continuation | 5 | high-close | 229 | 4,206 | 4,053 | 5,180 | 1.29 | 1.29 | 0.96 | 0.38 | 178 | 24 | 1.28 | 1.36 | 1.22 | https://analyzingalpha.com/takuri-candlestick-pattern |
| 10,070 | forex | downtrend | takuri | 1 | bullish reversal | bearish continuation | 5 | high-close | 1,173 | 63,306 | 60,921 | 77,493 | 0.97 | 0.97 | 0.96 | 0.33 | 1,052 | 59 | 1.27 | 1.35 | 1.23 | https://analyzingalpha.com/takuri-candlestick-pattern |
| 10,075 | stock | downtrend | takuri | 1 | bullish reversal | bearish continuation | 5 | high-close | 5,963 | 172,648 | 158,347 | 207,031 | 0.86 | 0.86 | 0.92 | 0.31 | 162 | 32 | 1.31 | 1.49 | 1.23 | https://analyzingalpha.com/takuri-candlestick-pattern |
| 10,105 | stock | downtrend | bullish_abandoned_baby | 3 | bullish reversal | bullish reversal | 5 | low-high | 30 | 63 | 41 | 1,203 | 0.76 | 0.25 | 0.65 | 0.29 | 3 | 2 | 29.34 | 54.00 | 19.14 | https://analyzingalpha.com/bullish-abandoned-baby-candlestick-pattern |
| 10,110 | stock | downtrend | bullish_breakaway | 5 | bullish reversal | bullish reversal | 5 | low-close | 37 | 73 | 67 | 2,814 | 0.97 | 0.19 | 0.92 | 0.33 | 2 | 2 | 42.00 | 70.18 | 28.22 | https://analyzingalpha.com/bullish-breakaway-candlestick-pattern |
| 10,186 | crypto | uptrend | rising_three_methods | 5 | bullish continuation | bullish continuation | 1 | low-close | 1 | 2 | 2 | 31 | 1.00 | 0.20 | 1.00 | 1.00 | 2 | 0 | 15.50 | 15.50 | https://analyzingalpha.com/rising-three-methods-candlestick-pattern | |
| 10,220 | crypto | none | bullish_spinning_top | 1 | indecision | bullish | 5 | atr-pattern_low | 253 | 9,679 | 5,119 | 88,400 | 0.49 | 0.49 | 0.53 | 0.25 | 3 | 18 | 17.27 | 29.17 | 13.37 | https://analyzingalpha.com/bullish-spinning-top-candlestick-pattern |
| 10,230 | stock | none | bullish_spinning_top | 1 | indecision | bullish | 5 | atr-pattern_low | 6,203 | 829,243 | 443,803 | 6,190,567 | 0.37 | 0.37 | 0.54 | 0.23 | 7 | 49 | 13.95 | 26.48 | 10.26 | https://analyzingalpha.com/bullish-spinning-top-candlestick-pattern |
| 10,285 | crypto | uptrend | bearish_doji_star | 2 | bearish reversal | bullish mean reversion | 5 | atr-pattern_low | 126 | 514 | 145 | 2,102 | 0.86 | 0.43 | 0.28 | 0.31 | 2 | 4 | 14.50 | 19.09 | 12.43 | https://analyzingalpha.com/bearish-doji-star-candlestick-pattern |
| 10,295 | stock | uptrend | bearish_doji_star | 2 | bearish reversal | bullish mean reversion | 5 | atr-pattern_low | 4,834 | 119,856 | 29,339 | 409,954 | 0.40 | 0.20 | 0.24 | 0.23 | 5 | 15 | 13.97 | 25.89 | 10.35 | https://analyzingalpha.com/bearish-doji-star-candlestick-pattern |
| 10,310 | stock | downtrend | falling_three_methods | 5 | bearish continuation | bearish mean reversion | 5 | atr-pattern_high | 103 | 220 | 22 | 396 | 0.64 | 0.13 | 0.10 | 0.27 | 1 | 2 | 18.00 | 24.67 | 15.50 | https://analyzingalpha.com/falling-three-methods-candlestick-pattern |
| 10,345 | crypto | uptrend | up_gap_side_by_side | 3 | bullish continuation | bullish continuation | 5 | low-high | 34 | 85 | 51 | 939 | 0.76 | 0.25 | 0.60 | 0.29 | 1 | 4 | 18.41 | 22.40 | 16.75 | https://analyzingalpha.com/up-gap-side-by-side-candlestick-pattern |
| 10,355 | stock | uptrend | up_gap_side_by_side | 3 | bullish continuation | bullish continuation | 5 | low-high | 4,120 | 39,114 | 22,581 | 547,060 | 0.50 | 0.17 | 0.58 | 0.25 | 5 | 17 | 24.23 | 45.21 | 17.27 | https://analyzingalpha.com/up-gap-side-by-side-candlestick-pattern |
| 10,361 | forex | uptrend | bearish_doji_star | 2 | bearish reversal | bearish mean reversion | 1 | atr-pattern_high | 692 | 7,113 | 3,863 | 20,075 | 0.32 | 0.16 | 0.54 | 0.66 | 33 | 7 | 5.20 | 4.66 | 6.25 | https://analyzingalpha.com/bearish-doji-star-candlestick-pattern |
| 10,400 | crypto | downtrend | inverted_hammer | 1 | bullish reversal | bullish reversal | 5 | low-close | 176 | 1,019 | 987 | 1,153 | 0.76 | 0.76 | 0.97 | 0.29 | 6 | 11 | 1.17 | 1.19 | 1.16 | https://analyzingalpha.com/inverted-hammer-candlestick-pattern |
| 10,405 | forex | downtrend | inverted_hammer | 1 | bullish reversal | bullish reversal | 5 | low-close | 697 | 4,447 | 4,327 | 8,389 | 0.76 | 0.76 | 0.97 | 0.29 | 19 | 30 | 1.94 | 2.20 | 1.83 | https://analyzingalpha.com/inverted-hammer-candlestick-pattern |
| 10,410 | stock | downtrend | inverted_hammer | 1 | bullish reversal | bullish reversal | 5 | low-close | 5,725 | 178,745 | 167,397 | 248,124 | 0.68 | 0.68 | 0.94 | 0.28 | 5 | 30 | 1.48 | 1.78 | 1.37 | https://analyzingalpha.com/inverted-hammer-candlestick-pattern |
| 10,460 | crypto | uptrend | bearish_tri_star | 3 | bearish reversal | bearish reversal | 5 | high-low | 4 | 11 | 6 | 135 | 1.00 | 0.33 | 0.55 | 0.33 | 1 | 2 | 22.50 | 48.00 | 9.75 | https://analyzingalpha.com/bearish-tri-star-candlestick-pattern |
| 10,693 | crypto | downtrend | unique_three_river_bottom | 3 | bullish reversal | bullish reversal | 3 | low-high | 7 | 14 | 9 | 108 | 1.23 | 0.41 | 0.64 | 0.56 | 2 | 2 | 12.00 | 15.40 | 7.75 | https://analyzingalpha.com/unique-three-river-bottom-candlestick-pattern |
| 10,790 | stock | downtrend | down_gap_side_by_side | 3 | bearish continuation | bullish mean reversion | 5 | atr-pattern_low | 3,417 | 38,239 | 11,357 | 126,016 | 0.25 | 0.08 | 0.30 | 0.21 | 3 | 20 | 11.10 | 21.79 | 8.29 | https://analyzingalpha.com/down-gap-side-by-side-candlestick-pattern |
| 10,795 | crypto | uptrend | dark_cloud_cover | 2 | bearish reversal | bearish reversal | 5 | high-close | 1 | 2 | 2 | 17 | 2.00 | 1.00 | 1.00 | 0.50 | 1 | 0 | 8.50 | 12.00 | 5.00 | https://analyzingalpha.com/dark-cloud-cover-candlestick-pattern |
| 10,905 | crypto | downtrend | bullish_tri_star | 3 | bullish reversal | bullish mean reversion | 5 | atr-pattern_low | 10 | 23 | 12 | 572 | 1.51 | 0.50 | 0.52 | 0.42 | 1 | 2 | 47.67 | 99.20 | 10.86 | https://analyzingalpha.com/bullish-tri-star-candlestick-pattern |
| 10,955 | stock | uptrend | bearish_belt_hold | 1 | bearish reversal | bullish mean reversion | 5 | atr-pattern_low | 5,825 | 334,837 | 206,551 | 4,694,609 | 0.39 | 0.39 | 0.62 | 0.23 | 5 | 32 | 22.73 | 43.58 | 16.42 | https://analyzingalpha.com/bearish-belt-hold-candlestick-pattern |
| 10,958 | forex | downtrend | in_neck | 2 | bearish continuation | bearish mean reversion | 3 | atr-pattern_high | 2 | 4 | 1 | 4 | 3.00 | 1.50 | 0.25 | 1.00 | 1 | 0 | 4.00 | 4.00 | https://analyzingalpha.com/in-neck-candlestick-pattern | |
| 10,982 | crypto | downtrend | three_white_soldiers | 3 | bullish reversal | bullish mean reversion | 2 | atr-pattern_low | 18 | 38 | 1 | 1 | 2.00 | 0.67 | 0.03 | 1.00 | 1 | 0 | 1.00 | 1.00 | https://analyzingalpha.com/three-white-soldiers-candlestick-pattern | |
| 10,990 | forex | downtrend | three_white_soldiers | 3 | bullish reversal | bullish mean reversion | 5 | atr-pattern_low | 292 | 2,012 | 89 | 1,030 | 1.90 | 0.63 | 0.04 | 0.48 | 3 | 3 | 11.57 | 15.60 | 7.80 | https://analyzingalpha.com/three-white-soldiers-candlestick-pattern |
| 11,001 | forex | downtrend | homing_pigeon | 2 | bullish reversal | bearish mean reversion | 1 | atr-pattern_high | 380 | 1,901 | 625 | 2,777 | 0.32 | 0.16 | 0.33 | 0.66 | 14 | 4 | 4.44 | 4.07 | 5.16 | https://analyzingalpha.com/homing-pigeon-candlestick-pattern |
| 11,120 | crypto | none | bullish_high_wave | 1 | indecision | bullish | 5 | atr-pattern_low | 249 | 7,713 | 4,138 | 71,025 | 0.48 | 0.48 | 0.54 | 0.25 | 2 | 15 | 17.16 | 29.72 | 13.06 | https://analyzingalpha.com/bullish-high-wave-candlestick-pattern |
| 11,130 | stock | none | bullish_high_wave | 1 | indecision | bullish | 5 | atr-pattern_low | 6,159 | 654,201 | 358,472 | 4,875,542 | 0.37 | 0.37 | 0.55 | 0.23 | 6 | 44 | 13.60 | 25.69 | 10.05 | https://analyzingalpha.com/bullish-high-wave-candlestick-pattern |
| 11,135 | crypto | none | doji | 1 | indecision | bullish | 5 | low-close | 259 | 32,125 | 27,127 | 94,885 | 0.75 | 0.75 | 0.84 | 0.29 | 11 | 21 | 3.50 | 4.34 | 3.15 | https://analyzingalpha.com/doji-candlestick-pattern |
| 11,145 | stock | none | doji | 1 | indecision | bullish | 5 | low-close | 6,600 | 1,800,984 | 1,545,762 | 6,027,624 | 0.44 | 0.44 | 0.86 | 0.24 | 15 | 33 | 3.90 | 6.24 | 3.16 | https://analyzingalpha.com/doji-candlestick-pattern |
| 11,160 | stock | downtrend | three_outside_up | 3 | bullish reversal | bullish reversal | 5 | low-close | 4,824 | 65,517 | 59,210 | 2,014,139 | 0.35 | 0.12 | 0.90 | 0.23 | 5 | 23 | 34.02 | 71.71 | 23.06 | https://analyzingalpha.com/three-outside-up-candlestick-pattern |
| 11,165 | crypto | downtrend | homing_pigeon | 2 | bullish reversal | bullish reversal | 5 | low-close | 97 | 328 | 309 | 1,665 | 0.48 | 0.24 | 0.94 | 0.25 | 3 | 11 | 5.39 | 4.58 | 5.65 | https://analyzingalpha.com/homing-pigeon-candlestick-pattern |
| 11,230 | forex | none | rickshaw_man | 1 | indecision | bearish | 5 | atr-pattern_high | 1,116 | 147,232 | 89,988 | 1,012,842 | 0.27 | 0.27 | 0.61 | 0.21 | 287 | 108 | 11.26 | 20.84 | 8.69 | https://analyzingalpha.com/rickshaw-man-candlestick-pattern |
| 11,255 | stock | uptrend | bullish_three_line_strike | 4 | bullish continuation | bullish mean reversion | 5 | atr-pattern_low | 1,015 | 2,617 | 1,669 | 27,837 | 0.38 | 0.09 | 0.64 | 0.23 | 3 | 5 | 16.68 | 29.76 | 12.78 | https://analyzingalpha.com/bullish-three-line-strike-candlestick-pattern |
| 11,259 | crypto | uptrend | evening_doji_star | 3 | bearish reversal | bullish mean reversion | 4 | atr-pattern_low | 23 | 50 | 20 | 297 | 0.50 | 0.17 | 0.40 | 0.30 | 2 | 2 | 14.85 | 30.17 | 8.29 | https://analyzingalpha.com/evening-doji-star-candlestick-pattern |
| 11,260 | crypto | uptrend | evening_doji_star | 3 | bearish reversal | bullish mean reversion | 5 | atr-pattern_low | 23 | 50 | 20 | 312 | 0.50 | 0.17 | 0.40 | 0.25 | 1 | 2 | 15.60 | 32.80 | 9.87 | https://analyzingalpha.com/evening-doji-star-candlestick-pattern |
| 11,270 | stock | uptrend | evening_doji_star | 3 | bearish reversal | bullish mean reversion | 5 | atr-pattern_low | 3,034 | 13,605 | 7,387 | 125,543 | 0.35 | 0.12 | 0.54 | 0.23 | 4 | 11 | 17.00 | 32.93 | 12.38 | https://analyzingalpha.com/evening-doji-star-candlestick-pattern |
| 11,275 | crypto | downtrend | bullish_engulfing | 2 | bullish reversal | bullish mean reversion | 5 | atr-pattern_low | 222 | 2,389 | 770 | 14,603 | 0.33 | 0.17 | 0.32 | 0.22 | 3 | 11 | 18.96 | 37.23 | 13.75 | https://analyzingalpha.com/bullish-engulfing-candlestick-pattern |
| 11,285 | stock | downtrend | bullish_engulfing | 2 | bullish reversal | bullish mean reversion | 5 | atr-pattern_low | 5,580 | 173,575 | 51,006 | 897,339 | 0.39 | 0.20 | 0.29 | 0.23 | 7 | 21 | 17.59 | 33.74 | 12.71 | https://analyzingalpha.com/bullish-engulfing-candlestick-pattern |
| 11,335 | crypto | downtrend | thrusting | 2 | bearish continuation | bearish continuation | 5 | high-close | 3 | 6 | 6 | 101 | 1.00 | 0.50 | 1.00 | 0.33 | 1 | 2 | 16.83 | 16.50 | 17.00 | https://analyzingalpha.com/thrusting-candlestick-pattern |
| 11,396 | crypto | uptrend | rising_three_methods | 5 | bullish continuation | bearish mean reversion | 1 | atr-pattern_high | 1 | 2 | 1 | 4 | 1.00 | 0.20 | 0.50 | 1.00 | 1 | 0 | 4.00 | 4.00 | https://analyzingalpha.com/rising-three-methods-candlestick-pattern | |
| 11,415 | crypto | none | bullish_long_line | 1 | bullish | bearish | 5 | high-close | 245 | 20,817 | 19,747 | 27,939 | 0.80 | 0.80 | 0.95 | 0.30 | 64 | 51 | 1.41 | 1.59 | 1.34 | https://analyzingalpha.com/bullish-long-line-candlestick-pattern |
| 11,420 | forex | none | bullish_long_line | 1 | bullish | bearish | 5 | high-close | 1,273 | 317,098 | 294,151 | 392,540 | 1.17 | 1.17 | 0.93 | 0.36 | 490 | 37 | 1.33 | 1.40 | 1.30 | https://analyzingalpha.com/bullish-long-line-candlestick-pattern |
| 11,425 | stock | none | bullish_long_line | 1 | bullish | bearish | 5 | high-close | 6,449 | 1,459,096 | 1,336,824 | 1,811,548 | 0.45 | 0.45 | 0.92 | 0.24 | 303 | 46 | 1.36 | 1.70 | 1.24 | https://analyzingalpha.com/bullish-long-line-candlestick-pattern |
| 11,447 | forex | uptrend | upside_gap_two_crows | 3 | bearish reversal | bullish mean reversion | 2 | atr-pattern_low | 6 | 12 | 2 | 71 | 2.00 | 0.67 | 0.17 | 1.00 | 1 | 0 | 35.50 | 35.50 | https://analyzingalpha.com/upside-gap-two-crows-candlestick-pattern | |
| 11,450 | forex | uptrend | upside_gap_two_crows | 3 | bearish reversal | bullish mean reversion | 5 | atr-pattern_low | 6 | 12 | 2 | 367 | 2.00 | 0.67 | 0.17 | 0.50 | 1 | 1 | 183.50 | 98.00 | 269.00 | https://analyzingalpha.com/upside-gap-two-crows-candlestick-pattern |
| 11,455 | stock | uptrend | upside_gap_two_crows | 3 | bearish reversal | bullish mean reversion | 5 | atr-pattern_low | 825 | 2,104 | 500 | 8,470 | 0.57 | 0.19 | 0.24 | 0.26 | 2 | 3 | 16.94 | 27.82 | 13.08 | https://analyzingalpha.com/upside-gap-two-crows-candlestick-pattern |
| 11,461 | forex | uptrend | bearish_harami_cross | 2 | bearish reversal | bearish mean reversion | 1 | atr-pattern_high | 714 | 6,985 | 3,395 | 14,829 | 0.30 | 0.15 | 0.49 | 0.65 | 28 | 5 | 4.37 | 4.04 | 4.99 | https://analyzingalpha.com/bearish-harami-cross-candlestick-pattern |
| 11,485 | stock | downtrend | three_white_soldiers | 3 | bullish reversal | bullish reversal | 5 | low-high | 436 | 926 | 773 | 52,028 | 0.45 | 0.15 | 0.83 | 0.24 | 3 | 4 | 67.31 | 138.20 | 44.68 | https://analyzingalpha.com/three-white-soldiers-candlestick-pattern |
| 11,530 | stock | downtrend | morning_star | 3 | bullish reversal | bullish reversal | 5 | low-close | 4,034 | 30,525 | 27,133 | 847,077 | 0.37 | 0.12 | 0.89 | 0.23 | 5 | 17 | 31.22 | 65.16 | 21.25 | https://analyzingalpha.com/morning-star-candlestick-pattern |
| 11,535 | crypto | downtrend | morning_doji_star | 3 | bullish reversal | bullish reversal | 5 | low-close | 22 | 48 | 45 | 616 | 1.27 | 0.42 | 0.94 | 0.38 | 2 | 3 | 13.69 | 19.24 | 10.32 | https://analyzingalpha.com/morning-doji-star-candlestick-pattern |
| 11,580 | crypto | uptrend | bullish_three_line_strike | 4 | bullish continuation | bullish continuation | 5 | low-high | 19 | 44 | 15 | 248 | 1.40 | 0.35 | 0.34 | 0.40 | 1 | 2 | 16.53 | 17.33 | 16.00 | https://analyzingalpha.com/bullish-three-line-strike-candlestick-pattern |
| 11,596 | forex | uptrend | bearish_harami | 2 | bearish reversal | bearish mean reversion | 1 | atr-pattern_high | 830 | 21,414 | 9,075 | 39,318 | 0.28 | 0.14 | 0.42 | 0.64 | 36 | 5 | 4.33 | 3.89 | 5.12 | https://analyzingalpha.com/bearish-harami-candlestick-pattern |
| 11,610 | crypto | uptrend | shooting_star | 1 | bearish reversal | bullish mean reversion | 5 | atr-pattern_low | 100 | 341 | 253 | 3,108 | 1.09 | 1.09 | 0.74 | 0.35 | 4 | 5 | 12.28 | 17.43 | 9.54 | https://analyzingalpha.com/shooting-star-candlestick-pattern |
| 11,620 | stock | uptrend | shooting_star | 1 | bearish reversal | bullish mean reversion | 5 | atr-pattern_low | 4,631 | 95,153 | 61,841 | 929,151 | 0.38 | 0.38 | 0.65 | 0.23 | 5 | 21 | 15.02 | 28.66 | 10.96 | https://analyzingalpha.com/shooting-star-candlestick-pattern |
| 11,655 | crypto | none | dragonfly_doji | 1 | indecision | bearish | 5 | high-close | 235 | 7,137 | 6,904 | 8,549 | 1.23 | 1.23 | 0.97 | 0.37 | 172 | 37 | 1.24 | 1.30 | 1.20 | https://analyzingalpha.com/dragonfly-doji-candlestick-pattern |
| 11,660 | forex | none | dragonfly_doji | 1 | indecision | bearish | 5 | high-close | 1,198 | 115,148 | 110,567 | 147,301 | 1.28 | 1.28 | 0.96 | 0.38 | 1,589 | 64 | 1.33 | 1.40 | 1.29 | https://analyzingalpha.com/dragonfly-doji-candlestick-pattern |
| 11,665 | stock | none | dragonfly_doji | 1 | indecision | bearish | 5 | high-close | 6,133 | 379,937 | 351,320 | 455,731 | 0.83 | 0.83 | 0.92 | 0.31 | 286 | 42 | 1.30 | 1.49 | 1.21 | https://analyzingalpha.com/dragonfly-doji-candlestick-pattern |
| 11,730 | crypto | downtrend | bearish_separating_lines | 2 | bearish continuation | bullish mean reversion | 5 | atr-pattern_low | 191 | 2,125 | 823 | 20,348 | 0.42 | 0.21 | 0.39 | 0.24 | 3 | 13 | 24.72 | 52.31 | 16.21 | https://analyzingalpha.com/bearish-separating-lines-candlestick-pattern |
| 11,732 | forex | downtrend | bearish_separating_lines | 2 | bearish continuation | bullish mean reversion | 2 | atr-pattern_low | 1,239 | 70,969 | 29,872 | 274,902 | 0.35 | 0.17 | 0.42 | 0.45 | 8 | 15 | 9.20 | 9.66 | 8.83 | https://analyzingalpha.com/bearish-separating-lines-candlestick-pattern |
| 11,740 | stock | downtrend | bearish_separating_lines | 2 | bearish continuation | bullish mean reversion | 5 | atr-pattern_low | 4,213 | 38,591 | 19,951 | 376,021 | 0.34 | 0.17 | 0.52 | 0.22 | 6 | 16 | 18.85 | 36.39 | 13.80 | https://analyzingalpha.com/bearish-separating-lines-candlestick-pattern |
| 11,745 | crypto | downtrend | bullish_belt_hold | 1 | bullish reversal | bearish continuation | 5 | high-close | 249 | 6,856 | 6,255 | 38,489 | 0.70 | 0.70 | 0.91 | 0.28 | 28 | 31 | 6.15 | 4.99 | 6.61 | https://analyzingalpha.com/bullish-belt-hold-candlestick-pattern |
| 11,750 | forex | downtrend | bullish_belt_hold | 1 | bullish reversal | bearish continuation | 5 | high-close | 1,280 | 129,540 | 107,823 | 339,061 | 1.30 | 1.30 | 0.83 | 0.38 | 193 | 48 | 3.14 | 3.27 | 3.07 | https://analyzingalpha.com/bullish-belt-hold-candlestick-pattern |
| 11,790 | crypto | downtrend | three_outside_up | 3 | bullish reversal | bullish reversal | 5 | low-high | 157 | 924 | 602 | 14,488 | 0.78 | 0.26 | 0.65 | 0.30 | 4 | 9 | 24.07 | 41.24 | 16.86 | https://analyzingalpha.com/three-outside-up-candlestick-pattern |
| 11,810 | crypto | uptrend | bullish_separating_lines | 2 | bullish continuation | bullish mean reversion | 5 | atr-pattern_low | 143 | 529 | 180 | 4,435 | 0.76 | 0.38 | 0.34 | 0.29 | 2 | 4 | 24.64 | 38.45 | 18.87 | https://analyzingalpha.com/bullish-separating-lines-candlestick-pattern |
| 11,820 | stock | uptrend | bullish_separating_lines | 2 | bullish continuation | bullish mean reversion | 5 | atr-pattern_low | 3,616 | 24,055 | 5,197 | 91,562 | 0.49 | 0.24 | 0.22 | 0.25 | 4 | 7 | 17.62 | 31.39 | 13.11 | https://analyzingalpha.com/bullish-separating-lines-candlestick-pattern |
| 11,890 | forex | uptrend | two_crows | 3 | bearish reversal | bearish mean reversion | 5 | atr-pattern_high | 4 | 8 | 2 | 85 | 2.00 | 0.67 | 0.25 | 0.50 | 1 | 1 | 42.50 | 84.00 | 1.00 | https://analyzingalpha.com/two-crows-candlestick-pattern |
| 11,950 | forex | uptrend | bearish_counterattack | 2 | bearish reversal | bearish reversal | 5 | high-close | 92 | 402 | 372 | 5,094 | 0.78 | 0.39 | 0.93 | 0.30 | 10 | 12 | 13.69 | 14.15 | 13.50 | https://analyzingalpha.com/bearish-counterattack-candlestick-pattern |
| 11,960 | crypto | downtrend | bullish_doji_star | 2 | bullish reversal | bullish mean reversion | 5 | atr-pattern_low | 147 | 678 | 345 | 7,161 | 0.63 | 0.32 | 0.51 | 0.27 | 2 | 7 | 20.76 | 38.24 | 14.21 | https://analyzingalpha.com/bullish-doji-star-candlestick-pattern |
| 11,961 | forex | downtrend | bullish_doji_star | 2 | bullish reversal | bullish mean reversion | 1 | atr-pattern_low | 694 | 5,890 | 3,129 | 14,589 | 0.24 | 0.12 | 0.53 | 0.62 | 22 | 9 | 4.66 | 4.59 | 4.77 | https://analyzingalpha.com/bullish-doji-star-candlestick-pattern |
| 12,035 | crypto | uptrend | three_inside_down | 3 | bearish reversal | bullish mean reversion | 5 | atr-pattern_low | 66 | 193 | 113 | 2,376 | 1.02 | 0.34 | 0.59 | 0.34 | 3 | 4 | 21.03 | 34.29 | 14.31 | https://analyzingalpha.com/three-inside-down-candlestick-pattern |
| 12,045 | stock | uptrend | three_inside_down | 3 | bearish reversal | bullish mean reversion | 5 | atr-pattern_low | 3,832 | 37,529 | 23,705 | 424,254 | 0.45 | 0.15 | 0.63 | 0.24 | 5 | 16 | 17.90 | 33.58 | 12.90 | https://analyzingalpha.com/three-inside-down-candlestick-pattern |
| 12,065 | forex | uptrend | bearish_tri_star | 3 | bearish reversal | bearish reversal | 5 | high-close | 63 | 259 | 249 | 1,121 | 0.76 | 0.25 | 0.96 | 0.29 | 13 | 21 | 4.50 | 3.59 | 4.88 | https://analyzingalpha.com/bearish-tri-star-candlestick-pattern |
| 12,070 | stock | uptrend | bearish_tri_star | 3 | bearish reversal | bearish reversal | 5 | high-close | 2,141 | 9,920 | 7,580 | 83,573 | 0.38 | 0.13 | 0.76 | 0.23 | 10 | 10 | 11.03 | 14.50 | 9.99 | https://analyzingalpha.com/bearish-tri-star-candlestick-pattern |
| 12,075 | crypto | none | bearish_marubozu | 1 | bearish | bullish | 5 | low-close | 240 | 11,558 | 10,359 | 12,743 | 1.54 | 1.54 | 0.90 | 0.42 | 14 | 22 | 1.23 | 1.30 | 1.18 | https://analyzingalpha.com/bearish-marubozu-candlestick-pattern |
| 12,080 | forex | none | bearish_marubozu | 1 | bearish | bullish | 5 | low-close | 1,246 | 233,923 | 192,055 | 214,393 | 2.56 | 2.56 | 0.82 | 0.59 | 56 | 42 | 1.12 | 1.07 | 1.19 | https://analyzingalpha.com/bearish-marubozu-candlestick-pattern |
| 12,085 | stock | none | bearish_marubozu | 1 | bearish | bullish | 5 | low-close | 6,299 | 553,338 | 503,377 | 630,444 | 0.76 | 0.76 | 0.91 | 0.29 | 9 | 33 | 1.25 | 1.42 | 1.18 | https://analyzingalpha.com/bearish-marubozu-candlestick-pattern |
| 12,092 | forex | uptrend | three_outside_down | 3 | bearish reversal | bearish mean reversion | 2 | atr-pattern_high | 691 | 10,104 | 1,560 | 11,580 | 0.22 | 0.07 | 0.15 | 0.41 | 6 | 7 | 7.42 | 8.36 | 6.78 | https://analyzingalpha.com/three-outside-down-candlestick-pattern |
| 12,184 | crypto | downtrend | bearish_three_line_strike | 4 | bearish continuation | bearish mean reversion | 4 | atr-pattern_high | 26 | 74 | 39 | 615 | 0.66 | 0.17 | 0.53 | 0.33 | 1 | 3 | 15.77 | 24.31 | 11.50 | https://analyzingalpha.com/bearish-three-line-strike-candlestick-pattern |
| 12,187 | forex | downtrend | bearish_three_line_strike | 4 | bearish continuation | bearish mean reversion | 2 | atr-pattern_high | 287 | 853 | 545 | 5,675 | 0.47 | 0.12 | 0.64 | 0.49 | 5 | 3 | 10.41 | 11.84 | 9.05 | https://analyzingalpha.com/bearish-three-line-strike-candlestick-pattern |
| 12,261 | forex | downtrend | unique_three_river_bottom | 3 | bullish reversal | bearish mean reversion | 1 | atr-pattern_high | 100 | 332 | 100 | 354 | 0.50 | 0.17 | 0.30 | 0.75 | 5 | 3 | 3.54 | 3.32 | 4.20 | https://analyzingalpha.com/unique-three-river-bottom-candlestick-pattern |
| 12,262 | forex | downtrend | unique_three_river_bottom | 3 | bullish reversal | bearish mean reversion | 2 | atr-pattern_high | 100 | 329 | 100 | 1,268 | 0.50 | 0.17 | 0.30 | 0.50 | 4 | 3 | 12.68 | 12.84 | 12.52 | https://analyzingalpha.com/unique-three-river-bottom-candlestick-pattern |
| 12,291 | forex | uptrend | bullish_harami_cross | 2 | bullish reversal | bearish mean reversion | 1 | atr-pattern_high | 705 | 6,986 | 1,959 | 8,486 | 0.30 | 0.15 | 0.28 | 0.65 | 20 | 5 | 4.33 | 4.10 | 4.76 | https://analyzingalpha.com/bullish-harami-cross-candlestick-pattern |
| 12,340 | stock | uptrend | two_crows | 3 | bearish reversal | bullish mean reversion | 5 | atr-pattern_low | 1,665 | 4,884 | 1,987 | 30,456 | 0.34 | 0.11 | 0.41 | 0.22 | 2 | 5 | 15.33 | 28.09 | 11.67 | https://analyzingalpha.com/two-crows-candlestick-pattern |
| 12,384 | forex | uptrend | rising_three_methods | 5 | bullish continuation | bullish mean reversion | 4 | atr-pattern_low | 12 | 27 | 7 | 73 | 1.15 | 0.23 | 0.26 | 0.43 | 1 | 1 | 10.43 | 15.67 | 6.50 | https://analyzingalpha.com/rising-three-methods-candlestick-pattern |
| 12,390 | stock | uptrend | rising_three_methods | 5 | bullish continuation | bullish mean reversion | 5 | atr-pattern_low | 146 | 315 | 40 | 627 | 0.80 | 0.16 | 0.13 | 0.30 | 2 | 2 | 15.68 | 21.00 | 13.39 | https://analyzingalpha.com/rising-three-methods-candlestick-pattern |
| 12,428 | stock | uptrend | bearish_breakaway | 5 | bearish reversal | bearish mean reversion | 3 | atr-pattern_high | 77 | 164 | 32 | 245 | 0.88 | 0.18 | 0.20 | 0.47 | 2 | 2 | 7.66 | 11.07 | 4.65 | https://analyzingalpha.com/bearish-breakaway-candlestick-pattern |
| 12,499 | forex | uptrend | upside_tasuki_gap | 3 | bullish continuation | bearish mean reversion | 4 | atr-pattern_high | 50 | 114 | 32 | 980 | 0.88 | 0.29 | 0.28 | 0.38 | 1 | 2 | 30.62 | 68.92 | 7.65 | https://analyzingalpha.com/upside-tasuki-gap-candlestick-pattern |
| 12,508 | stock | uptrend | bearish_abandoned_baby | 3 | bearish reversal | bearish reversal | 3 | high-close | 36 | 87 | 59 | 1,063 | 0.43 | 0.14 | 0.68 | 0.36 | 3 | 2 | 18.02 | 16.29 | 18.97 | https://analyzingalpha.com/bearish-abandoned-baby-candlestick-pattern |
| 12,575 | crypto | uptrend | bearish_counterattack | 2 | bearish reversal | bullish continuation | 5 | low-close | 7 | 21 | 20 | 46 | 0.80 | 0.40 | 0.95 | 0.30 | 1 | 5 | 2.30 | 1.17 | 2.79 | https://analyzingalpha.com/bearish-counterattack-candlestick-pattern |
| 12,585 | stock | uptrend | bearish_counterattack | 2 | bearish reversal | bullish continuation | 5 | low-close | 1,806 | 5,734 | 4,995 | 18,577 | 0.42 | 0.21 | 0.87 | 0.24 | 4 | 10 | 3.72 | 6.21 | 2.96 | https://analyzingalpha.com/bearish-counterattack-candlestick-pattern |
| 12,610 | stock | downtrend | in_neck | 2 | bearish continuation | bullish mean reversion | 5 | atr-pattern_low | 3,123 | 13,308 | 6,179 | 106,471 | 0.34 | 0.17 | 0.46 | 0.22 | 3 | 7 | 17.23 | 34.35 | 12.33 | https://analyzingalpha.com/in-neck-candlestick-pattern |
| 12,680 | crypto | downtrend | three_inside_up | 3 | bullish reversal | bullish mean reversion | 5 | atr-pattern_low | 70 | 208 | 48 | 606 | 0.38 | 0.13 | 0.23 | 0.23 | 2 | 3 | 12.62 | 18.09 | 11.00 | https://analyzingalpha.com/three-inside-up-candlestick-pattern |
| 12,681 | forex | downtrend | three_inside_up | 3 | bullish reversal | bullish mean reversion | 1 | atr-pattern_low | 507 | 2,137 | 280 | 864 | 0.26 | 0.09 | 0.13 | 0.63 | 3 | 4 | 3.09 | 3.02 | 3.20 | https://analyzingalpha.com/three-inside-up-candlestick-pattern |
| 12,690 | stock | downtrend | three_inside_up | 3 | bullish reversal | bullish mean reversion | 5 | atr-pattern_low | 4,279 | 41,668 | 7,510 | 129,083 | 0.47 | 0.16 | 0.18 | 0.25 | 4 | 9 | 17.19 | 31.16 | 12.64 | https://analyzingalpha.com/three-inside-up-candlestick-pattern |
| 12,720 | stock | downtrend | bullish_tri_star | 3 | bullish reversal | bullish reversal | 5 | low-close | 2,137 | 10,751 | 7,763 | 75,224 | 0.55 | 0.18 | 0.72 | 0.26 | 5 | 13 | 9.69 | 15.06 | 7.83 | https://analyzingalpha.com/bullish-tri-star-candlestick-pattern |
| 12,750 | crypto | none | bearish_long_line | 1 | bearish | bullish | 5 | low-close | 250 | 23,125 | 21,759 | 30,979 | 0.78 | 0.78 | 0.94 | 0.30 | 12 | 31 | 1.42 | 1.62 | 1.34 | https://analyzingalpha.com/bearish-long-line-candlestick-pattern |
| 12,755 | forex | none | bearish_long_line | 1 | bearish | bullish | 5 | low-close | 1,273 | 323,962 | 300,735 | 387,801 | 1.22 | 1.22 | 0.93 | 0.37 | 56 | 31 | 1.29 | 1.25 | 1.31 | https://analyzingalpha.com/bearish-long-line-candlestick-pattern |
| 12,760 | stock | none | bearish_long_line | 1 | bearish | bullish | 5 | low-close | 6,448 | 1,478,970 | 1,371,434 | 1,845,370 | 0.44 | 0.44 | 0.93 | 0.24 | 10 | 38 | 1.35 | 1.67 | 1.24 | https://analyzingalpha.com/bearish-long-line-candlestick-pattern |
| 12,809 | crypto | downtrend | bullish_counterattack | 2 | bullish reversal | bullish reversal | 4 | low-close | 6 | 24 | 22 | 275 | 0.82 | 0.41 | 0.92 | 0.36 | 3 | 2 | 12.50 | 2.00 | 18.50 | https://analyzingalpha.com/bullish-counterattack-candlestick-pattern |
| 12,843 | forex | none | bullish_high_wave | 1 | indecision | bearish | 3 | atr-pattern_high | 1,113 | 126,611 | 73,489 | 978,264 | 0.21 | 0.21 | 0.58 | 0.30 | 65 | 34 | 13.31 | 18.97 | 10.86 | https://analyzingalpha.com/bullish-high-wave-candlestick-pattern |
| 12,877 | forex | downtrend | bullish_harami | 2 | bullish reversal | bearish mean reversion | 2 | atr-pattern_high | 839 | 20,437 | 6,568 | 64,090 | 0.26 | 0.13 | 0.32 | 0.42 | 16 | 13 | 9.76 | 11.05 | 8.82 | https://analyzingalpha.com/bullish-harami-candlestick-pattern |
| 12,890 | crypto | uptrend | hanging_man | 1 | bearish reversal | bearish reversal | 5 | high-close | 204 | 2,891 | 2,786 | 3,586 | 1.45 | 1.45 | 0.96 | 0.41 | 31 | 13 | 1.29 | 1.32 | 1.27 | https://analyzingalpha.com/hanging-man-candlestick-pattern |
| 12,895 | forex | uptrend | hanging_man | 1 | bearish reversal | bearish reversal | 5 | high-close | 1,175 | 83,811 | 81,293 | 116,329 | 1.09 | 1.09 | 0.97 | 0.35 | 500 | 50 | 1.43 | 1.56 | 1.36 | https://analyzingalpha.com/hanging-man-candlestick-pattern |
| 12,900 | stock | uptrend | hanging_man | 1 | bearish reversal | bearish reversal | 5 | high-close | 5,365 | 251,679 | 235,131 | 363,848 | 0.75 | 0.75 | 0.93 | 0.29 | 129 | 36 | 1.55 | 1.87 | 1.41 | https://analyzingalpha.com/hanging-man-candlestick-pattern |
| 12,965 | forex | uptrend | shooting_star | 1 | bearish reversal | bearish mean reversion | 5 | atr-pattern_high | 494 | 2,446 | 1,184 | 20,995 | 0.37 | 0.37 | 0.48 | 0.23 | 6 | 6 | 17.73 | 32.49 | 13.39 | https://analyzingalpha.com/shooting-star-candlestick-pattern |
| 12,980 | forex | uptrend | advance_block | 3 | bearish reversal | bearish reversal | 5 | high-close | 1,072 | 20,296 | 18,917 | 68,857 | 0.60 | 0.20 | 0.93 | 0.27 | 24 | 35 | 3.64 | 4.62 | 3.28 | https://analyzingalpha.com/advance-block-candlestick-pattern |
| 13,010 | crypto | downtrend | morning_star | 3 | bullish reversal | bullish reversal | 5 | low-high | 62 | 180 | 120 | 1,716 | 0.45 | 0.15 | 0.67 | 0.24 | 3 | 5 | 14.30 | 22.97 | 11.54 | https://analyzingalpha.com/morning-star-candlestick-pattern |
| 13,025 | crypto | downtrend | downside_gap_three_methods | 3 | bearish continuation | bullish mean reversion | 5 | atr-pattern_low | 87 | 306 | 83 | 2,054 | 0.95 | 0.32 | 0.27 | 0.33 | 2 | 3 | 24.75 | 40.52 | 17.14 | https://analyzingalpha.com/downside-gap-three-methods-candlestick-pattern |
| 13,035 | stock | downtrend | downside_gap_three_methods | 3 | bearish continuation | bullish mean reversion | 5 | atr-pattern_low | 3,631 | 22,691 | 6,234 | 110,680 | 0.37 | 0.12 | 0.27 | 0.23 | 3 | 8 | 17.75 | 35.15 | 12.65 | https://analyzingalpha.com/downside-gap-three-methods-candlestick-pattern |
| 13,055 | crypto | none | bearish_short_line | 1 | indecision | bullish | 5 | low-close | 253 | 24,558 | 23,074 | 37,109 | 0.46 | 0.46 | 0.94 | 0.24 | 5 | 30 | 1.61 | 1.94 | 1.50 | https://analyzingalpha.com/bearish-short-line-candlestick-pattern |
| 13,060 | forex | none | bearish_short_line | 1 | indecision | bullish | 5 | low-close | 1,269 | 276,065 | 256,993 | 338,025 | 0.48 | 0.48 | 0.93 | 0.25 | 32 | 204 | 1.32 | 1.43 | 1.28 | https://analyzingalpha.com/bearish-short-line-candlestick-pattern |
| 13,065 | stock | none | bearish_short_line | 1 | indecision | bullish | 5 | low-close | 6,326 | 1,035,656 | 952,151 | 1,430,453 | 0.34 | 0.34 | 0.92 | 0.22 | 7 | 34 | 1.50 | 1.98 | 1.36 | https://analyzingalpha.com/bearish-short-line-candlestick-pattern |
| 13,090 | crypto | none | bullish_marubozu | 1 | bullish | bearish | 5 | high-close | 225 | 10,126 | 9,120 | 10,639 | 1.60 | 1.60 | 0.90 | 0.43 | 57 | 28 | 1.17 | 1.17 | 1.16 | https://analyzingalpha.com/bullish-marubozu-candlestick-pattern |
| 13,095 | forex | none | bullish_marubozu | 1 | bullish | bearish | 5 | high-close | 1,259 | 222,286 | 179,751 | 208,851 | 2.51 | 2.51 | 0.81 | 0.59 | 486 | 36 | 1.16 | 1.13 | 1.20 | https://analyzingalpha.com/bullish-marubozu-candlestick-pattern |
| 13,100 | stock | none | bullish_marubozu | 1 | bullish | bearish | 5 | high-close | 6,251 | 561,791 | 507,105 | 670,108 | 0.86 | 0.86 | 0.90 | 0.31 | 282 | 44 | 1.32 | 1.56 | 1.22 | https://analyzingalpha.com/bullish-marubozu-candlestick-pattern |
| 13,110 | crypto | downtrend | bullish_harami | 2 | bullish reversal | bullish mean reversion | 5 | atr-pattern_low | 229 | 2,410 | 1,038 | 20,895 | 0.27 | 0.13 | 0.43 | 0.21 | 3 | 14 | 20.13 | 40.85 | 14.59 | https://analyzingalpha.com/bullish-harami-candlestick-pattern |
| 13,120 | stock | downtrend | bullish_harami | 2 | bullish reversal | bullish mean reversion | 5 | atr-pattern_low | 5,851 | 255,080 | 114,478 | 2,042,596 | 0.42 | 0.21 | 0.45 | 0.24 | 5 | 26 | 17.84 | 33.78 | 12.93 | https://analyzingalpha.com/bullish-harami-candlestick-pattern |
| 13,155 | crypto | uptrend | bearish_tri_star | 3 | bearish reversal | bullish mean reversion | 5 | atr-pattern_low | 4 | 11 | 3 | 58 | 1.00 | 0.33 | 0.27 | 0.33 | 1 | 1 | 19.33 | 48.00 | 5.00 | https://analyzingalpha.com/bearish-tri-star-candlestick-pattern |
| 13,206 | forex | downtrend | three_outside_up | 3 | bullish reversal | bearish mean reversion | 1 | atr-pattern_high | 731 | 8,778 | 5,241 | 23,211 | 0.28 | 0.09 | 0.60 | 0.64 | 17 | 6 | 4.43 | 3.97 | 5.24 | https://analyzingalpha.com/three-outside-up-candlestick-pattern |
| 13,221 | forex | downtrend | morning_star | 3 | bullish reversal | bullish mean reversion | 1 | atr-pattern_low | 506 | 2,169 | 397 | 1,433 | 0.28 | 0.09 | 0.18 | 0.64 | 4 | 3 | 3.61 | 3.51 | 3.79 | https://analyzingalpha.com/morning-star-candlestick-pattern |
| 13,275 | stock | downtrend | bullish_doji_star | 2 | bullish reversal | bullish reversal | 5 | low-close | 5,259 | 104,735 | 95,509 | 409,068 | 0.52 | 0.26 | 0.91 | 0.25 | 8 | 34 | 4.28 | 6.89 | 3.40 | https://analyzingalpha.com/bullish-doji-star-candlestick-pattern |
| 13,319 | stock | downtrend | bearish_three_line_strike | 4 | bearish continuation | bullish mean reversion | 4 | atr-pattern_low | 702 | 1,706 | 290 | 4,533 | 0.49 | 0.12 | 0.17 | 0.30 | 2 | 2 | 15.63 | 25.24 | 11.58 | https://analyzingalpha.com/bearish-three-line-strike-candlestick-pattern |
| 13,365 | stock | downtrend | bullish_counterattack | 2 | bullish reversal | bearish continuation | 5 | high-close | 1,534 | 4,964 | 4,385 | 15,420 | 0.62 | 0.31 | 0.88 | 0.27 | 11 | 8 | 3.52 | 4.46 | 3.17 | https://analyzingalpha.com/bullish-counterattack-candlestick-pattern |
| 13,372 | forex | uptrend | upside_gap_three_methods | 3 | bullish continuation | bearish mean reversion | 2 | atr-pattern_high | 469 | 2,696 | 651 | 5,178 | 0.26 | 0.09 | 0.24 | 0.42 | 6 | 5 | 7.95 | 9.39 | 6.90 | https://analyzingalpha.com/upside-gap-three-methods-candlestick-pattern |
| 13,422 | forex | downtrend | downside_tasuki_gap | 3 | bearish continuation | bearish mean reversion | 2 | atr-pattern_high | 28 | 60 | 21 | 194 | 0.57 | 0.19 | 0.35 | 0.52 | 2 | 1 | 9.24 | 13.82 | 4.20 | https://analyzingalpha.com/downside-tasuki-gap-candlestick-pattern |
| 13,460 | crypto | none | long_legged_doji | 1 | indecision | bullish | 5 | low-close | 256 | 23,412 | 21,947 | 89,701 | 0.43 | 0.43 | 0.94 | 0.24 | 10 | 23 | 4.09 | 6.05 | 3.48 | https://analyzingalpha.com/long-legged-doji-candlestick-pattern |
| 13,535 | crypto | none | bearish_high_wave | 1 | indecision | bullish | 5 | atr-pattern_low | 246 | 7,349 | 4,163 | 71,887 | 0.47 | 0.47 | 0.57 | 0.25 | 3 | 16 | 17.27 | 28.81 | 13.52 | https://analyzingalpha.com/bearish-high-wave-candlestick-pattern |
| 13,545 | stock | none | bearish_high_wave | 1 | indecision | bullish | 5 | atr-pattern_low | 5,703 | 505,604 | 291,547 | 4,260,365 | 0.38 | 0.38 | 0.58 | 0.23 | 5 | 30 | 14.61 | 28.11 | 10.60 | https://analyzingalpha.com/bearish-high-wave-candlestick-pattern |
| 13,602 | forex | none | bearish_high_wave | 1 | indecision | bearish | 2 | atr-pattern_high | 1,059 | 123,303 | 67,197 | 643,247 | 0.21 | 0.21 | 0.54 | 0.40 | 75 | 21 | 9.57 | 11.34 | 8.37 | https://analyzingalpha.com/bearish-high-wave-candlestick-pattern |
| 13,770 | forex | uptrend | identical_three_crows | 3 | bearish reversal | bearish mean reversion | 5 | atr-pattern_high | 518 | 6,425 | 548 | 16,484 | 0.47 | 0.16 | 0.09 | 0.25 | 5 | 7 | 30.08 | 57.31 | 21.27 | https://analyzingalpha.com/identical-three-crows-candlestick-pattern |
| 13,774 | stock | uptrend | identical_three_crows | 3 | bearish reversal | bearish mean reversion | 4 | atr-pattern_high | 121 | 237 | 37 | 600 | 1.02 | 0.34 | 0.16 | 0.41 | 2 | 2 | 16.22 | 27.93 | 8.23 | https://analyzingalpha.com/identical-three-crows-candlestick-pattern |
| 13,860 | crypto | uptrend | identical_three_crows | 3 | bearish reversal | bullish mean reversion | 5 | atr-pattern_low | 75 | 185 | 95 | 1,634 | 0.83 | 0.28 | 0.51 | 0.31 | 3 | 3 | 17.20 | 22.41 | 14.91 | https://analyzingalpha.com/identical-three-crows-candlestick-pattern |
| 13,876 | crypto | uptrend | three_black_crows | 4 | bearish reversal | bearish mean reversion | 1 | atr-pattern_high | 1 | 5 | 3 | 10 | 0.34 | 0.08 | 0.60 | 0.67 | 2 | 1 | 3.33 | 4.50 | 1.00 | https://analyzingalpha.com/three-black-crows-candlestick-pattern |
| 13,882 | stock | uptrend | three_black_crows | 4 | bearish reversal | bearish mean reversion | 2 | atr-pattern_high | 87 | 185 | 23 | 131 | 0.31 | 0.08 | 0.12 | 0.44 | 2 | 2 | 5.70 | 7.20 | 4.54 | https://analyzingalpha.com/three-black-crows-candlestick-pattern |
| Market | Required Trend | Traditional Strategy | Strategy | Setup | Trades | Edge |
Market:
Required Trend:
Pattern:
Pattern Bars:
Traditional Strategy:
Strategy:
RR:
Setup:
Tickers:
Signals:
Trades:
Trade Bars:
Edge:
Edge Per Bar:
Confirm %:
Win %:
Cons Wins:
Cons Losses:
Avg. Trade Bars:
Avg. Win Bars:
Avg. Loss Bars:
Details:
To make things easier, I’ve created a table for each market showing the best candlestick patterns sorted by edge with at least 100 trades.
The Best Stock Market Candlestick Patterns
| Id | Market | Required Trend | Pattern | Pattern Bars | Traditional Strategy | Strategy | RR | Setup | Tickers | Signals | Trades | Trade Bars | Edge | Edge Per Bar | Confirm % | Win % | Cons Wins | Cons Losses | Avg. Trade Bars | Avg. Win Bars | Avg. Loss Bars | Details |
|---|---|---|---|---|---|---|---|---|---|---|---|---|---|---|---|---|---|---|---|---|---|---|
| 7,375 | stock | downtrend | unique_three_river_bottom | 3 | bullish reversal | bullish mean reversion | 5 | atr-pattern_low | 2,778 | 10,193 | 3,980 | 65,378 | 0.39 | 0.13 | 0.39 | 0.23 | 4 | 6 | 16.43 | 31.69 | 11.82 | https://analyzingalpha.com/unique-three-river-bottom-candlestick-pattern |
| 7,390 | stock | uptrend | bearish_harami | 2 | bearish reversal | bullish mean reversion | 5 | atr-pattern_low | 5,382 | 247,256 | 98,125 | 1,596,838 | 0.40 | 0.20 | 0.40 | 0.23 | 5 | 27 | 16.27 | 30.56 | 11.94 | https://analyzingalpha.com/bearish-harami-candlestick-pattern |
| 7,490 | stock | downtrend | matching_low | 2 | bullish reversal | bullish reversal | 5 | low-close | 5,670 | 154,436 | 142,463 | 458,668 | 0.45 | 0.22 | 0.92 | 0.24 | 8 | 32 | 3.22 | 5.07 | 2.63 | https://analyzingalpha.com/matching-low-candlestick-pattern |
| 7,520 | stock | none | rickshaw_man | 1 | indecision | bullish | 5 | atr-pattern_low | 6,025 | 814,858 | 482,729 | 4,949,451 | 0.34 | 0.34 | 0.59 | 0.22 | 4 | 25 | 10.25 | 19.27 | 7.65 | https://analyzingalpha.com/rickshaw-man-candlestick-pattern |
| 7,680 | stock | downtrend | stick_sandwich | 3 | bullish reversal | bearish continuation | 5 | high-close | 3,042 | 12,308 | 12,111 | 51,432 | 1.38 | 0.46 | 0.98 | 0.40 | 8 | 10 | 4.25 | 4.26 | 4.24 | https://analyzingalpha.com/stick-sandwich-candlestick-pattern |
| 7,777 | stock | none | bearish_kicking | 2 | bearish | bearish | 2 | atr-pattern_high | 176 | 508 | 74 | 719 | 0.54 | 0.27 | 0.15 | 0.51 | 2 | 2 | 9.72 | 10.29 | 9.11 | https://analyzingalpha.com/bearish-kicking-candlestick-pattern |
| 7,795 | stock | downtrend | homing_pigeon | 2 | bullish reversal | bullish mean reversion | 5 | atr-pattern_low | 5,103 | 94,059 | 47,602 | 845,411 | 0.44 | 0.22 | 0.51 | 0.24 | 5 | 20 | 17.76 | 33.41 | 12.84 | https://analyzingalpha.com/homing-pigeon-candlestick-pattern |
| 7,960 | stock | downtrend | thrusting | 2 | bearish continuation | bullish mean reversion | 5 | atr-pattern_low | 4,471 | 50,017 | 20,602 | 416,671 | 0.38 | 0.19 | 0.41 | 0.23 | 5 | 14 | 20.22 | 38.19 | 14.88 | https://analyzingalpha.com/thrusting-candlestick-pattern |
| 8,035 | stock | none | bullish_short_line | 1 | indecision | bearish | 5 | high-close | 6,574 | 1,275,995 | 1,106,449 | 1,771,269 | 0.56 | 0.56 | 0.87 | 0.26 | 401 | 70 | 1.60 | 2.07 | 1.43 | https://analyzingalpha.com/bullish-short-line-candlestick-pattern |
| 8,050 | stock | none | bullish_closing_marubozu | 1 | bullish | bearish | 5 | high-close | 6,448 | 1,217,570 | 1,116,973 | 1,340,142 | 0.68 | 0.68 | 0.92 | 0.28 | 382 | 49 | 1.20 | 1.38 | 1.13 | https://analyzingalpha.com/bullish-closing-marubozu-candlestick-pattern |
| 8,075 | stock | downtrend | morning_doji_star | 3 | bullish reversal | bullish mean reversion | 5 | atr-pattern_low | 2,904 | 11,167 | 2,349 | 41,474 | 0.40 | 0.13 | 0.21 | 0.23 | 3 | 6 | 17.66 | 34.77 | 12.46 | https://analyzingalpha.com/morning-doji-star-candlestick-pattern |
| 8,290 | stock | uptrend | three_outside_down | 3 | bearish reversal | bullish mean reversion | 5 | atr-pattern_low | 4,709 | 101,187 | 60,577 | 979,791 | 0.40 | 0.13 | 0.60 | 0.23 | 7 | 22 | 16.17 | 29.48 | 12.12 | https://analyzingalpha.com/three-outside-down-candlestick-pattern |
| 8,305 | stock | uptrend | upside_gap_three_methods | 3 | bullish continuation | bullish mean reversion | 5 | atr-pattern_low | 3,320 | 23,240 | 10,673 | 180,695 | 0.40 | 0.13 | 0.46 | 0.23 | 4 | 11 | 16.93 | 31.88 | 12.38 | https://analyzingalpha.com/upside-gap-three-methods-candlestick-pattern |
| 8,420 | stock | downtrend | hammer | 1 | bullish reversal | bearish continuation | 5 | high-close | 5,886 | 208,980 | 190,149 | 389,372 | 0.44 | 0.44 | 0.91 | 0.24 | 63 | 37 | 2.05 | 2.89 | 1.78 | https://analyzingalpha.com/hammer-candlestick-pattern |
| 8,430 | stock | downtrend | on_neck | 2 | bearish continuation | bullish mean reversion | 5 | atr-pattern_low | 3,699 | 21,789 | 10,912 | 180,912 | 0.36 | 0.18 | 0.50 | 0.23 | 5 | 9 | 16.58 | 31.52 | 12.23 | https://analyzingalpha.com/on-neck-candlestick-pattern |
| 8,505 | stock | uptrend | bearish_harami_cross | 2 | bearish reversal | bullish mean reversion | 5 | atr-pattern_low | 4,784 | 99,585 | 37,470 | 556,322 | 0.40 | 0.20 | 0.38 | 0.23 | 4 | 18 | 14.85 | 27.92 | 10.85 | https://analyzingalpha.com/bearish-harami-cross-candlestick-pattern |
| 8,540 | stock | none | bearish_closing_marubozu | 1 | bearish | bullish | 5 | low-close | 6,434 | 1,140,569 | 1,056,137 | 1,228,935 | 0.64 | 0.64 | 0.93 | 0.27 | 10 | 30 | 1.16 | 1.29 | 1.11 | https://analyzingalpha.com/bearish-closing-marubozu-candlestick-pattern |
| 8,630 | stock | none | gravestone_doji | 1 | indecision | bullish | 5 | low-close | 6,104 | 336,640 | 311,916 | 395,573 | 0.75 | 0.75 | 0.93 | 0.29 | 14 | 35 | 1.27 | 1.42 | 1.21 | https://analyzingalpha.com/gravestone-doji-candlestick-pattern |
| 8,720 | stock | uptrend | upside_tasuki_gap | 3 | bullish continuation | bullish mean reversion | 5 | atr-pattern_low | 3,065 | 18,861 | 6,871 | 106,473 | 0.44 | 0.15 | 0.36 | 0.24 | 4 | 8 | 15.50 | 30.62 | 10.75 | https://analyzingalpha.com/upside-tasuki-gap-candlestick-pattern |
| 8,745 | stock | uptrend | advance_block | 3 | bearish reversal | bullish mean reversion | 5 | atr-pattern_low | 4,086 | 58,824 | 6,135 | 87,596 | 0.44 | 0.15 | 0.10 | 0.24 | 4 | 8 | 14.28 | 26.01 | 10.60 | https://analyzingalpha.com/advance-block-candlestick-pattern |
| 8,945 | stock | none | long_legged_doji | 1 | indecision | bullish | 5 | atr-pattern_low | 6,472 | 1,031,959 | 587,487 | 6,887,151 | 0.34 | 0.34 | 0.57 | 0.22 | 5 | 34 | 11.72 | 22.53 | 8.62 | https://analyzingalpha.com/long-legged-doji-candlestick-pattern |
| 8,990 | stock | none | bearish_spinning_top | 1 | indecision | bullish | 5 | atr-pattern_low | 5,895 | 703,725 | 410,370 | 6,071,340 | 0.37 | 0.37 | 0.58 | 0.23 | 4 | 24 | 14.79 | 28.40 | 10.77 | https://analyzingalpha.com/bearish-spinning-top-candlestick-pattern |
| 9,090 | stock | downtrend | concealing_baby_swallow | 4 | bullish reversal | bullish reversal | 5 | low-close | 4 | 8 | 8 | 11 | 0.50 | 0.13 | 1.00 | 0.25 | 2 | 2 | 1.38 | 1.00 | 1.50 | https://analyzingalpha.com/concealing-baby-swallow-candlestick-pattern |
| 9,130 | stock | downtrend | piercing | 2 | bullish reversal | bullish mean reversion | 5 | atr-pattern_low | 3,541 | 21,214 | 6,765 | 153,566 | 0.43 | 0.22 | 0.32 | 0.24 | 3 | 8 | 22.70 | 43.48 | 16.23 | https://analyzingalpha.com/piercing-candlestick-pattern |
| 9,145 | stock | uptrend | bearish_engulfing | 2 | bearish reversal | bullish mean reversion | 5 | atr-pattern_low | 5,246 | 214,991 | 134,351 | 2,317,605 | 0.38 | 0.19 | 0.62 | 0.23 | 5 | 32 | 17.25 | 32.38 | 12.75 | https://analyzingalpha.com/bearish-engulfing-candlestick-pattern |
| 9,205 | stock | uptrend | bullish_harami_cross | 2 | bullish reversal | bullish mean reversion | 5 | atr-pattern_low | 5,305 | 102,763 | 49,179 | 811,760 | 0.42 | 0.21 | 0.48 | 0.24 | 5 | 23 | 16.51 | 31.22 | 12.00 | https://analyzingalpha.com/bullish-harami-cross-candlestick-pattern |
| 9,280 | stock | uptrend | evening_star | 3 | bearish reversal | bullish mean reversion | 5 | atr-pattern_low | 3,972 | 37,082 | 20,155 | 366,216 | 0.39 | 0.13 | 0.54 | 0.23 | 5 | 14 | 18.17 | 33.40 | 13.57 | https://analyzingalpha.com/evening-star-candlestick-pattern |
| 9,370 | stock | downtrend | three_white_soldiers | 3 | bullish reversal | bullish reversal | 5 | low-close | 436 | 926 | 788 | 51,649 | 0.45 | 0.15 | 0.85 | 0.24 | 3 | 4 | 65.54 | 135.06 | 43.30 | https://analyzingalpha.com/three-white-soldiers-candlestick-pattern |
| 9,455 | stock | none | bullish_kicking | 2 | bullish | bullish | 5 | low-close | 216 | 605 | 349 | 19,398 | 0.93 | 0.46 | 0.58 | 0.32 | 4 | 4 | 55.58 | 91.92 | 38.41 | https://analyzingalpha.com/bullish-kicking-candlestick-pattern |
| 9,470 | stock | uptrend | dark_cloud_cover | 2 | bearish reversal | bullish mean reversion | 5 | atr-pattern_low | 3,834 | 30,976 | 16,379 | 331,221 | 0.42 | 0.21 | 0.53 | 0.24 | 6 | 13 | 20.22 | 37.90 | 14.75 | https://analyzingalpha.com/dark-cloud-cover-candlestick-pattern |
| 9,720 | stock | downtrend | bullish_belt_hold | 1 | bullish reversal | bullish mean reversion | 5 | atr-pattern_low | 6,466 | 372,105 | 133,186 | 3,120,788 | 0.42 | 0.42 | 0.36 | 0.24 | 6 | 36 | 23.43 | 45.02 | 16.78 | https://analyzingalpha.com/bullish-belt-hold-candlestick-pattern |
| 9,840 | stock | downtrend | ladder_bottom | 5 | bullish reversal | bullish reversal | 5 | low-close | 2,331 | 8,433 | 7,661 | 233,093 | 0.44 | 0.09 | 0.91 | 0.24 | 4 | 9 | 30.43 | 62.41 | 20.35 | https://analyzingalpha.com/ladder-bottom-candlestick-pattern |
| 9,870 | stock | uptrend | stalled | 3 | bearish reversal | bullish mean reversion | 5 | atr-pattern_low | 3,365 | 25,999 | 2,364 | 34,515 | 0.46 | 0.15 | 0.09 | 0.24 | 2 | 6 | 14.60 | 26.92 | 10.65 | https://analyzingalpha.com/stalled-candlestick-pattern |
| 9,900 | stock | downtrend | downside_tasuki_gap | 3 | bearish continuation | bullish mean reversion | 5 | atr-pattern_low | 3,270 | 17,043 | 6,090 | 121,678 | 0.52 | 0.17 | 0.36 | 0.25 | 4 | 7 | 19.98 | 42.66 | 12.29 | https://analyzingalpha.com/downside-tasuki-gap-candlestick-pattern |
| 10,075 | stock | downtrend | takuri | 1 | bullish reversal | bearish continuation | 5 | high-close | 5,963 | 172,648 | 158,347 | 207,031 | 0.86 | 0.86 | 0.92 | 0.31 | 162 | 32 | 1.31 | 1.49 | 1.23 | https://analyzingalpha.com/takuri-candlestick-pattern |
| 10,105 | stock | downtrend | bullish_abandoned_baby | 3 | bullish reversal | bullish reversal | 5 | low-high | 30 | 63 | 41 | 1,203 | 0.76 | 0.25 | 0.65 | 0.29 | 3 | 2 | 29.34 | 54.00 | 19.14 | https://analyzingalpha.com/bullish-abandoned-baby-candlestick-pattern |
| 10,110 | stock | downtrend | bullish_breakaway | 5 | bullish reversal | bullish reversal | 5 | low-close | 37 | 73 | 67 | 2,814 | 0.97 | 0.19 | 0.92 | 0.33 | 2 | 2 | 42.00 | 70.18 | 28.22 | https://analyzingalpha.com/bullish-breakaway-candlestick-pattern |
| 10,230 | stock | none | bullish_spinning_top | 1 | indecision | bullish | 5 | atr-pattern_low | 6,203 | 829,243 | 443,803 | 6,190,567 | 0.37 | 0.37 | 0.54 | 0.23 | 7 | 49 | 13.95 | 26.48 | 10.26 | https://analyzingalpha.com/bullish-spinning-top-candlestick-pattern |
| 10,295 | stock | uptrend | bearish_doji_star | 2 | bearish reversal | bullish mean reversion | 5 | atr-pattern_low | 4,834 | 119,856 | 29,339 | 409,954 | 0.40 | 0.20 | 0.24 | 0.23 | 5 | 15 | 13.97 | 25.89 | 10.35 | https://analyzingalpha.com/bearish-doji-star-candlestick-pattern |
| 10,310 | stock | downtrend | falling_three_methods | 5 | bearish continuation | bearish mean reversion | 5 | atr-pattern_high | 103 | 220 | 22 | 396 | 0.64 | 0.13 | 0.10 | 0.27 | 1 | 2 | 18.00 | 24.67 | 15.50 | https://analyzingalpha.com/falling-three-methods-candlestick-pattern |
| 10,355 | stock | uptrend | up_gap_side_by_side | 3 | bullish continuation | bullish continuation | 5 | low-high | 4,120 | 39,114 | 22,581 | 547,060 | 0.50 | 0.17 | 0.58 | 0.25 | 5 | 17 | 24.23 | 45.21 | 17.27 | https://analyzingalpha.com/up-gap-side-by-side-candlestick-pattern |
| 10,410 | stock | downtrend | inverted_hammer | 1 | bullish reversal | bullish reversal | 5 | low-close | 5,725 | 178,745 | 167,397 | 248,124 | 0.68 | 0.68 | 0.94 | 0.28 | 5 | 30 | 1.48 | 1.78 | 1.37 | https://analyzingalpha.com/inverted-hammer-candlestick-pattern |
| 10,790 | stock | downtrend | down_gap_side_by_side | 3 | bearish continuation | bullish mean reversion | 5 | atr-pattern_low | 3,417 | 38,239 | 11,357 | 126,016 | 0.25 | 0.08 | 0.30 | 0.21 | 3 | 20 | 11.10 | 21.79 | 8.29 | https://analyzingalpha.com/down-gap-side-by-side-candlestick-pattern |
| 10,955 | stock | uptrend | bearish_belt_hold | 1 | bearish reversal | bullish mean reversion | 5 | atr-pattern_low | 5,825 | 334,837 | 206,551 | 4,694,609 | 0.39 | 0.39 | 0.62 | 0.23 | 5 | 32 | 22.73 | 43.58 | 16.42 | https://analyzingalpha.com/bearish-belt-hold-candlestick-pattern |
| 11,130 | stock | none | bullish_high_wave | 1 | indecision | bullish | 5 | atr-pattern_low | 6,159 | 654,201 | 358,472 | 4,875,542 | 0.37 | 0.37 | 0.55 | 0.23 | 6 | 44 | 13.60 | 25.69 | 10.05 | https://analyzingalpha.com/bullish-high-wave-candlestick-pattern |
| 11,145 | stock | none | doji | 1 | indecision | bullish | 5 | low-close | 6,600 | 1,800,984 | 1,545,762 | 6,027,624 | 0.44 | 0.44 | 0.86 | 0.24 | 15 | 33 | 3.90 | 6.24 | 3.16 | https://analyzingalpha.com/doji-candlestick-pattern |
| 11,160 | stock | downtrend | three_outside_up | 3 | bullish reversal | bullish reversal | 5 | low-close | 4,824 | 65,517 | 59,210 | 2,014,139 | 0.35 | 0.12 | 0.90 | 0.23 | 5 | 23 | 34.02 | 71.71 | 23.06 | https://analyzingalpha.com/three-outside-up-candlestick-pattern |
| 11,255 | stock | uptrend | bullish_three_line_strike | 4 | bullish continuation | bullish mean reversion | 5 | atr-pattern_low | 1,015 | 2,617 | 1,669 | 27,837 | 0.38 | 0.09 | 0.64 | 0.23 | 3 | 5 | 16.68 | 29.76 | 12.78 | https://analyzingalpha.com/bullish-three-line-strike-candlestick-pattern |
| 11,270 | stock | uptrend | evening_doji_star | 3 | bearish reversal | bullish mean reversion | 5 | atr-pattern_low | 3,034 | 13,605 | 7,387 | 125,543 | 0.35 | 0.12 | 0.54 | 0.23 | 4 | 11 | 17.00 | 32.93 | 12.38 | https://analyzingalpha.com/evening-doji-star-candlestick-pattern |
| 11,285 | stock | downtrend | bullish_engulfing | 2 | bullish reversal | bullish mean reversion | 5 | atr-pattern_low | 5,580 | 173,575 | 51,006 | 897,339 | 0.39 | 0.20 | 0.29 | 0.23 | 7 | 21 | 17.59 | 33.74 | 12.71 | https://analyzingalpha.com/bullish-engulfing-candlestick-pattern |
| 11,425 | stock | none | bullish_long_line | 1 | bullish | bearish | 5 | high-close | 6,449 | 1,459,096 | 1,336,824 | 1,811,548 | 0.45 | 0.45 | 0.92 | 0.24 | 303 | 46 | 1.36 | 1.70 | 1.24 | https://analyzingalpha.com/bullish-long-line-candlestick-pattern |
| 11,455 | stock | uptrend | upside_gap_two_crows | 3 | bearish reversal | bullish mean reversion | 5 | atr-pattern_low | 825 | 2,104 | 500 | 8,470 | 0.57 | 0.19 | 0.24 | 0.26 | 2 | 3 | 16.94 | 27.82 | 13.08 | https://analyzingalpha.com/upside-gap-two-crows-candlestick-pattern |
| 11,485 | stock | downtrend | three_white_soldiers | 3 | bullish reversal | bullish reversal | 5 | low-high | 436 | 926 | 773 | 52,028 | 0.45 | 0.15 | 0.83 | 0.24 | 3 | 4 | 67.31 | 138.20 | 44.68 | https://analyzingalpha.com/three-white-soldiers-candlestick-pattern |
| 11,530 | stock | downtrend | morning_star | 3 | bullish reversal | bullish reversal | 5 | low-close | 4,034 | 30,525 | 27,133 | 847,077 | 0.37 | 0.12 | 0.89 | 0.23 | 5 | 17 | 31.22 | 65.16 | 21.25 | https://analyzingalpha.com/morning-star-candlestick-pattern |
| 11,620 | stock | uptrend | shooting_star | 1 | bearish reversal | bullish mean reversion | 5 | atr-pattern_low | 4,631 | 95,153 | 61,841 | 929,151 | 0.38 | 0.38 | 0.65 | 0.23 | 5 | 21 | 15.02 | 28.66 | 10.96 | https://analyzingalpha.com/shooting-star-candlestick-pattern |
| 11,665 | stock | none | dragonfly_doji | 1 | indecision | bearish | 5 | high-close | 6,133 | 379,937 | 351,320 | 455,731 | 0.83 | 0.83 | 0.92 | 0.31 | 286 | 42 | 1.30 | 1.49 | 1.21 | https://analyzingalpha.com/dragonfly-doji-candlestick-pattern |
| 11,740 | stock | downtrend | bearish_separating_lines | 2 | bearish continuation | bullish mean reversion | 5 | atr-pattern_low | 4,213 | 38,591 | 19,951 | 376,021 | 0.34 | 0.17 | 0.52 | 0.22 | 6 | 16 | 18.85 | 36.39 | 13.80 | https://analyzingalpha.com/bearish-separating-lines-candlestick-pattern |
| 11,820 | stock | uptrend | bullish_separating_lines | 2 | bullish continuation | bullish mean reversion | 5 | atr-pattern_low | 3,616 | 24,055 | 5,197 | 91,562 | 0.49 | 0.24 | 0.22 | 0.25 | 4 | 7 | 17.62 | 31.39 | 13.11 | https://analyzingalpha.com/bullish-separating-lines-candlestick-pattern |
| 12,045 | stock | uptrend | three_inside_down | 3 | bearish reversal | bullish mean reversion | 5 | atr-pattern_low | 3,832 | 37,529 | 23,705 | 424,254 | 0.45 | 0.15 | 0.63 | 0.24 | 5 | 16 | 17.90 | 33.58 | 12.90 | https://analyzingalpha.com/three-inside-down-candlestick-pattern |
| 12,070 | stock | uptrend | bearish_tri_star | 3 | bearish reversal | bearish reversal | 5 | high-close | 2,141 | 9,920 | 7,580 | 83,573 | 0.38 | 0.13 | 0.76 | 0.23 | 10 | 10 | 11.03 | 14.50 | 9.99 | https://analyzingalpha.com/bearish-tri-star-candlestick-pattern |
| 12,085 | stock | none | bearish_marubozu | 1 | bearish | bullish | 5 | low-close | 6,299 | 553,338 | 503,377 | 630,444 | 0.76 | 0.76 | 0.91 | 0.29 | 9 | 33 | 1.25 | 1.42 | 1.18 | https://analyzingalpha.com/bearish-marubozu-candlestick-pattern |
| 12,340 | stock | uptrend | two_crows | 3 | bearish reversal | bullish mean reversion | 5 | atr-pattern_low | 1,665 | 4,884 | 1,987 | 30,456 | 0.34 | 0.11 | 0.41 | 0.22 | 2 | 5 | 15.33 | 28.09 | 11.67 | https://analyzingalpha.com/two-crows-candlestick-pattern |
| 12,390 | stock | uptrend | rising_three_methods | 5 | bullish continuation | bullish mean reversion | 5 | atr-pattern_low | 146 | 315 | 40 | 627 | 0.80 | 0.16 | 0.13 | 0.30 | 2 | 2 | 15.68 | 21.00 | 13.39 | https://analyzingalpha.com/rising-three-methods-candlestick-pattern |
| 12,428 | stock | uptrend | bearish_breakaway | 5 | bearish reversal | bearish mean reversion | 3 | atr-pattern_high | 77 | 164 | 32 | 245 | 0.88 | 0.18 | 0.20 | 0.47 | 2 | 2 | 7.66 | 11.07 | 4.65 | https://analyzingalpha.com/bearish-breakaway-candlestick-pattern |
| 12,508 | stock | uptrend | bearish_abandoned_baby | 3 | bearish reversal | bearish reversal | 3 | high-close | 36 | 87 | 59 | 1,063 | 0.43 | 0.14 | 0.68 | 0.36 | 3 | 2 | 18.02 | 16.29 | 18.97 | https://analyzingalpha.com/bearish-abandoned-baby-candlestick-pattern |
| 12,585 | stock | uptrend | bearish_counterattack | 2 | bearish reversal | bullish continuation | 5 | low-close | 1,806 | 5,734 | 4,995 | 18,577 | 0.42 | 0.21 | 0.87 | 0.24 | 4 | 10 | 3.72 | 6.21 | 2.96 | https://analyzingalpha.com/bearish-counterattack-candlestick-pattern |
| 12,610 | stock | downtrend | in_neck | 2 | bearish continuation | bullish mean reversion | 5 | atr-pattern_low | 3,123 | 13,308 | 6,179 | 106,471 | 0.34 | 0.17 | 0.46 | 0.22 | 3 | 7 | 17.23 | 34.35 | 12.33 | https://analyzingalpha.com/in-neck-candlestick-pattern |
| 12,690 | stock | downtrend | three_inside_up | 3 | bullish reversal | bullish mean reversion | 5 | atr-pattern_low | 4,279 | 41,668 | 7,510 | 129,083 | 0.47 | 0.16 | 0.18 | 0.25 | 4 | 9 | 17.19 | 31.16 | 12.64 | https://analyzingalpha.com/three-inside-up-candlestick-pattern |
| 12,720 | stock | downtrend | bullish_tri_star | 3 | bullish reversal | bullish reversal | 5 | low-close | 2,137 | 10,751 | 7,763 | 75,224 | 0.55 | 0.18 | 0.72 | 0.26 | 5 | 13 | 9.69 | 15.06 | 7.83 | https://analyzingalpha.com/bullish-tri-star-candlestick-pattern |
| 12,760 | stock | none | bearish_long_line | 1 | bearish | bullish | 5 | low-close | 6,448 | 1,478,970 | 1,371,434 | 1,845,370 | 0.44 | 0.44 | 0.93 | 0.24 | 10 | 38 | 1.35 | 1.67 | 1.24 | https://analyzingalpha.com/bearish-long-line-candlestick-pattern |
| 12,900 | stock | uptrend | hanging_man | 1 | bearish reversal | bearish reversal | 5 | high-close | 5,365 | 251,679 | 235,131 | 363,848 | 0.75 | 0.75 | 0.93 | 0.29 | 129 | 36 | 1.55 | 1.87 | 1.41 | https://analyzingalpha.com/hanging-man-candlestick-pattern |
| 13,035 | stock | downtrend | downside_gap_three_methods | 3 | bearish continuation | bullish mean reversion | 5 | atr-pattern_low | 3,631 | 22,691 | 6,234 | 110,680 | 0.37 | 0.12 | 0.27 | 0.23 | 3 | 8 | 17.75 | 35.15 | 12.65 | https://analyzingalpha.com/downside-gap-three-methods-candlestick-pattern |
| 13,065 | stock | none | bearish_short_line | 1 | indecision | bullish | 5 | low-close | 6,326 | 1,035,656 | 952,151 | 1,430,453 | 0.34 | 0.34 | 0.92 | 0.22 | 7 | 34 | 1.50 | 1.98 | 1.36 | https://analyzingalpha.com/bearish-short-line-candlestick-pattern |
| 13,100 | stock | none | bullish_marubozu | 1 | bullish | bearish | 5 | high-close | 6,251 | 561,791 | 507,105 | 670,108 | 0.86 | 0.86 | 0.90 | 0.31 | 282 | 44 | 1.32 | 1.56 | 1.22 | https://analyzingalpha.com/bullish-marubozu-candlestick-pattern |
| 13,120 | stock | downtrend | bullish_harami | 2 | bullish reversal | bullish mean reversion | 5 | atr-pattern_low | 5,851 | 255,080 | 114,478 | 2,042,596 | 0.42 | 0.21 | 0.45 | 0.24 | 5 | 26 | 17.84 | 33.78 | 12.93 | https://analyzingalpha.com/bullish-harami-candlestick-pattern |
| 13,275 | stock | downtrend | bullish_doji_star | 2 | bullish reversal | bullish reversal | 5 | low-close | 5,259 | 104,735 | 95,509 | 409,068 | 0.52 | 0.26 | 0.91 | 0.25 | 8 | 34 | 4.28 | 6.89 | 3.40 | https://analyzingalpha.com/bullish-doji-star-candlestick-pattern |
| 13,319 | stock | downtrend | bearish_three_line_strike | 4 | bearish continuation | bullish mean reversion | 4 | atr-pattern_low | 702 | 1,706 | 290 | 4,533 | 0.49 | 0.12 | 0.17 | 0.30 | 2 | 2 | 15.63 | 25.24 | 11.58 | https://analyzingalpha.com/bearish-three-line-strike-candlestick-pattern |
| 13,365 | stock | downtrend | bullish_counterattack | 2 | bullish reversal | bearish continuation | 5 | high-close | 1,534 | 4,964 | 4,385 | 15,420 | 0.62 | 0.31 | 0.88 | 0.27 | 11 | 8 | 3.52 | 4.46 | 3.17 | https://analyzingalpha.com/bullish-counterattack-candlestick-pattern |
| 13,545 | stock | none | bearish_high_wave | 1 | indecision | bullish | 5 | atr-pattern_low | 5,703 | 505,604 | 291,547 | 4,260,365 | 0.38 | 0.38 | 0.58 | 0.23 | 5 | 30 | 14.61 | 28.11 | 10.60 | https://analyzingalpha.com/bearish-high-wave-candlestick-pattern |
| 13,774 | stock | uptrend | identical_three_crows | 3 | bearish reversal | bearish mean reversion | 4 | atr-pattern_high | 121 | 237 | 37 | 600 | 1.02 | 0.34 | 0.16 | 0.41 | 2 | 2 | 16.22 | 27.93 | 8.23 | https://analyzingalpha.com/identical-three-crows-candlestick-pattern |
| 13,882 | stock | uptrend | three_black_crows | 4 | bearish reversal | bearish mean reversion | 2 | atr-pattern_high | 87 | 185 | 23 | 131 | 0.31 | 0.08 | 0.12 | 0.44 | 2 | 2 | 5.70 | 7.20 | 4.54 | https://analyzingalpha.com/three-black-crows-candlestick-pattern |
Market:
Required Trend:
Pattern:
Pattern Bars:
Traditional Strategy:
Strategy:
RR:
Setup:
Tickers:
Signals:
Trades:
Trade Bars:
Edge:
Edge Per Bar:
Confirm %:
Win %:
Cons Wins:
Cons Losses:
Avg. Trade Bars:
Avg. Win Bars:
Avg. Loss Bars:
Details:
The Best Forex Candlestick Patterns
| Id | Market | Required Trend | Pattern | Pattern Bars | Traditional Strategy | Strategy | RR | Setup | Tickers | Signals | Trades | Trade Bars | Edge | Edge Per Bar | Confirm % | Win % | Cons Wins | Cons Losses | Avg. Trade Bars | Avg. Win Bars | Avg. Loss Bars | Details |
|---|---|---|---|---|---|---|---|---|---|---|---|---|---|---|---|---|---|---|---|---|---|---|
| 7,420 | forex | none | long_legged_doji | 1 | indecision | bearish | 5 | high-close | 1,220 | 336,852 | 318,685 | 1,344,783 | 0.39 | 0.39 | 0.95 | 0.23 | 1,619 | 50 | 4.22 | 6.28 | 3.60 | https://analyzingalpha.com/long-legged-doji-candlestick-pattern |
| 7,440 | forex | downtrend | down_gap_side_by_side | 3 | bearish continuation | bullish reversal | 5 | low-close | 200 | 751 | 698 | 4,237 | 1.09 | 0.36 | 0.93 | 0.35 | 6 | 9 | 6.07 | 2.10 | 8.18 | https://analyzingalpha.com/down-gap-side-by-side-candlestick-pattern |
| 7,485 | forex | downtrend | matching_low | 2 | bullish reversal | bullish reversal | 5 | low-close | 1,193 | 59,071 | 57,532 | 188,912 | 0.80 | 0.40 | 0.97 | 0.30 | 106 | 131 | 3.28 | 3.58 | 3.16 | https://analyzingalpha.com/matching-low-candlestick-pattern |
| 7,608 | forex | uptrend | evening_doji_star | 3 | bearish reversal | bearish mean reversion | 3 | atr-pattern_high | 297 | 890 | 160 | 2,808 | 0.48 | 0.16 | 0.18 | 0.37 | 2 | 3 | 17.55 | 26.12 | 12.54 | https://analyzingalpha.com/evening-doji-star-candlestick-pattern |
| 7,707 | forex | uptrend | bullish_separating_lines | 2 | bullish continuation | bearish mean reversion | 2 | atr-pattern_high | 913 | 7,008 | 4,102 | 63,136 | 0.34 | 0.17 | 0.59 | 0.45 | 21 | 10 | 15.39 | 17.06 | 14.06 | https://analyzingalpha.com/bullish-separating-lines-candlestick-pattern |
| 8,030 | forex | none | bullish_short_line | 1 | indecision | bearish | 5 | high-close | 1,276 | 619,384 | 557,225 | 643,027 | 0.93 | 0.93 | 0.90 | 0.32 | 498 | 52 | 1.15 | 1.21 | 1.13 | https://analyzingalpha.com/bullish-short-line-candlestick-pattern |
| 8,045 | forex | none | bullish_closing_marubozu | 1 | bullish | bearish | 5 | high-close | 1,284 | 328,958 | 283,662 | 323,116 | 1.86 | 1.86 | 0.86 | 0.48 | 593 | 67 | 1.14 | 1.14 | 1.14 | https://analyzingalpha.com/bullish-closing-marubozu-candlestick-pattern |
| 8,067 | forex | downtrend | morning_doji_star | 3 | bullish reversal | bullish mean reversion | 2 | atr-pattern_low | 221 | 589 | 115 | 1,186 | 0.33 | 0.11 | 0.20 | 0.44 | 2 | 2 | 10.31 | 10.98 | 9.78 | https://analyzingalpha.com/morning-doji-star-candlestick-pattern |
| 8,132 | forex | uptrend | up_gap_side_by_side | 3 | bullish continuation | bearish mean reversion | 2 | atr-pattern_high | 515 | 2,211 | 1,218 | 16,310 | 0.41 | 0.14 | 0.55 | 0.47 | 11 | 7 | 13.39 | 14.11 | 12.75 | https://analyzingalpha.com/up-gap-side-by-side-candlestick-pattern |
| 8,207 | forex | downtrend | downside_gap_three_methods | 3 | bearish continuation | bearish mean reversion | 2 | atr-pattern_high | 454 | 2,189 | 828 | 8,399 | 0.28 | 0.09 | 0.38 | 0.43 | 5 | 3 | 10.14 | 11.41 | 9.20 | https://analyzingalpha.com/downside-gap-three-methods-candlestick-pattern |
| 8,327 | forex | uptrend | evening_star | 3 | bearish reversal | bearish mean reversion | 2 | atr-pattern_high | 544 | 2,766 | 431 | 3,720 | 0.40 | 0.13 | 0.16 | 0.47 | 4 | 3 | 8.63 | 10.72 | 6.81 | https://analyzingalpha.com/evening-star-candlestick-pattern |
| 8,415 | forex | downtrend | hammer | 1 | bullish reversal | bearish continuation | 5 | high-close | 1,193 | 64,778 | 61,780 | 100,056 | 0.23 | 0.23 | 0.95 | 0.21 | 73 | 81 | 1.62 | 2.30 | 1.44 | https://analyzingalpha.com/hammer-candlestick-pattern |
| 8,520 | forex | none | doji | 1 | indecision | bearish | 5 | high-close | 1,285 | 733,323 | 635,089 | 1,656,767 | 0.91 | 0.91 | 0.87 | 0.32 | 668 | 51 | 2.61 | 2.91 | 2.47 | https://analyzingalpha.com/doji-candlestick-pattern |
| 8,535 | forex | none | bearish_closing_marubozu | 1 | bearish | bullish | 5 | low-close | 1,279 | 333,203 | 288,313 | 320,640 | 2.01 | 2.01 | 0.87 | 0.50 | 88 | 43 | 1.11 | 1.08 | 1.14 | https://analyzingalpha.com/bearish-closing-marubozu-candlestick-pattern |
| 8,595 | forex | downtrend | bullish_tri_star | 3 | bullish reversal | bearish continuation | 5 | high-close | 67 | 230 | 221 | 1,531 | 0.46 | 0.15 | 0.96 | 0.24 | 12 | 16 | 6.93 | 7.61 | 6.71 | https://analyzingalpha.com/bullish-tri-star-candlestick-pattern |
| 8,625 | forex | none | gravestone_doji | 1 | indecision | bullish | 5 | low-close | 1,190 | 88,914 | 83,987 | 105,840 | 1.62 | 1.62 | 0.94 | 0.44 | 177 | 44 | 1.26 | 1.16 | 1.34 | https://analyzingalpha.com/gravestone-doji-candlestick-pattern |
| 8,722 | forex | uptrend | bearish_breakaway | 5 | bearish reversal | bearish reversal | 2 | high-low | 1 | 2 | 1 | 1 | 2.00 | 0.40 | 0.50 | 1.00 | 1 | 0 | 1.00 | 1.00 | https://analyzingalpha.com/bearish-breakaway-candlestick-pattern | |
| 8,808 | forex | uptrend | bullish_three_line_strike | 4 | bullish continuation | bearish mean reversion | 3 | atr-pattern_high | 471 | 2,106 | 454 | 5,517 | 0.32 | 0.08 | 0.22 | 0.33 | 3 | 4 | 12.15 | 14.72 | 10.88 | https://analyzingalpha.com/bullish-three-line-strike-candlestick-pattern |
| 8,855 | forex | uptrend | stalled | 3 | bearish reversal | bearish reversal | 5 | high-close | 961 | 7,303 | 5,836 | 14,504 | 1.80 | 0.60 | 0.80 | 0.47 | 24 | 11 | 2.49 | 2.13 | 2.80 | https://analyzingalpha.com/stalled-candlestick-pattern |
| 8,867 | forex | none | bearish_spinning_top | 1 | indecision | bearish | 2 | atr-pattern_high | 1,087 | 178,187 | 94,110 | 849,993 | 0.20 | 0.20 | 0.53 | 0.40 | 98 | 16 | 9.03 | 10.67 | 7.93 | https://analyzingalpha.com/bearish-spinning-top-candlestick-pattern |
| 8,910 | forex | downtrend | on_neck | 2 | bearish continuation | bearish continuation | 5 | high-low | 3 | 6 | 3 | 93 | 3.01 | 1.50 | 0.50 | 0.67 | 1 | 1 | 31.00 | 39.00 | 15.00 | https://analyzingalpha.com/on-neck-candlestick-pattern |
| 9,008 | forex | downtrend | thrusting | 2 | bearish continuation | bearish mean reversion | 3 | atr-pattern_high | 57 | 142 | 22 | 362 | 0.83 | 0.41 | 0.15 | 0.46 | 1 | 1 | 16.45 | 13.40 | 19.00 | https://analyzingalpha.com/thrusting-candlestick-pattern |
| 9,053 | forex | none | bullish_spinning_top | 1 | indecision | bearish | 3 | atr-pattern_high | 1,126 | 162,136 | 95,099 | 1,275,338 | 0.23 | 0.23 | 0.59 | 0.31 | 101 | 31 | 13.41 | 18.86 | 11.01 | https://analyzingalpha.com/bullish-spinning-top-candlestick-pattern |
| 9,413 | forex | downtrend | falling_three_methods | 5 | bearish continuation | bullish mean reversion | 3 | atr-pattern_low | 83 | 184 | 130 | 1,322 | 0.51 | 0.10 | 0.71 | 0.38 | 2 | 4 | 10.17 | 16.80 | 6.16 | https://analyzingalpha.com/falling-three-methods-candlestick-pattern |
| 9,426 | forex | downtrend | bullish_engulfing | 2 | bullish reversal | bearish mean reversion | 1 | atr-pattern_high | 856 | 26,895 | 17,282 | 83,114 | 0.28 | 0.14 | 0.64 | 0.64 | 40 | 6 | 4.81 | 4.44 | 5.48 | https://analyzingalpha.com/bullish-engulfing-candlestick-pattern |
| 9,465 | forex | uptrend | dark_cloud_cover | 2 | bearish reversal | bullish mean reversion | 5 | atr-pattern_low | 32 | 72 | 29 | 1,113 | 0.66 | 0.33 | 0.40 | 0.28 | 1 | 2 | 38.38 | 81.25 | 22.05 | https://analyzingalpha.com/dark-cloud-cover-candlestick-pattern |
| 9,645 | forex | downtrend | three_stars_in_the_south | 3 | bullish reversal | bearish mean reversion | 5 | atr-pattern_high | 10 | 32 | 9 | 290 | 1.66 | 0.55 | 0.28 | 0.44 | 2 | 2 | 32.22 | 62.00 | 8.40 | https://analyzingalpha.com/three-stars-in-the-south-candlestick-pattern |
| 9,742 | forex | uptrend | bearish_engulfing | 2 | bearish reversal | bearish mean reversion | 2 | atr-pattern_high | 847 | 29,711 | 8,453 | 73,790 | 0.25 | 0.13 | 0.28 | 0.42 | 19 | 12 | 8.73 | 10.35 | 7.57 | https://analyzingalpha.com/bearish-engulfing-candlestick-pattern |
| 9,760 | forex | uptrend | bearish_belt_hold | 1 | bearish reversal | bullish continuation | 5 | low-close | 1,259 | 124,053 | 104,185 | 324,193 | 1.27 | 1.27 | 0.84 | 0.38 | 36 | 34 | 3.11 | 2.80 | 3.30 | https://analyzingalpha.com/bearish-belt-hold-candlestick-pattern |
| 9,768 | forex | downtrend | piercing | 2 | bullish reversal | bearish mean reversion | 3 | atr-pattern_high | 22 | 51 | 25 | 762 | 0.92 | 0.46 | 0.49 | 0.48 | 2 | 1 | 30.48 | 36.17 | 25.23 | https://analyzingalpha.com/piercing-candlestick-pattern |
| 9,934 | forex | uptrend | three_inside_down | 3 | bearish reversal | bearish mean reversion | 4 | atr-pattern_high | 498 | 2,112 | 267 | 6,566 | 0.28 | 0.09 | 0.13 | 0.26 | 2 | 3 | 24.59 | 58.59 | 12.97 | https://analyzingalpha.com/three-inside-down-candlestick-pattern |
| 10,032 | forex | downtrend | bullish_counterattack | 2 | bullish reversal | bearish mean reversion | 2 | atr-pattern_high | 127 | 465 | 150 | 6,525 | 0.40 | 0.20 | 0.32 | 0.47 | 4 | 5 | 43.50 | 41.87 | 44.92 | https://analyzingalpha.com/bullish-counterattack-candlestick-pattern |
| 10,070 | forex | downtrend | takuri | 1 | bullish reversal | bearish continuation | 5 | high-close | 1,173 | 63,306 | 60,921 | 77,493 | 0.97 | 0.97 | 0.96 | 0.33 | 1,052 | 59 | 1.27 | 1.35 | 1.23 | https://analyzingalpha.com/takuri-candlestick-pattern |
| 10,361 | forex | uptrend | bearish_doji_star | 2 | bearish reversal | bearish mean reversion | 1 | atr-pattern_high | 692 | 7,113 | 3,863 | 20,075 | 0.32 | 0.16 | 0.54 | 0.66 | 33 | 7 | 5.20 | 4.66 | 6.25 | https://analyzingalpha.com/bearish-doji-star-candlestick-pattern |
| 10,405 | forex | downtrend | inverted_hammer | 1 | bullish reversal | bullish reversal | 5 | low-close | 697 | 4,447 | 4,327 | 8,389 | 0.76 | 0.76 | 0.97 | 0.29 | 19 | 30 | 1.94 | 2.20 | 1.83 | https://analyzingalpha.com/inverted-hammer-candlestick-pattern |
| 10,958 | forex | downtrend | in_neck | 2 | bearish continuation | bearish mean reversion | 3 | atr-pattern_high | 2 | 4 | 1 | 4 | 3.00 | 1.50 | 0.25 | 1.00 | 1 | 0 | 4.00 | 4.00 | https://analyzingalpha.com/in-neck-candlestick-pattern | |
| 10,990 | forex | downtrend | three_white_soldiers | 3 | bullish reversal | bullish mean reversion | 5 | atr-pattern_low | 292 | 2,012 | 89 | 1,030 | 1.90 | 0.63 | 0.04 | 0.48 | 3 | 3 | 11.57 | 15.60 | 7.80 | https://analyzingalpha.com/three-white-soldiers-candlestick-pattern |
| 11,001 | forex | downtrend | homing_pigeon | 2 | bullish reversal | bearish mean reversion | 1 | atr-pattern_high | 380 | 1,901 | 625 | 2,777 | 0.32 | 0.16 | 0.33 | 0.66 | 14 | 4 | 4.44 | 4.07 | 5.16 | https://analyzingalpha.com/homing-pigeon-candlestick-pattern |
| 11,230 | forex | none | rickshaw_man | 1 | indecision | bearish | 5 | atr-pattern_high | 1,116 | 147,232 | 89,988 | 1,012,842 | 0.27 | 0.27 | 0.61 | 0.21 | 287 | 108 | 11.26 | 20.84 | 8.69 | https://analyzingalpha.com/rickshaw-man-candlestick-pattern |
| 11,420 | forex | none | bullish_long_line | 1 | bullish | bearish | 5 | high-close | 1,273 | 317,098 | 294,151 | 392,540 | 1.17 | 1.17 | 0.93 | 0.36 | 490 | 37 | 1.33 | 1.40 | 1.30 | https://analyzingalpha.com/bullish-long-line-candlestick-pattern |
| 11,447 | forex | uptrend | upside_gap_two_crows | 3 | bearish reversal | bullish mean reversion | 2 | atr-pattern_low | 6 | 12 | 2 | 71 | 2.00 | 0.67 | 0.17 | 1.00 | 1 | 0 | 35.50 | 35.50 | https://analyzingalpha.com/upside-gap-two-crows-candlestick-pattern | |
| 11,450 | forex | uptrend | upside_gap_two_crows | 3 | bearish reversal | bullish mean reversion | 5 | atr-pattern_low | 6 | 12 | 2 | 367 | 2.00 | 0.67 | 0.17 | 0.50 | 1 | 1 | 183.50 | 98.00 | 269.00 | https://analyzingalpha.com/upside-gap-two-crows-candlestick-pattern |
| 11,461 | forex | uptrend | bearish_harami_cross | 2 | bearish reversal | bearish mean reversion | 1 | atr-pattern_high | 714 | 6,985 | 3,395 | 14,829 | 0.30 | 0.15 | 0.49 | 0.65 | 28 | 5 | 4.37 | 4.04 | 4.99 | https://analyzingalpha.com/bearish-harami-cross-candlestick-pattern |
| 11,596 | forex | uptrend | bearish_harami | 2 | bearish reversal | bearish mean reversion | 1 | atr-pattern_high | 830 | 21,414 | 9,075 | 39,318 | 0.28 | 0.14 | 0.42 | 0.64 | 36 | 5 | 4.33 | 3.89 | 5.12 | https://analyzingalpha.com/bearish-harami-candlestick-pattern |
| 11,660 | forex | none | dragonfly_doji | 1 | indecision | bearish | 5 | high-close | 1,198 | 115,148 | 110,567 | 147,301 | 1.28 | 1.28 | 0.96 | 0.38 | 1,589 | 64 | 1.33 | 1.40 | 1.29 | https://analyzingalpha.com/dragonfly-doji-candlestick-pattern |
| 11,732 | forex | downtrend | bearish_separating_lines | 2 | bearish continuation | bullish mean reversion | 2 | atr-pattern_low | 1,239 | 70,969 | 29,872 | 274,902 | 0.35 | 0.17 | 0.42 | 0.45 | 8 | 15 | 9.20 | 9.66 | 8.83 | https://analyzingalpha.com/bearish-separating-lines-candlestick-pattern |
| 11,750 | forex | downtrend | bullish_belt_hold | 1 | bullish reversal | bearish continuation | 5 | high-close | 1,280 | 129,540 | 107,823 | 339,061 | 1.30 | 1.30 | 0.83 | 0.38 | 193 | 48 | 3.14 | 3.27 | 3.07 | https://analyzingalpha.com/bullish-belt-hold-candlestick-pattern |
| 11,890 | forex | uptrend | two_crows | 3 | bearish reversal | bearish mean reversion | 5 | atr-pattern_high | 4 | 8 | 2 | 85 | 2.00 | 0.67 | 0.25 | 0.50 | 1 | 1 | 42.50 | 84.00 | 1.00 | https://analyzingalpha.com/two-crows-candlestick-pattern |
| 11,950 | forex | uptrend | bearish_counterattack | 2 | bearish reversal | bearish reversal | 5 | high-close | 92 | 402 | 372 | 5,094 | 0.78 | 0.39 | 0.93 | 0.30 | 10 | 12 | 13.69 | 14.15 | 13.50 | https://analyzingalpha.com/bearish-counterattack-candlestick-pattern |
| 11,961 | forex | downtrend | bullish_doji_star | 2 | bullish reversal | bullish mean reversion | 1 | atr-pattern_low | 694 | 5,890 | 3,129 | 14,589 | 0.24 | 0.12 | 0.53 | 0.62 | 22 | 9 | 4.66 | 4.59 | 4.77 | https://analyzingalpha.com/bullish-doji-star-candlestick-pattern |
| 12,065 | forex | uptrend | bearish_tri_star | 3 | bearish reversal | bearish reversal | 5 | high-close | 63 | 259 | 249 | 1,121 | 0.76 | 0.25 | 0.96 | 0.29 | 13 | 21 | 4.50 | 3.59 | 4.88 | https://analyzingalpha.com/bearish-tri-star-candlestick-pattern |
| 12,080 | forex | none | bearish_marubozu | 1 | bearish | bullish | 5 | low-close | 1,246 | 233,923 | 192,055 | 214,393 | 2.56 | 2.56 | 0.82 | 0.59 | 56 | 42 | 1.12 | 1.07 | 1.19 | https://analyzingalpha.com/bearish-marubozu-candlestick-pattern |
| 12,092 | forex | uptrend | three_outside_down | 3 | bearish reversal | bearish mean reversion | 2 | atr-pattern_high | 691 | 10,104 | 1,560 | 11,580 | 0.22 | 0.07 | 0.15 | 0.41 | 6 | 7 | 7.42 | 8.36 | 6.78 | https://analyzingalpha.com/three-outside-down-candlestick-pattern |
| 12,187 | forex | downtrend | bearish_three_line_strike | 4 | bearish continuation | bearish mean reversion | 2 | atr-pattern_high | 287 | 853 | 545 | 5,675 | 0.47 | 0.12 | 0.64 | 0.49 | 5 | 3 | 10.41 | 11.84 | 9.05 | https://analyzingalpha.com/bearish-three-line-strike-candlestick-pattern |
| 12,261 | forex | downtrend | unique_three_river_bottom | 3 | bullish reversal | bearish mean reversion | 1 | atr-pattern_high | 100 | 332 | 100 | 354 | 0.50 | 0.17 | 0.30 | 0.75 | 5 | 3 | 3.54 | 3.32 | 4.20 | https://analyzingalpha.com/unique-three-river-bottom-candlestick-pattern |
| 12,262 | forex | downtrend | unique_three_river_bottom | 3 | bullish reversal | bearish mean reversion | 2 | atr-pattern_high | 100 | 329 | 100 | 1,268 | 0.50 | 0.17 | 0.30 | 0.50 | 4 | 3 | 12.68 | 12.84 | 12.52 | https://analyzingalpha.com/unique-three-river-bottom-candlestick-pattern |
| 12,291 | forex | uptrend | bullish_harami_cross | 2 | bullish reversal | bearish mean reversion | 1 | atr-pattern_high | 705 | 6,986 | 1,959 | 8,486 | 0.30 | 0.15 | 0.28 | 0.65 | 20 | 5 | 4.33 | 4.10 | 4.76 | https://analyzingalpha.com/bullish-harami-cross-candlestick-pattern |
| 12,384 | forex | uptrend | rising_three_methods | 5 | bullish continuation | bullish mean reversion | 4 | atr-pattern_low | 12 | 27 | 7 | 73 | 1.15 | 0.23 | 0.26 | 0.43 | 1 | 1 | 10.43 | 15.67 | 6.50 | https://analyzingalpha.com/rising-three-methods-candlestick-pattern |
| 12,499 | forex | uptrend | upside_tasuki_gap | 3 | bullish continuation | bearish mean reversion | 4 | atr-pattern_high | 50 | 114 | 32 | 980 | 0.88 | 0.29 | 0.28 | 0.38 | 1 | 2 | 30.62 | 68.92 | 7.65 | https://analyzingalpha.com/upside-tasuki-gap-candlestick-pattern |
| 12,681 | forex | downtrend | three_inside_up | 3 | bullish reversal | bullish mean reversion | 1 | atr-pattern_low | 507 | 2,137 | 280 | 864 | 0.26 | 0.09 | 0.13 | 0.63 | 3 | 4 | 3.09 | 3.02 | 3.20 | https://analyzingalpha.com/three-inside-up-candlestick-pattern |
| 12,755 | forex | none | bearish_long_line | 1 | bearish | bullish | 5 | low-close | 1,273 | 323,962 | 300,735 | 387,801 | 1.22 | 1.22 | 0.93 | 0.37 | 56 | 31 | 1.29 | 1.25 | 1.31 | https://analyzingalpha.com/bearish-long-line-candlestick-pattern |
| 12,843 | forex | none | bullish_high_wave | 1 | indecision | bearish | 3 | atr-pattern_high | 1,113 | 126,611 | 73,489 | 978,264 | 0.21 | 0.21 | 0.58 | 0.30 | 65 | 34 | 13.31 | 18.97 | 10.86 | https://analyzingalpha.com/bullish-high-wave-candlestick-pattern |
| 12,877 | forex | downtrend | bullish_harami | 2 | bullish reversal | bearish mean reversion | 2 | atr-pattern_high | 839 | 20,437 | 6,568 | 64,090 | 0.26 | 0.13 | 0.32 | 0.42 | 16 | 13 | 9.76 | 11.05 | 8.82 | https://analyzingalpha.com/bullish-harami-candlestick-pattern |
| 12,895 | forex | uptrend | hanging_man | 1 | bearish reversal | bearish reversal | 5 | high-close | 1,175 | 83,811 | 81,293 | 116,329 | 1.09 | 1.09 | 0.97 | 0.35 | 500 | 50 | 1.43 | 1.56 | 1.36 | https://analyzingalpha.com/hanging-man-candlestick-pattern |
| 12,965 | forex | uptrend | shooting_star | 1 | bearish reversal | bearish mean reversion | 5 | atr-pattern_high | 494 | 2,446 | 1,184 | 20,995 | 0.37 | 0.37 | 0.48 | 0.23 | 6 | 6 | 17.73 | 32.49 | 13.39 | https://analyzingalpha.com/shooting-star-candlestick-pattern |
| 12,980 | forex | uptrend | advance_block | 3 | bearish reversal | bearish reversal | 5 | high-close | 1,072 | 20,296 | 18,917 | 68,857 | 0.60 | 0.20 | 0.93 | 0.27 | 24 | 35 | 3.64 | 4.62 | 3.28 | https://analyzingalpha.com/advance-block-candlestick-pattern |
| 13,060 | forex | none | bearish_short_line | 1 | indecision | bullish | 5 | low-close | 1,269 | 276,065 | 256,993 | 338,025 | 0.48 | 0.48 | 0.93 | 0.25 | 32 | 204 | 1.32 | 1.43 | 1.28 | https://analyzingalpha.com/bearish-short-line-candlestick-pattern |
| 13,095 | forex | none | bullish_marubozu | 1 | bullish | bearish | 5 | high-close | 1,259 | 222,286 | 179,751 | 208,851 | 2.51 | 2.51 | 0.81 | 0.59 | 486 | 36 | 1.16 | 1.13 | 1.20 | https://analyzingalpha.com/bullish-marubozu-candlestick-pattern |
| 13,206 | forex | downtrend | three_outside_up | 3 | bullish reversal | bearish mean reversion | 1 | atr-pattern_high | 731 | 8,778 | 5,241 | 23,211 | 0.28 | 0.09 | 0.60 | 0.64 | 17 | 6 | 4.43 | 3.97 | 5.24 | https://analyzingalpha.com/three-outside-up-candlestick-pattern |
| 13,221 | forex | downtrend | morning_star | 3 | bullish reversal | bullish mean reversion | 1 | atr-pattern_low | 506 | 2,169 | 397 | 1,433 | 0.28 | 0.09 | 0.18 | 0.64 | 4 | 3 | 3.61 | 3.51 | 3.79 | https://analyzingalpha.com/morning-star-candlestick-pattern |
| 13,372 | forex | uptrend | upside_gap_three_methods | 3 | bullish continuation | bearish mean reversion | 2 | atr-pattern_high | 469 | 2,696 | 651 | 5,178 | 0.26 | 0.09 | 0.24 | 0.42 | 6 | 5 | 7.95 | 9.39 | 6.90 | https://analyzingalpha.com/upside-gap-three-methods-candlestick-pattern |
| 13,422 | forex | downtrend | downside_tasuki_gap | 3 | bearish continuation | bearish mean reversion | 2 | atr-pattern_high | 28 | 60 | 21 | 194 | 0.57 | 0.19 | 0.35 | 0.52 | 2 | 1 | 9.24 | 13.82 | 4.20 | https://analyzingalpha.com/downside-tasuki-gap-candlestick-pattern |
| 13,602 | forex | none | bearish_high_wave | 1 | indecision | bearish | 2 | atr-pattern_high | 1,059 | 123,303 | 67,197 | 643,247 | 0.21 | 0.21 | 0.54 | 0.40 | 75 | 21 | 9.57 | 11.34 | 8.37 | https://analyzingalpha.com/bearish-high-wave-candlestick-pattern |
| 13,770 | forex | uptrend | identical_three_crows | 3 | bearish reversal | bearish mean reversion | 5 | atr-pattern_high | 518 | 6,425 | 548 | 16,484 | 0.47 | 0.16 | 0.09 | 0.25 | 5 | 7 | 30.08 | 57.31 | 21.27 | https://analyzingalpha.com/identical-three-crows-candlestick-pattern |
Market:
Required Trend:
Pattern:
Pattern Bars:
Traditional Strategy:
Strategy:
RR:
Setup:
Tickers:
Signals:
Trades:
Trade Bars:
Edge:
Edge Per Bar:
Confirm %:
Win %:
Cons Wins:
Cons Losses:
Avg. Trade Bars:
Avg. Win Bars:
Avg. Loss Bars:
Details:
The Best Crypto Candlestick Patterns
| Id | Market | Required Trend | Pattern | Pattern Bars | Traditional Strategy | Strategy | RR | Setup | Tickers | Signals | Trades | Trade Bars | Edge | Edge Per Bar | Confirm % | Win % | Cons Wins | Cons Losses | Avg. Trade Bars | Avg. Win Bars | Avg. Loss Bars | Details |
|---|---|---|---|---|---|---|---|---|---|---|---|---|---|---|---|---|---|---|---|---|---|---|
| 7,380 | crypto | uptrend | bearish_harami | 2 | bearish reversal | bullish mean reversion | 5 | atr-pattern_low | 206 | 1,964 | 706 | 11,829 | 0.67 | 0.34 | 0.36 | 0.28 | 4 | 9 | 16.75 | 23.87 | 14.02 | https://analyzingalpha.com/bearish-harami-candlestick-pattern |
| 7,435 | crypto | downtrend | down_gap_side_by_side | 3 | bearish continuation | bullish reversal | 5 | low-close | 11 | 26 | 25 | 58 | 1.88 | 0.63 | 0.96 | 0.48 | 2 | 2 | 2.32 | 2.58 | 2.08 | https://analyzingalpha.com/down-gap-side-by-side-candlestick-pattern |
| 7,465 | crypto | uptrend | dark_cloud_cover | 2 | bearish reversal | bearish reversal | 5 | high-low | 1 | 2 | 2 | 49 | 2.00 | 1.00 | 1.00 | 0.50 | 1 | 0 | 24.50 | 44.00 | 5.00 | https://analyzingalpha.com/dark-cloud-cover-candlestick-pattern |
| 7,480 | crypto | downtrend | matching_low | 2 | bullish reversal | bullish reversal | 5 | low-close | 236 | 4,265 | 4,054 | 13,786 | 1.06 | 0.53 | 0.95 | 0.34 | 8 | 20 | 3.40 | 4.19 | 2.99 | https://analyzingalpha.com/matching-low-candlestick-pattern |
| 7,510 | crypto | none | rickshaw_man | 1 | indecision | bullish | 5 | atr-pattern_low | 251 | 10,966 | 6,666 | 71,786 | 0.39 | 0.39 | 0.61 | 0.23 | 2 | 19 | 10.77 | 18.07 | 8.57 | https://analyzingalpha.com/rickshaw-man-candlestick-pattern |
| 8,025 | crypto | none | bullish_short_line | 1 | indecision | bearish | 5 | high-close | 257 | 28,755 | 24,447 | 40,962 | 0.79 | 0.79 | 0.85 | 0.30 | 82 | 43 | 1.68 | 1.86 | 1.60 | https://analyzingalpha.com/bullish-short-line-candlestick-pattern |
| 8,040 | crypto | none | bullish_closing_marubozu | 1 | bullish | bearish | 5 | high-close | 239 | 17,905 | 16,707 | 18,631 | 1.26 | 1.26 | 0.93 | 0.38 | 177 | 46 | 1.12 | 1.15 | 1.09 | https://analyzingalpha.com/bullish-closing-marubozu-candlestick-pattern |
| 8,280 | crypto | uptrend | three_outside_down | 3 | bearish reversal | bullish mean reversion | 5 | atr-pattern_low | 142 | 841 | 455 | 7,045 | 0.33 | 0.11 | 0.54 | 0.22 | 2 | 7 | 15.48 | 20.44 | 14.07 | https://analyzingalpha.com/three-outside-down-candlestick-pattern |
| 8,295 | crypto | uptrend | upside_gap_three_methods | 3 | bullish continuation | bullish mean reversion | 5 | atr-pattern_low | 78 | 256 | 112 | 1,518 | 0.45 | 0.15 | 0.44 | 0.24 | 2 | 4 | 13.55 | 22.15 | 10.82 | https://analyzingalpha.com/upside-gap-three-methods-candlestick-pattern |
| 8,410 | crypto | downtrend | hammer | 1 | bullish reversal | bearish continuation | 5 | high-close | 238 | 4,411 | 4,217 | 8,236 | 0.55 | 0.55 | 0.96 | 0.26 | 17 | 22 | 1.95 | 2.50 | 1.76 | https://analyzingalpha.com/hammer-candlestick-pattern |
| 8,495 | crypto | uptrend | bearish_harami_cross | 2 | bearish reversal | bullish mean reversion | 5 | atr-pattern_low | 130 | 621 | 215 | 4,189 | 0.73 | 0.37 | 0.35 | 0.29 | 3 | 5 | 19.48 | 23.87 | 17.71 | https://analyzingalpha.com/bearish-harami-cross-candlestick-pattern |
| 8,530 | crypto | none | bearish_closing_marubozu | 1 | bearish | bullish | 5 | low-close | 247 | 19,255 | 17,814 | 20,775 | 1.26 | 1.26 | 0.93 | 0.38 | 16 | 62 | 1.17 | 1.22 | 1.13 | https://analyzingalpha.com/bearish-closing-marubozu-candlestick-pattern |
| 8,560 | crypto | uptrend | bearish_counterattack | 2 | bearish reversal | bullish mean reversion | 5 | atr-pattern_low | 7 | 18 | 10 | 143 | 0.80 | 0.40 | 0.56 | 0.30 | 1 | 4 | 14.30 | 33.00 | 6.29 | https://analyzingalpha.com/bearish-counterattack-candlestick-pattern |
| 8,620 | crypto | none | gravestone_doji | 1 | indecision | bullish | 5 | low-close | 242 | 7,943 | 7,599 | 9,384 | 1.06 | 1.06 | 0.96 | 0.34 | 11 | 24 | 1.23 | 1.26 | 1.22 | https://analyzingalpha.com/gravestone-doji-candlestick-pattern |
| 8,710 | crypto | uptrend | upside_tasuki_gap | 3 | bullish continuation | bullish mean reversion | 5 | atr-pattern_low | 4 | 8 | 4 | 59 | 2.00 | 0.67 | 0.50 | 0.50 | 1 | 1 | 14.75 | 23.00 | 6.50 | https://analyzingalpha.com/upside-tasuki-gap-candlestick-pattern |
| 8,734 | crypto | uptrend | advance_block | 3 | bearish reversal | bullish mean reversion | 4 | atr-pattern_low | 178 | 1,094 | 144 | 2,691 | 0.66 | 0.22 | 0.13 | 0.33 | 2 | 2 | 18.69 | 27.27 | 14.40 | https://analyzingalpha.com/advance-block-candlestick-pattern |
| 8,980 | crypto | none | bearish_spinning_top | 1 | indecision | bullish | 5 | atr-pattern_low | 250 | 9,589 | 5,411 | 93,389 | 0.49 | 0.49 | 0.56 | 0.25 | 4 | 19 | 17.26 | 30.45 | 12.94 | https://analyzingalpha.com/bearish-spinning-top-candlestick-pattern |
| 9,065 | crypto | uptrend | stalled | 3 | bearish reversal | bullish continuation | 5 | low-close | 77 | 228 | 210 | 1,292 | 0.49 | 0.16 | 0.92 | 0.25 | 2 | 8 | 6.15 | 11.06 | 4.54 | https://analyzingalpha.com/stalled-candlestick-pattern |
| 9,135 | crypto | uptrend | bearish_engulfing | 2 | bearish reversal | bullish mean reversion | 5 | atr-pattern_low | 211 | 1,982 | 1,189 | 19,861 | 0.58 | 0.29 | 0.60 | 0.26 | 3 | 17 | 16.70 | 23.64 | 14.23 | https://analyzingalpha.com/bearish-engulfing-candlestick-pattern |
| 9,164 | crypto | downtrend | downside_tasuki_gap | 3 | bearish continuation | bearish continuation | 4 | high-low | 3 | 6 | 1 | 50 | 4.00 | 1.33 | 0.17 | 1.00 | 1 | 0 | 50.00 | 50.00 | https://analyzingalpha.com/downside-tasuki-gap-candlestick-pattern | |
| 9,195 | crypto | uptrend | bullish_harami_cross | 2 | bullish reversal | bullish mean reversion | 5 | atr-pattern_low | 168 | 860 | 423 | 8,749 | 0.31 | 0.15 | 0.49 | 0.22 | 2 | 7 | 20.68 | 46.32 | 13.56 | https://analyzingalpha.com/bullish-harami-cross-candlestick-pattern |
| 9,270 | crypto | uptrend | evening_star | 3 | bearish reversal | bullish mean reversion | 5 | atr-pattern_low | 68 | 185 | 80 | 1,409 | 0.66 | 0.22 | 0.43 | 0.28 | 2 | 3 | 17.61 | 30.32 | 12.79 | https://analyzingalpha.com/evening-star-candlestick-pattern |
| 9,410 | crypto | downtrend | falling_three_methods | 5 | bearish continuation | bullish mean reversion | 5 | atr-pattern_low | 4 | 8 | 3 | 346 | 1.00 | 0.20 | 0.38 | 0.33 | 1 | 1 | 115.33 | 334.00 | 6.00 | https://analyzingalpha.com/falling-three-methods-candlestick-pattern |
| 9,755 | crypto | uptrend | bearish_belt_hold | 1 | bearish reversal | bullish continuation | 5 | low-close | 236 | 6,157 | 5,685 | 23,969 | 0.80 | 0.80 | 0.92 | 0.30 | 4 | 17 | 4.22 | 6.09 | 3.41 | https://analyzingalpha.com/bearish-belt-hold-candlestick-pattern |
| 10,065 | crypto | downtrend | takuri | 1 | bullish reversal | bearish continuation | 5 | high-close | 229 | 4,206 | 4,053 | 5,180 | 1.29 | 1.29 | 0.96 | 0.38 | 178 | 24 | 1.28 | 1.36 | 1.22 | https://analyzingalpha.com/takuri-candlestick-pattern |
| 10,186 | crypto | uptrend | rising_three_methods | 5 | bullish continuation | bullish continuation | 1 | low-close | 1 | 2 | 2 | 31 | 1.00 | 0.20 | 1.00 | 1.00 | 2 | 0 | 15.50 | 15.50 | https://analyzingalpha.com/rising-three-methods-candlestick-pattern | |
| 10,220 | crypto | none | bullish_spinning_top | 1 | indecision | bullish | 5 | atr-pattern_low | 253 | 9,679 | 5,119 | 88,400 | 0.49 | 0.49 | 0.53 | 0.25 | 3 | 18 | 17.27 | 29.17 | 13.37 | https://analyzingalpha.com/bullish-spinning-top-candlestick-pattern |
| 10,285 | crypto | uptrend | bearish_doji_star | 2 | bearish reversal | bullish mean reversion | 5 | atr-pattern_low | 126 | 514 | 145 | 2,102 | 0.86 | 0.43 | 0.28 | 0.31 | 2 | 4 | 14.50 | 19.09 | 12.43 | https://analyzingalpha.com/bearish-doji-star-candlestick-pattern |
| 10,345 | crypto | uptrend | up_gap_side_by_side | 3 | bullish continuation | bullish continuation | 5 | low-high | 34 | 85 | 51 | 939 | 0.76 | 0.25 | 0.60 | 0.29 | 1 | 4 | 18.41 | 22.40 | 16.75 | https://analyzingalpha.com/up-gap-side-by-side-candlestick-pattern |
| 10,400 | crypto | downtrend | inverted_hammer | 1 | bullish reversal | bullish reversal | 5 | low-close | 176 | 1,019 | 987 | 1,153 | 0.76 | 0.76 | 0.97 | 0.29 | 6 | 11 | 1.17 | 1.19 | 1.16 | https://analyzingalpha.com/inverted-hammer-candlestick-pattern |
| 10,460 | crypto | uptrend | bearish_tri_star | 3 | bearish reversal | bearish reversal | 5 | high-low | 4 | 11 | 6 | 135 | 1.00 | 0.33 | 0.55 | 0.33 | 1 | 2 | 22.50 | 48.00 | 9.75 | https://analyzingalpha.com/bearish-tri-star-candlestick-pattern |
| 10,693 | crypto | downtrend | unique_three_river_bottom | 3 | bullish reversal | bullish reversal | 3 | low-high | 7 | 14 | 9 | 108 | 1.23 | 0.41 | 0.64 | 0.56 | 2 | 2 | 12.00 | 15.40 | 7.75 | https://analyzingalpha.com/unique-three-river-bottom-candlestick-pattern |
| 10,795 | crypto | uptrend | dark_cloud_cover | 2 | bearish reversal | bearish reversal | 5 | high-close | 1 | 2 | 2 | 17 | 2.00 | 1.00 | 1.00 | 0.50 | 1 | 0 | 8.50 | 12.00 | 5.00 | https://analyzingalpha.com/dark-cloud-cover-candlestick-pattern |
| 10,905 | crypto | downtrend | bullish_tri_star | 3 | bullish reversal | bullish mean reversion | 5 | atr-pattern_low | 10 | 23 | 12 | 572 | 1.51 | 0.50 | 0.52 | 0.42 | 1 | 2 | 47.67 | 99.20 | 10.86 | https://analyzingalpha.com/bullish-tri-star-candlestick-pattern |
| 10,982 | crypto | downtrend | three_white_soldiers | 3 | bullish reversal | bullish mean reversion | 2 | atr-pattern_low | 18 | 38 | 1 | 1 | 2.00 | 0.67 | 0.03 | 1.00 | 1 | 0 | 1.00 | 1.00 | https://analyzingalpha.com/three-white-soldiers-candlestick-pattern | |
| 11,120 | crypto | none | bullish_high_wave | 1 | indecision | bullish | 5 | atr-pattern_low | 249 | 7,713 | 4,138 | 71,025 | 0.48 | 0.48 | 0.54 | 0.25 | 2 | 15 | 17.16 | 29.72 | 13.06 | https://analyzingalpha.com/bullish-high-wave-candlestick-pattern |
| 11,135 | crypto | none | doji | 1 | indecision | bullish | 5 | low-close | 259 | 32,125 | 27,127 | 94,885 | 0.75 | 0.75 | 0.84 | 0.29 | 11 | 21 | 3.50 | 4.34 | 3.15 | https://analyzingalpha.com/doji-candlestick-pattern |
| 11,165 | crypto | downtrend | homing_pigeon | 2 | bullish reversal | bullish reversal | 5 | low-close | 97 | 328 | 309 | 1,665 | 0.48 | 0.24 | 0.94 | 0.25 | 3 | 11 | 5.39 | 4.58 | 5.65 | https://analyzingalpha.com/homing-pigeon-candlestick-pattern |
| 11,259 | crypto | uptrend | evening_doji_star | 3 | bearish reversal | bullish mean reversion | 4 | atr-pattern_low | 23 | 50 | 20 | 297 | 0.50 | 0.17 | 0.40 | 0.30 | 2 | 2 | 14.85 | 30.17 | 8.29 | https://analyzingalpha.com/evening-doji-star-candlestick-pattern |
| 11,260 | crypto | uptrend | evening_doji_star | 3 | bearish reversal | bullish mean reversion | 5 | atr-pattern_low | 23 | 50 | 20 | 312 | 0.50 | 0.17 | 0.40 | 0.25 | 1 | 2 | 15.60 | 32.80 | 9.87 | https://analyzingalpha.com/evening-doji-star-candlestick-pattern |
| 11,275 | crypto | downtrend | bullish_engulfing | 2 | bullish reversal | bullish mean reversion | 5 | atr-pattern_low | 222 | 2,389 | 770 | 14,603 | 0.33 | 0.17 | 0.32 | 0.22 | 3 | 11 | 18.96 | 37.23 | 13.75 | https://analyzingalpha.com/bullish-engulfing-candlestick-pattern |
| 11,335 | crypto | downtrend | thrusting | 2 | bearish continuation | bearish continuation | 5 | high-close | 3 | 6 | 6 | 101 | 1.00 | 0.50 | 1.00 | 0.33 | 1 | 2 | 16.83 | 16.50 | 17.00 | https://analyzingalpha.com/thrusting-candlestick-pattern |
| 11,396 | crypto | uptrend | rising_three_methods | 5 | bullish continuation | bearish mean reversion | 1 | atr-pattern_high | 1 | 2 | 1 | 4 | 1.00 | 0.20 | 0.50 | 1.00 | 1 | 0 | 4.00 | 4.00 | https://analyzingalpha.com/rising-three-methods-candlestick-pattern | |
| 11,415 | crypto | none | bullish_long_line | 1 | bullish | bearish | 5 | high-close | 245 | 20,817 | 19,747 | 27,939 | 0.80 | 0.80 | 0.95 | 0.30 | 64 | 51 | 1.41 | 1.59 | 1.34 | https://analyzingalpha.com/bullish-long-line-candlestick-pattern |
| 11,535 | crypto | downtrend | morning_doji_star | 3 | bullish reversal | bullish reversal | 5 | low-close | 22 | 48 | 45 | 616 | 1.27 | 0.42 | 0.94 | 0.38 | 2 | 3 | 13.69 | 19.24 | 10.32 | https://analyzingalpha.com/morning-doji-star-candlestick-pattern |
| 11,580 | crypto | uptrend | bullish_three_line_strike | 4 | bullish continuation | bullish continuation | 5 | low-high | 19 | 44 | 15 | 248 | 1.40 | 0.35 | 0.34 | 0.40 | 1 | 2 | 16.53 | 17.33 | 16.00 | https://analyzingalpha.com/bullish-three-line-strike-candlestick-pattern |
| 11,610 | crypto | uptrend | shooting_star | 1 | bearish reversal | bullish mean reversion | 5 | atr-pattern_low | 100 | 341 | 253 | 3,108 | 1.09 | 1.09 | 0.74 | 0.35 | 4 | 5 | 12.28 | 17.43 | 9.54 | https://analyzingalpha.com/shooting-star-candlestick-pattern |
| 11,655 | crypto | none | dragonfly_doji | 1 | indecision | bearish | 5 | high-close | 235 | 7,137 | 6,904 | 8,549 | 1.23 | 1.23 | 0.97 | 0.37 | 172 | 37 | 1.24 | 1.30 | 1.20 | https://analyzingalpha.com/dragonfly-doji-candlestick-pattern |
| 11,730 | crypto | downtrend | bearish_separating_lines | 2 | bearish continuation | bullish mean reversion | 5 | atr-pattern_low | 191 | 2,125 | 823 | 20,348 | 0.42 | 0.21 | 0.39 | 0.24 | 3 | 13 | 24.72 | 52.31 | 16.21 | https://analyzingalpha.com/bearish-separating-lines-candlestick-pattern |
| 11,745 | crypto | downtrend | bullish_belt_hold | 1 | bullish reversal | bearish continuation | 5 | high-close | 249 | 6,856 | 6,255 | 38,489 | 0.70 | 0.70 | 0.91 | 0.28 | 28 | 31 | 6.15 | 4.99 | 6.61 | https://analyzingalpha.com/bullish-belt-hold-candlestick-pattern |
| 11,790 | crypto | downtrend | three_outside_up | 3 | bullish reversal | bullish reversal | 5 | low-high | 157 | 924 | 602 | 14,488 | 0.78 | 0.26 | 0.65 | 0.30 | 4 | 9 | 24.07 | 41.24 | 16.86 | https://analyzingalpha.com/three-outside-up-candlestick-pattern |
| 11,810 | crypto | uptrend | bullish_separating_lines | 2 | bullish continuation | bullish mean reversion | 5 | atr-pattern_low | 143 | 529 | 180 | 4,435 | 0.76 | 0.38 | 0.34 | 0.29 | 2 | 4 | 24.64 | 38.45 | 18.87 | https://analyzingalpha.com/bullish-separating-lines-candlestick-pattern |
| 11,960 | crypto | downtrend | bullish_doji_star | 2 | bullish reversal | bullish mean reversion | 5 | atr-pattern_low | 147 | 678 | 345 | 7,161 | 0.63 | 0.32 | 0.51 | 0.27 | 2 | 7 | 20.76 | 38.24 | 14.21 | https://analyzingalpha.com/bullish-doji-star-candlestick-pattern |
| 12,035 | crypto | uptrend | three_inside_down | 3 | bearish reversal | bullish mean reversion | 5 | atr-pattern_low | 66 | 193 | 113 | 2,376 | 1.02 | 0.34 | 0.59 | 0.34 | 3 | 4 | 21.03 | 34.29 | 14.31 | https://analyzingalpha.com/three-inside-down-candlestick-pattern |
| 12,075 | crypto | none | bearish_marubozu | 1 | bearish | bullish | 5 | low-close | 240 | 11,558 | 10,359 | 12,743 | 1.54 | 1.54 | 0.90 | 0.42 | 14 | 22 | 1.23 | 1.30 | 1.18 | https://analyzingalpha.com/bearish-marubozu-candlestick-pattern |
| 12,184 | crypto | downtrend | bearish_three_line_strike | 4 | bearish continuation | bearish mean reversion | 4 | atr-pattern_high | 26 | 74 | 39 | 615 | 0.66 | 0.17 | 0.53 | 0.33 | 1 | 3 | 15.77 | 24.31 | 11.50 | https://analyzingalpha.com/bearish-three-line-strike-candlestick-pattern |
| 12,575 | crypto | uptrend | bearish_counterattack | 2 | bearish reversal | bullish continuation | 5 | low-close | 7 | 21 | 20 | 46 | 0.80 | 0.40 | 0.95 | 0.30 | 1 | 5 | 2.30 | 1.17 | 2.79 | https://analyzingalpha.com/bearish-counterattack-candlestick-pattern |
| 12,680 | crypto | downtrend | three_inside_up | 3 | bullish reversal | bullish mean reversion | 5 | atr-pattern_low | 70 | 208 | 48 | 606 | 0.38 | 0.13 | 0.23 | 0.23 | 2 | 3 | 12.62 | 18.09 | 11.00 | https://analyzingalpha.com/three-inside-up-candlestick-pattern |
| 12,750 | crypto | none | bearish_long_line | 1 | bearish | bullish | 5 | low-close | 250 | 23,125 | 21,759 | 30,979 | 0.78 | 0.78 | 0.94 | 0.30 | 12 | 31 | 1.42 | 1.62 | 1.34 | https://analyzingalpha.com/bearish-long-line-candlestick-pattern |
| 12,809 | crypto | downtrend | bullish_counterattack | 2 | bullish reversal | bullish reversal | 4 | low-close | 6 | 24 | 22 | 275 | 0.82 | 0.41 | 0.92 | 0.36 | 3 | 2 | 12.50 | 2.00 | 18.50 | https://analyzingalpha.com/bullish-counterattack-candlestick-pattern |
| 12,890 | crypto | uptrend | hanging_man | 1 | bearish reversal | bearish reversal | 5 | high-close | 204 | 2,891 | 2,786 | 3,586 | 1.45 | 1.45 | 0.96 | 0.41 | 31 | 13 | 1.29 | 1.32 | 1.27 | https://analyzingalpha.com/hanging-man-candlestick-pattern |
| 13,010 | crypto | downtrend | morning_star | 3 | bullish reversal | bullish reversal | 5 | low-high | 62 | 180 | 120 | 1,716 | 0.45 | 0.15 | 0.67 | 0.24 | 3 | 5 | 14.30 | 22.97 | 11.54 | https://analyzingalpha.com/morning-star-candlestick-pattern |
| 13,025 | crypto | downtrend | downside_gap_three_methods | 3 | bearish continuation | bullish mean reversion | 5 | atr-pattern_low | 87 | 306 | 83 | 2,054 | 0.95 | 0.32 | 0.27 | 0.33 | 2 | 3 | 24.75 | 40.52 | 17.14 | https://analyzingalpha.com/downside-gap-three-methods-candlestick-pattern |
| 13,055 | crypto | none | bearish_short_line | 1 | indecision | bullish | 5 | low-close | 253 | 24,558 | 23,074 | 37,109 | 0.46 | 0.46 | 0.94 | 0.24 | 5 | 30 | 1.61 | 1.94 | 1.50 | https://analyzingalpha.com/bearish-short-line-candlestick-pattern |
| 13,090 | crypto | none | bullish_marubozu | 1 | bullish | bearish | 5 | high-close | 225 | 10,126 | 9,120 | 10,639 | 1.60 | 1.60 | 0.90 | 0.43 | 57 | 28 | 1.17 | 1.17 | 1.16 | https://analyzingalpha.com/bullish-marubozu-candlestick-pattern |
| 13,110 | crypto | downtrend | bullish_harami | 2 | bullish reversal | bullish mean reversion | 5 | atr-pattern_low | 229 | 2,410 | 1,038 | 20,895 | 0.27 | 0.13 | 0.43 | 0.21 | 3 | 14 | 20.13 | 40.85 | 14.59 | https://analyzingalpha.com/bullish-harami-candlestick-pattern |
| 13,155 | crypto | uptrend | bearish_tri_star | 3 | bearish reversal | bullish mean reversion | 5 | atr-pattern_low | 4 | 11 | 3 | 58 | 1.00 | 0.33 | 0.27 | 0.33 | 1 | 1 | 19.33 | 48.00 | 5.00 | https://analyzingalpha.com/bearish-tri-star-candlestick-pattern |
| 13,460 | crypto | none | long_legged_doji | 1 | indecision | bullish | 5 | low-close | 256 | 23,412 | 21,947 | 89,701 | 0.43 | 0.43 | 0.94 | 0.24 | 10 | 23 | 4.09 | 6.05 | 3.48 | https://analyzingalpha.com/long-legged-doji-candlestick-pattern |
| 13,535 | crypto | none | bearish_high_wave | 1 | indecision | bullish | 5 | atr-pattern_low | 246 | 7,349 | 4,163 | 71,887 | 0.47 | 0.47 | 0.57 | 0.25 | 3 | 16 | 17.27 | 28.81 | 13.52 | https://analyzingalpha.com/bearish-high-wave-candlestick-pattern |
| 13,860 | crypto | uptrend | identical_three_crows | 3 | bearish reversal | bullish mean reversion | 5 | atr-pattern_low | 75 | 185 | 95 | 1,634 | 0.83 | 0.28 | 0.51 | 0.31 | 3 | 3 | 17.20 | 22.41 | 14.91 | https://analyzingalpha.com/identical-three-crows-candlestick-pattern |
| 13,876 | crypto | uptrend | three_black_crows | 4 | bearish reversal | bearish mean reversion | 1 | atr-pattern_high | 1 | 5 | 3 | 10 | 0.34 | 0.08 | 0.60 | 0.67 | 2 | 1 | 3.33 | 4.50 | 1.00 | https://analyzingalpha.com/three-black-crows-candlestick-pattern |
Market:
Required Trend:
Pattern:
Pattern Bars:
Traditional Strategy:
Strategy:
RR:
Setup:
Tickers:
Signals:
Trades:
Trade Bars:
Edge:
Edge Per Bar:
Confirm %:
Win %:
Cons Wins:
Cons Losses:
Avg. Trade Bars:
Avg. Win Bars:
Avg. Loss Bars:
Details:
How to Scan for Candlestick Patterns
The best way for most traders is to use TradingView to search for candlestick patterns. If you’re an algorithmic trader like me or just interested in how I found over seven million candlestick trades programmatically, I used TA-Lib.
Now that you know the best candlestick patterns and how to search for them, it’s time to learn how to identify all candlestick patterns.
What Are All the Different Candlestick Patterns? (Alphabetical)
Here you will see all the candlestick patterns explained with examples. There are 86 Japanese candlestick patterns. I’ve listed them below in alphabetical order.
Advance Block
The advance block candlestick pattern is a three-bar bearish reversal pattern that’s best traded as a bearish reversal in the forex market and a bullish mean reversion in the crypto and stock markets.
Advance Block Identification

- Three consecutive bullish bars closing consecutively higher.
- Each bar opens within or near the real body of the previous bar.
- The first bar of the pattern must have a long body with little to no wick.
- The second and third candles must have progressively smaller bodies with longer upper wicks.
- The advance block must occur during an uptrend.
Advance Block Example
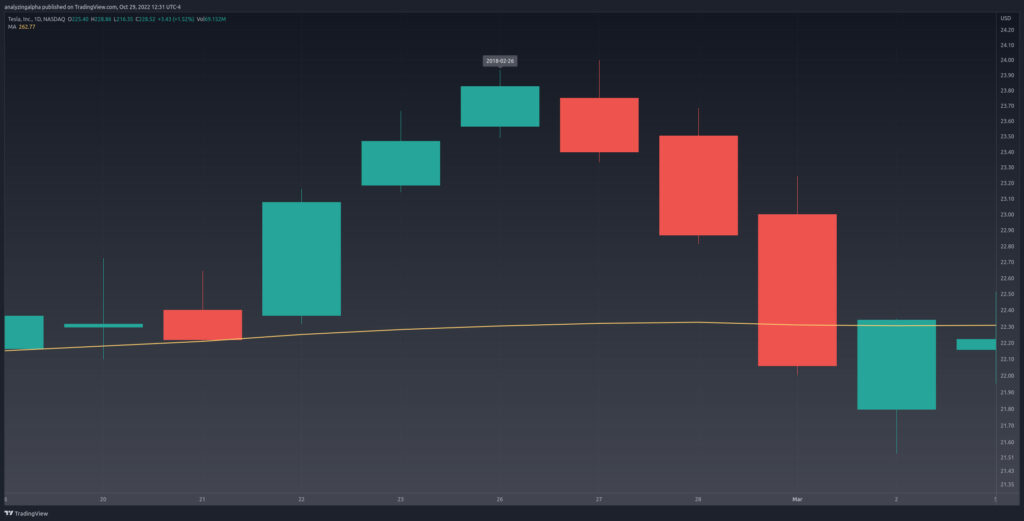
Bearish Abandoned Baby
The bearish abandoned baby candlestick pattern is a three-bar bearish reversal pattern that’s best traded as advertised.
Bearish Abandoned Baby Identification

- The first candlestick must have a long bullish body.
- The second candle must be a doji.
- The third candle must be bearish with a real body that moves well within the first candle’s body.
- There must be a downside gap where the wicks of the second and third bars don’t touch.
- The bearish abandoned baby must occur during an uptrend.
Bearish Abandoned Baby Example

Bearish Belt Hold
The bearish belt hold is a one-bar bearish reversal pattern that’s best traded as a bullish continuation in the crypto and forex markets and as a bullish mean reversion in the stock market.
Bearish Belt Hold Identification

- The candle must be bearish with a long real body.
- There must be little to no upper shadow.
- The bearish belt hold must occur in an uptrend.
Bearish Belt Hold Example

Bearish Breakaway
The bearish breakaway is a five-bar bearish reversal pattern that’s likely best traded using bearish mean reversion trading strategies.
Bearish Breakaway Identification

- The first candle is a long bullish candle.
- The second candle gaps up and is bullish.
- The third candle has a higher low and higher high than the previous candle.
- The fourth candle is bullish and has a higher low and higher high than the prior candle.
- The fifth candle closes the gap and is bearish.
- The bearish breakaway must occur in an uptrend.
Bearish Breakaway Example

Bearish Closing Marubozu
The bearish closing marubozu candlestick pattern is a one-bar bearish pattern that is best traded as a bullish reversal across the crypto, forex and stock markets.
Bearish Closing Marubozu Identification

- The candle must be bearish with a long real body.
- There must be little to no lower shadow.
- The bearish closing marubozu doesn’t require a trend.
Bearish Closing Marubozu Example

Bearish Counterattack Lines
The bearish counterattack lines is a two-bar bearish reversal pattern that’s best traded as intended in the forex market and as a bullish continuation in the crypto and stock markets.
Bearish Counterattack Lines Identification

- The first candle must be white with a long body.
- The second candle is bearish and must close near the first candle’s close.
- The bearish counterattack lines must occur during an uptrend.
Bearish Counterattack Lines Example

Bearish Doji Star
The bearish doji star is a two-bar bearish reversal pattern that’s best traded using a bullish mean reversion strategy in all markets.
Bearish Doji Star Identification

- The first candle must have a long white real body.
- The second candle is a doji that gaps up.
- The bearish dojo star pattern must occur during an uptrend.
Bearish Doji Star Example

Bearish Engulfing
The bearish engulfing is a two-bar bearish reversal pattern that’s best traded using a bullish mean reversion strategy in the crypto and stock markets and a bearish mean reversion strategy in the forex markets.
Bearish Engulfing Identification

- The first candle must have a long white real body.
- The second candle is bearish, engulfing the previous candle.
- The bearish engulfing pattern must occur during an uptrend.
Bearish Engulfing Example

Bearish Harami
The bearish harami is a two-bar bearish reversal pattern that’s best traded using a bullish mean reversion strategy in the crypto and stock markets and a bearish mean reversion strategy in the forex markets.
Bearish Harami Identification

- The first candle must have a long white real body.
- The second candle is bearish, engulfing the previous candlestick.
- The bearish harami pattern must occur during an uptrend.
Bearish Harami Example

Bearish Harami Cross
The bearish harami cross, like the above bearish harami, is a two-bar bearish reversal pattern that’s best traded using a bullish mean reversion strategy in the crypto and stock markets and a bearish mean reversion strategy in the forex markets.
Bearish Harami Cross Identification
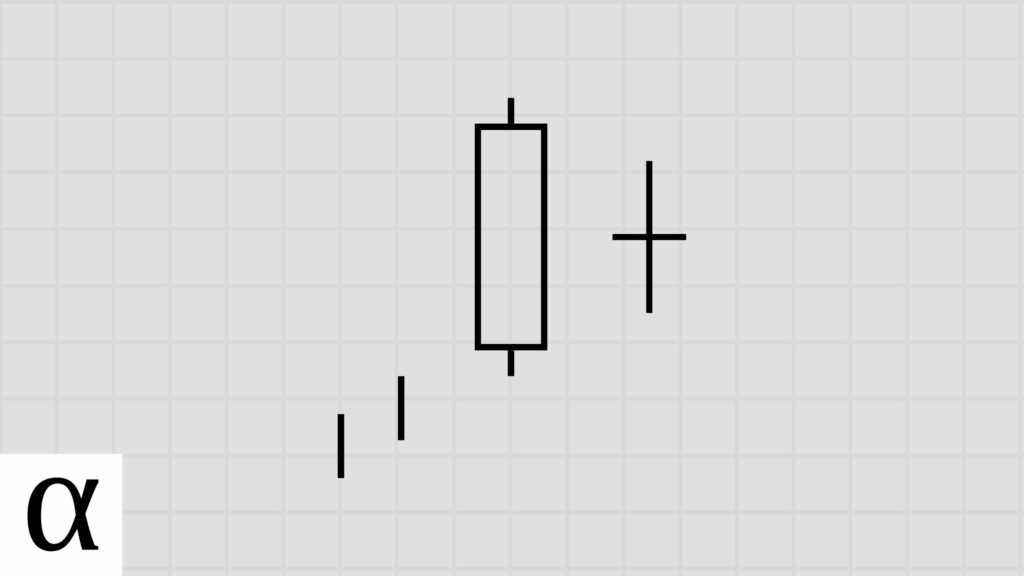
- The first candle must have a long white real body.
- The second candle is a doji, engulfing the previous candlestick.
- The bearish harami cross pattern must occur during an uptrend.
Bearish Harami Cross Example

Bearish High Wave
The bearish high wave is a one-bar indecision pattern that’s best traded using bullish mean reversion strategies in the crypto and stock markets and a bearish mean reversion strategy in the forex markets.
Bearish High Wave Cross Identification

- A single candle with a small bearish body with long upper and lower shadows (at least 3x the body size)
Bearish High Wave Example

Bearish Kicking
The bearish kicking is a two-bar bearish pattern that’s best traded using a bullish mean reversion strategy in the stock markets. This pattern seldom occurs in the crypto and forex markets.
Bearish Kicking Identification

- The first candle must be a white marubozu.
- The second candle must gap down and be a black marubozu.
Bearish Kicking Example

Bearish Long Line
The bearish long line is a one-bar bearish pattern that’s best traded as intended in the crypto and stock markets and as a reversal in the forex markets.
Bearish Long Line Identification

- The candle must have a long bearish body with short upper and lower wicks.
Bearish Long Line Example

Bearish Marubozu
The bearish marubozu is a one-bar bearish reversal pattern that’s best traded using a bullish strategy in all markets.
Bearish Marubozu Identification

- The candle must have a long bearish body with little to no upper and lower wicks.
Bearish Marubozu Example

Bearish Separating Lines
The bearish separating lines is a two-bar bearish continuation pattern that’s best traded using a bullish mean reversion strategy in the crypto and stock markets and a bearish mean reversion in forex markets.
Bearish Separating Lines Identification

- The first candle must be white.
- The second candle must be black with the same opening as the previous candle.
- The bearish separating lines must occur in a downtrend.
Bearish Separating Lines Example

Bearish Short Line
The bearish short line is a one-bar indecision candlestick pattern that’s best traded using a bullish bounce strategy in all markets.
Bearish Short Line Identification

- The candle must be bearish with a short real body and small upper and lower shadows.
Bearish Short Line Example

Bearish Spinning Top
The bearish spinning top is a one-bar bearish candlestick continuation pattern that’s best traded using a bullish mean reversion strategy in the crypto and stock markets and a bearish mean reversion strategy in the forex markets.
Bearish Spinning Top Identification

- The candle must be bearish with a short real body and upper and lower shadows larger than its body.
Bearish Spinning Top Example

Bearish Three-Line Strike
The bearish three-line strike is a four-bar bearish continuation pattern that’s best traded using a bearish mean reversion strategy in the crypto and forex markets and a bullish mean reversion strategy in the stock market.
Bearish Three Line Strike Identification

- The first three bearish candles must close lower than the previous candle.
- The first three candles must be similar in length, resembling a staircase.
- The fourth bullish bar must engulf the real bodies of all three previous bearish candles.
- The bearish three-line strike must occur during a downtrend.
Bearish Three-Line Strike Example

Bearish Tri-Star
The bearish tri-star is an extremely rare three-bar bearish reversal pattern that’s best traded as indented in all markets.
Bearish Tri-Star Identification

- There must be three consecutive dojis with the second gapping above the first.
- The bearish tri-star must occur during an uptrend.
Bearish Tri-Star Example

Bullish Abandoned Baby
The bullish abandoned baby is an extremely rare three-bar bullish reversal pattern that’s best traded as intended in the stock market and doesn’t occur frequently in the forex and crypto markets to provide statistically significant results.
Bullish Abandoned Baby Identification

- The first candlestick must have a long black real body.
- The second candlestick must be a doji.
- There must be a downside gap where the shadows of the first and second candles don’t touch.
- The third candle must be white with a real body that moves well within the first candle’s body.
- There must be an upside gap where the shadows of the second and third candlesticks don’t touch.
- The bullish abandoned baby must occur in a downtrend.
Bullish Abandoned Baby Example

Bullish Belt Hold
The bullish belt hold is a frequently occurring one-bar bearish reversal pattern that’s best traded in the opposite direction of conventional wisdom.
Bullish Belt Hold Identification

- The first candlestick must have a long black real body.
- The second candlestick must be a doji.
- There must be a downside gap where the shadows of the first and second candles don’t touch.
- The third candle must be white with a real body that moves well within the first candle’s body.
- There must be an upside gap where the shadows of the second and third candlesticks don’t touch.
- The bullish belt hold must occur in a downtrend.
Bullish Belt Hold Example

Bullish Breakaway
The bullish breakaway is a rare five-bar bullish reversal pattern that’s best traded as intended.
Bullish Breakaway Identification

- The first candle must be a long black candle.
- The second candle is black and gaps down.
- The third candle must have a lower high and lower low than the second.
- The fourth candle must have a lower high and lower low than the third.
- The fifth candle must be bullish and closes the second candle’s gap.
- The bullish breakaway must occur in a downtrend.
Bullish Breakaway Example

Bullish Closing Marubozu
The bullish closing marubozu is a frequently occurring one-bar bullish pattern that’s best traded bearishly across all markets tested.
Bullish Closing Marubozu Identification
- A long white body.
- A close price near or at the high. (A tiny upper shadow)
- The bullish closing marubozu does not require a trend.
Bullish Closing Marubozu Example
Bullish Counterattack Lines
The bullish counterattack, also known as the bullish counter attack lines, is a two-bar bullish reversal pattern that’s best traded as a bearish continuation in the stock market and a bearish mean reversion in the forex markets. The pattern occurs too infrequently in the crypto markets to produce statistically significant results.
Bullish Counterattack Identification

- The first candle must be bearish with a long real body.
- The second candle must be bullish, closing equal to the previous close.
- The bullish counterattack must occur during a downtrend.
Bullish Counterattack Example

Bullish Doji Star
The bullish doji star is a two-bar bullish reversal pattern that’s traded best as intended in the stock market, as a bullish mean reversion in the forex market and using a bearish mean reversion trading strategy in the crypto markets.
Bullish Doji Star Identification

- The first candle must be bearish with a long real body.
- The second candle must be a doji that gaps down.
- The bullish doji star must occur during a downtrend.
Bullish Doji Star Example

Bullish Engulfing
The bullish engulfing is a two-bar bullish reversal pattern that’s best traded using a bullish mean reversion strategy across all markets.
Bullish Engulfing Identification

- The first candle must be black.
- The second candle must be white and engulf the prior candle.
- The bullish engulfing must occur in a downtrend.
Bullish Engulfing Example

Bullish Harami
The bullish harami is a two-bar bullish reversal pattern that’s best traded using a bullish mean reversion strategy in the stock markets and bearish mean reversion strategies in the crypto and forex markets.
Bullish Harami Identification
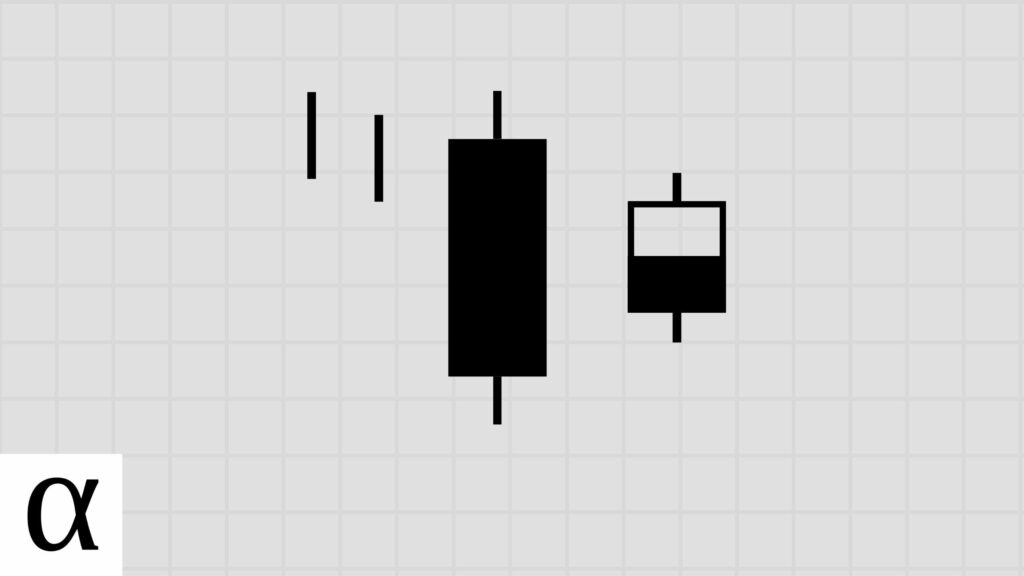
- The first candle must have a long bearish real body.
- The second candle is engulfed by the first.
- The bullish harami must occur in a downtrend.
Bullish Harami Example

Bullish Harami Cross
The bullish harami cross is a two-bar bullish reversal pattern that’s best traded using a bullish mean reversion strategy in stock and crypto markets and a bearish mean reversion strategy in forex markets.
Bullish Harami Identification
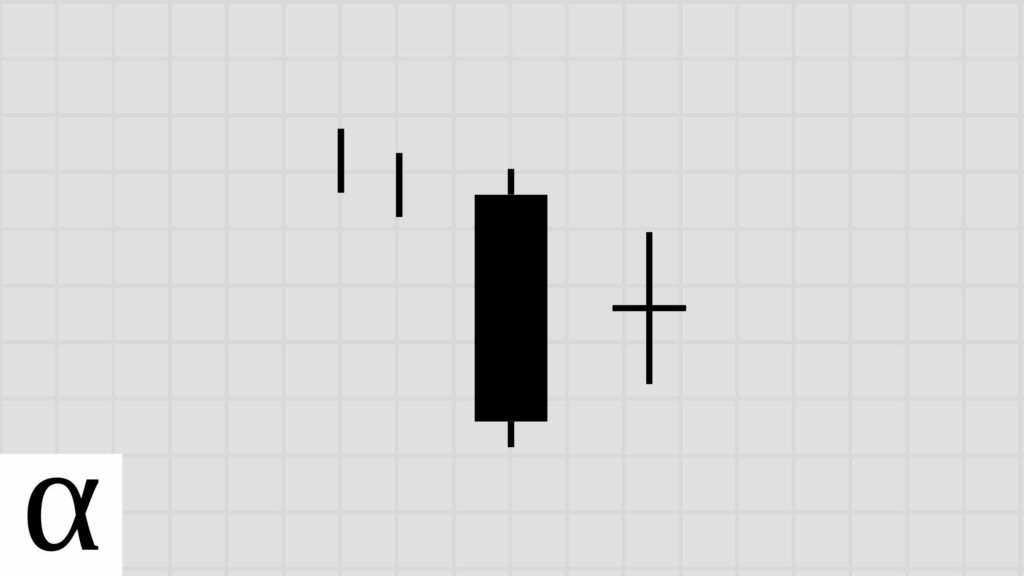
- The first candle must have a long bearish real body.
- The second candle is a doji engulfed by the first.
- The bullish harami cross must occur in a downtrend.
Bullish Harami Cross Example
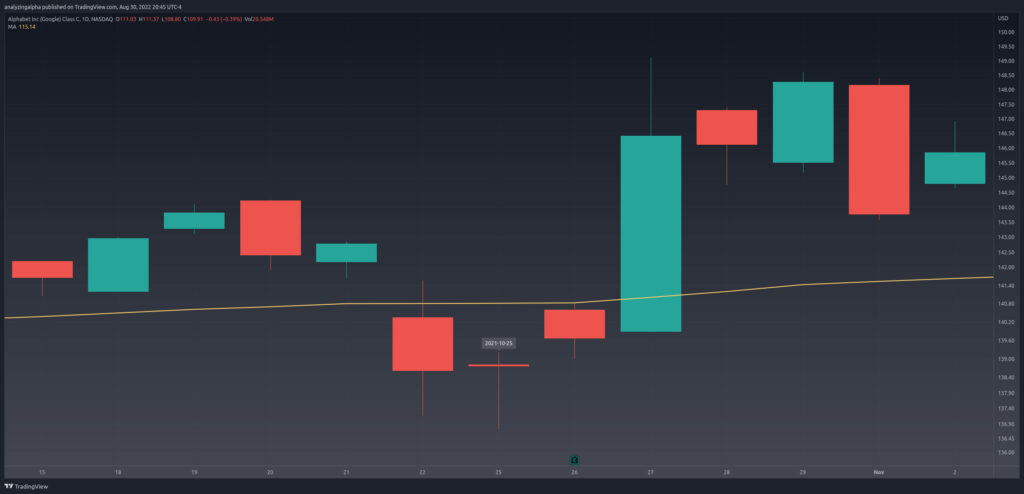
Bullish High Wave
The bullish high wave is a one-bar indecision pattern that’s best traded using bullish mean reversion strategies in stock and crypto markets and a bearish mean reversion strategy in forex.
Bullish High Wave Identification

- The first candle must have a long bearish real body.
- The second candle is a doji engulfed by the first.
- The bullish high wave must occur in a downtrend.
Bullish High Wave Example

Bullish Kicking
The bullish kicking is a two-bar bullish pattern that’s best traded as intended in the stock market. Unfortunately, there wasn’t enough data to determine the best bullish kicking trading strategy in the forex and crypto markets.
Bullish Kicking Identification

- The first candle is a bearish marubozu.
- The second candle is a bullish marubozu.
- There must be a gap between the two candles.
Bullish Kicking Example

Bullish Long Line
The bullish long line is a one-bar bullish pattern that’s best traded as a bearish reversal using an entry close in all markets.
Bullish Long Line Identification

- The candle must have a long real body with short upper and lower shadows.
Bullish Long Line Example

Bullish Marubozu
The bullish marubozu is a one-bar bullish candlestick pattern that’s best traded as a bearishly expecting short-term profit-taking.
Bullish Marubozu Identification

- The candle must have a long real body with little to no upper and lower shadows.
Bullish Marubozu Example

Bullish Separating Lines
The bullish separating lines is a two-bar bullish continuation pattern that’s best traded as a bearish reversal.
Bullish Separating Lines Identification

- The first candle must be bearish.
- The second candle must be a bullish belt hold pattern.
- The opening price for the first and second candles must match.
- The bullish separating lines must occur in an uptrend.
Bullish Separating Lines Example

Bullish Short Line
The bullish short line is a one-bar indecision pattern that’s best traded as a bearish candle reversal.
Bullish Short Line Identification

- The candle must have a small real body with short upper and lower shadow.
Bullish Short Line Example

Bullish Spinning Top
The bullish spinning top is a one-bar indecision pattern that’s best traded using mean reversion strategies across all markets tested.
Bullish Spinning Top Identification

- The candle must wicks larger than its small bullish real body.
Bullish Spinning Top Example

Bullish Three-Line Strike
The bullish three-line strike is a four-bar bullish continuation pattern that’s best traded using bullish mean reversion strategies in the stock market and bearish volatility-capturing strategies in forex. Crypto traders should avoid this pattern due to a lack of statistically significant trading strategies.
Bullish Three-Line Strike Identification

- Three consecutive larger bullish candles with higher closes, each opening near or within the previous candle’s body with little to no upper wick.
- The last candle must open higher than the third candle’s close and close below the first candle’s open.
- The bullish three-line strike must occur during an uptrend.
Bullish Three-Line Strike Example

Bullish Tri-Star
The bullish tri-star is a three-bar bullish reversal pattern that’s best traded as intended in the stock market and as a bearish continuation in the forex market. Data-driven crypto traders should avoid this pattern.
Bullish Tri-Star Identification

- Three consecutive dojis.
- The second doji is a star and gaps below the first doji.
- The bullish tri-star must occur in a downtrend.
Bullish Tri-Star Example

Concealing Baby Swallow
The concealing baby swallow is a four-bar bullish reversal pattern that occurs too infrequently to develop statistically significant trading strategies.
Concealing Baby Swallow Identification

- The first candle must be a bearish marubozu.
- The second candlestick is a bearish marubozu.
- The third candle is black and opens, gapping down with an upper shadow extending into the previous candle’s real body.
- The fourth candle is bearish and completely engulfs the previous candle.
- The concealing baby swallow must occur in a downtrend.
Concealing Baby Swallow Example

Dark Cloud Cover
The dark cloud cover is a two-bar bearish reversal pattern that is best traded using bullish mean reversion strategies in the forex and stock markets. Data-driven crypto traders should pass on this pattern due to a lack of statistically significant trading strategies.
Dark Cloud Cover Identification
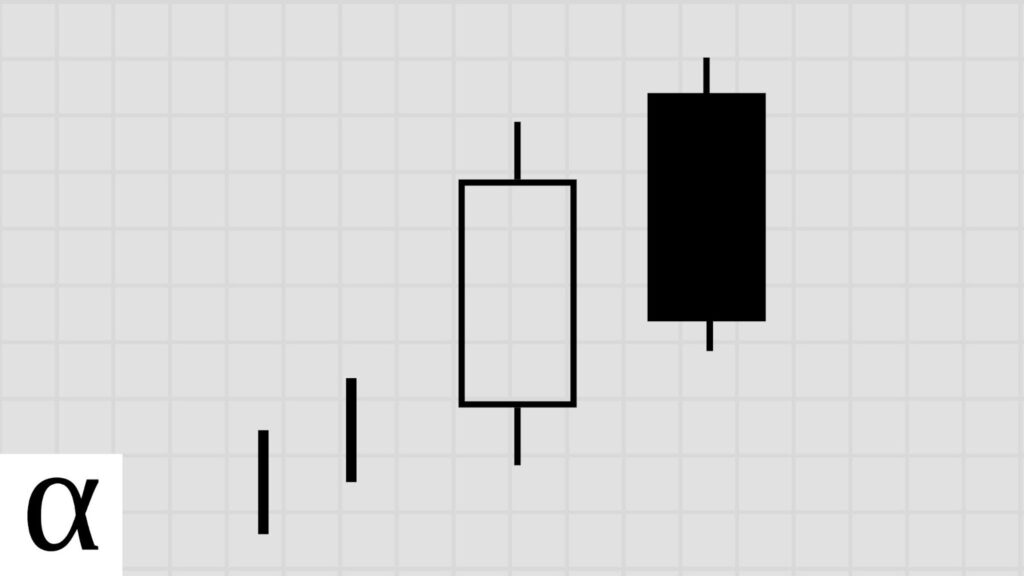
- The first candle is long and bullish candle.
- The second candle opens above the prior candle’s high and closes within the first candle’s body, ideally below the midpoint.
- The dark cloud cover must occur during an uptrend.
Dark Cloud Cover Example

Doji
The doji is a frequent, one-bar indecision pattern that’s best traded bullishly in the crypto and stock markets and bearishly in forex.
Doji Identification

- The open and close are near or equal.
- The open and close are not near the high or low.
- The candle’s range is similar to prior trading ranges.
- The doji does not require a trend.
Doji Example

Down Gap Side-by-Side White Lines
The down gap side-by-side, also known as the bearish side-by-side white lines, is a three-bar bearish continuation pattern that’s best traded bullishly in all markets.
Down Gap Side-by-Side Identification

- The first candle is long and bearish candle.
- The second candle must gap down and be bullish.
- The third candle opens near the prior candle’s opening and is roughly the same size as the second candle and does not close the gap.
- The down gap side-by-side occurs during a downtrend.
Bearish Side-by-Side White Lines Example

Downside Gap Three Methods
The downside gap three methods is a three-bar bearish continuation pattern that’s best traded using a bullish mean reversion strategy in the stock market while capturing volatility in the opposite direction in the forex market. Crypto traders should avoid this pattern due to the lack of statistically significant trading setups.
Downside Gap Three Methods Identification

- The first candle is bearish.
- The second candle is bearish and gaps down.
- The third candle is bullish, opens within the previous candle’s real body, and closes within the first candle’s real body.
- The downside gap three methods must occur during a downtrend.
Downside Gap Three Methods Example

Downside Tasuki Gap
The downside tasuki gap is a three-bar bearish continuation pattern that’s best traded using a bullish mean reversion volatility strategies in the stock and forex markets. Crypto traders should avoid the downside tasuki gap due to the lack of trading opportunities.
Downside Tasuki Gap Identification
- A bullish or bearish first candle.
- The second candle must gap down and be bearish.
- The third candle must open within the second candle’s real body, close within the gap, and be bullish.
- The downside tasuki gap occurs during a downtrend.
Downside Tasuki Gap Example

Dragonfly Doji
The dragonfly doji is a one-bar bullish doji pattern that’s best traded for a quick bearish bounce across all markets.
Dragonfly Doji Identification

- The open and close must be equal or almost equal.
- There must be little to no upper shadow.
Dragonfly Doji Example

Evening Doji Star
The evening doji star is a three-bar bearish reversal pattern that’s best traded using mean reversion strategies across all markets.
Evening Doji Star Identification
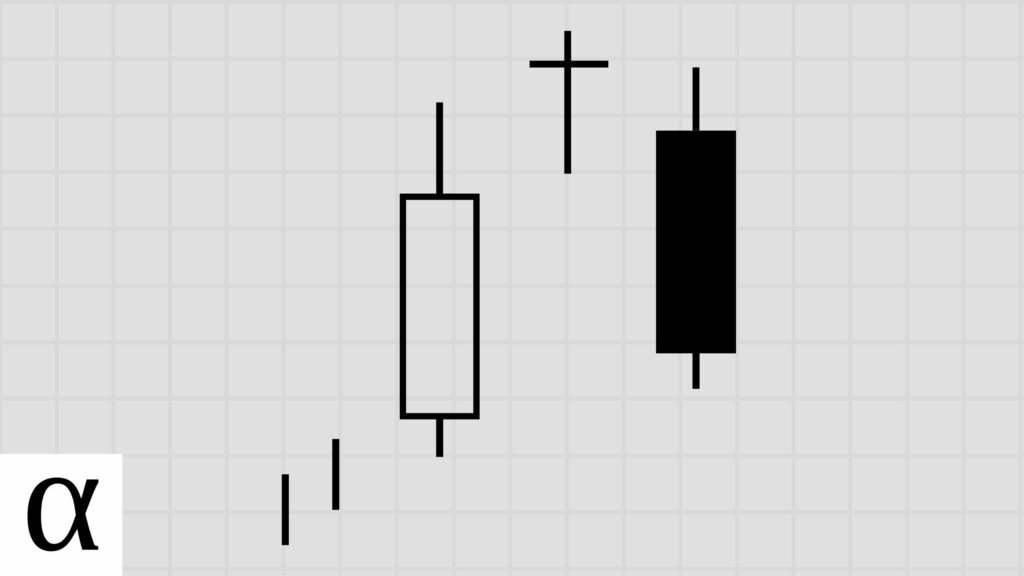
- The first candle is long and bullish.
- The second candle gaps up and is a doji.
- The third candle moves well within the first candle’s body and is bearish.
- The evening doji star must occur in an uptrend.
Evening Doji Star Example

Evening Star
The evening star is a three-bar bearish reversal pattern that’s best traded using volatility-capturing strategies across all markets.
Evening Star Identification

- The first candle is bullish and long.
- The second candle gaps up and has a short real body.
- The third candle is bearish and moves well within the first candle’s body.
- The evening star must occur in an uptrend.
Evening Star Example

Falling Three Methods
The falling three methods is an extremely rare bearish continuation with at least four bars that are like best traded using volatility-capturing strategies across all markets. Data-driven traders should avoid this pattern due to lack of statistically significant trading strategies.
Falling Three Methods Identification

- The first candle is long and bearish.
- A group of two or more rising small-bodied candles that hold within the first candle’s range.
- A final bearish candle that opens below the prior small candle’s close and closes below the first candle’s close.
- The falling three methods must occur during a downtrend.
Falling Three Methods Example
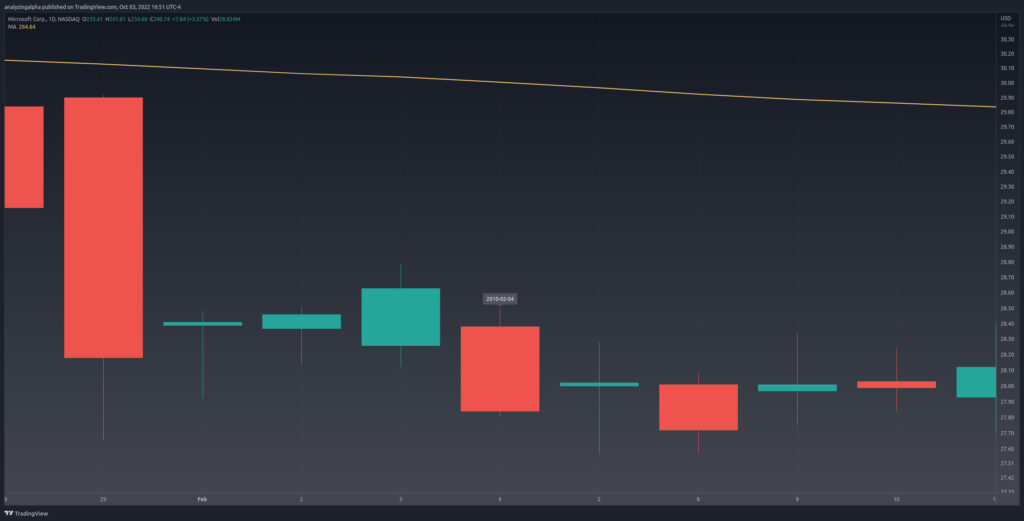
Gravestone Doji
The gravestone doji is a one-bar bearish doji candle pattern that’s best traded using bullish bounce strategies in all markets.
Gravestone Doji Identification

- The open and close are equal or near equal.
- There must be little to no lower wick.
Gravestone Doji Example
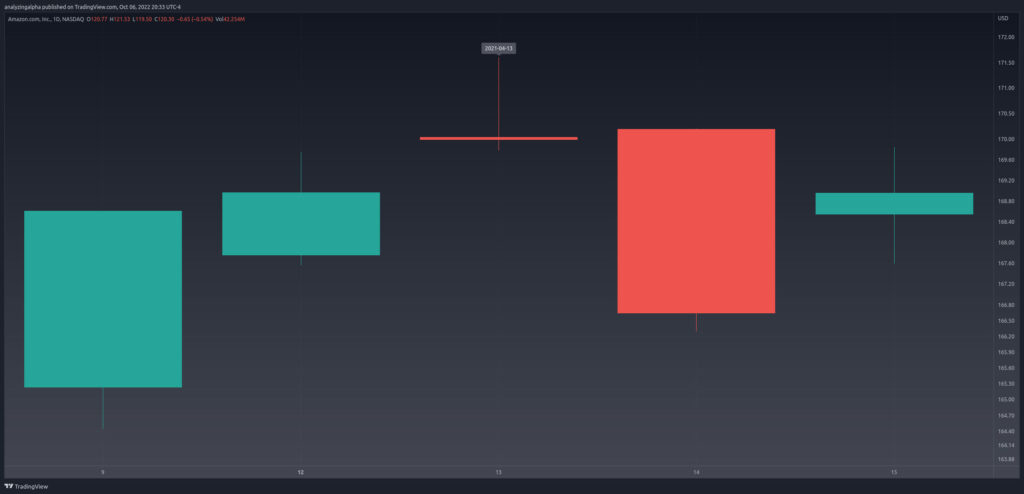
Hammer
The hammer is a one-bar bullish reversal pattern that’s best traded using bearish continuation strategies in all markets.
Hammer Identification

- Small body with little to no upper wick and a long lower wick at least 2x the size of the body.
- The hammer must occur in a downtrend.
Hammer Example
Hanging Man
The hanging man is a frequent one-bar bearish reversal pattern that’s best traded bearishly across all markets.
Hanging Man Identification

- Small body with no to little upper wick and a long lower wick at least 2x the size of the body.
- The hanging man occurs in an uptrend.
Hanging Man Example

Homing Pigeon
The hanging man is a frequent one-bar bullish reversal pattern that’s best traded bearishly across all markets.
Homing Pigeon Identification

- The first candle is bearish and long.
- The second candle is bearish and short, with its body fitting within the previous body.
- The home pigeon must occur during a downtrend.
Homing Pigeon Example

In Neck
The in neck is a rare two-bar bearish continuation pattern that’s best traded capturing bullish volatility in the stock market. Crypto and forex traders should avoid this pattern due to a lack of statistically significant trading data.
In Neck Identification

- The first candle is bearish and long.
- The second candle is bullish, opens below the prior candle’s low, and closes slightly into the prior body.
- The in neck occurs in a downtrend.
In Neck Example

Inverted Hammer
The inverted hammer is a frequent one-bar bullish reversal pattern that’s best traded, capturing volatility in all markets.
Inverted Hammer Identification

- A small real body with little to no lower shadow and a long upper wick at least three times the size of the real body.
- The inverted hammer occurs during a downtrend.
Inverted Hammer Example

Ladder Bottom
The ladder bottom is a rare five-bar bullish reversal pattern that’s best traded as intended in the stock market. Data-driven forex and crypto traders should pass on this rare pattern.
Ladder Bottom Identification

- Three bearish candlesticks with consecutively lower opening and closing prices.
- A fourth bearish candlestick with an upper wick.
- A fifth bullish candlestick that opens above the previous real body and closes above the prior high.
- The ladder bottom occurs in a downtrend.
Ladder Bottom Example

Long-Legged Doji
The long-legged doji is a one-bar doji indecision candlestick pattern that’s best traded bullishly in the stock and crypto markets and bearishly in forex.
Long-Legged Doji Identification

- The open and close are equal or near equal.
- There must be at least one long wick.
Long-Legged Doji Example

Matching Low
The matching low is a two-bar bullish reversal pattern that’s best traded using bullish strategies in all markets.
Matching Low Identification

- The first candlestick is bearish.
- The second candlestick is bearish closing equal to the prior close.
- The matching low occurs during a downtrend.
Matching Low Example

Morning Doji Star
The morning doji star is a three-bar bullish reversal pattern that’s best traded using bullish strategies in all markets.
Morning Doji Star Identification
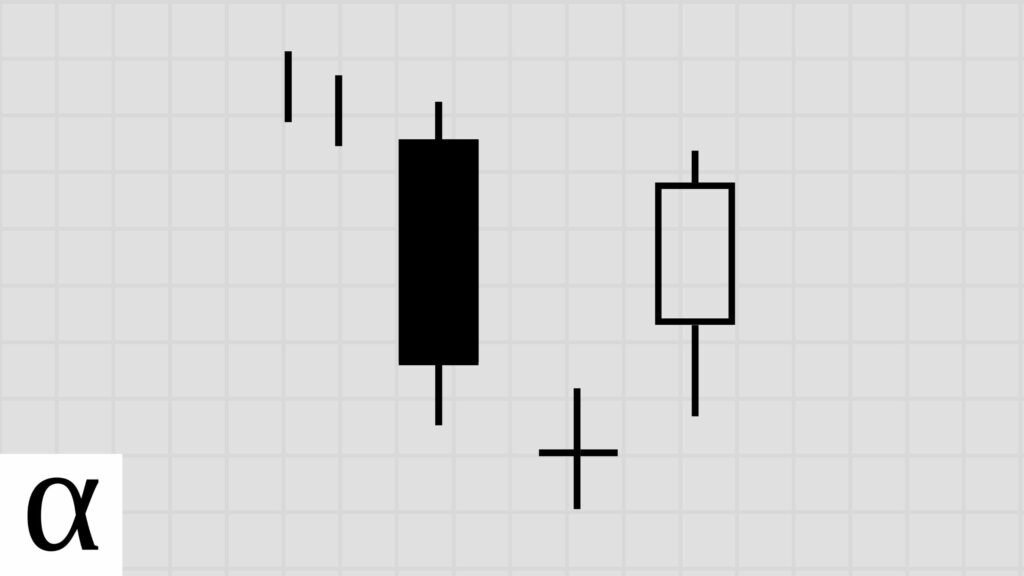
- The first candlestick is bearish and long.
- The second candlestick is a doji that gaps down.
- The third candlestick is bullish and moves well within the first candlestick’s body.
- The morning doji star must occur in a downtrend.
Morning Doji Star Example
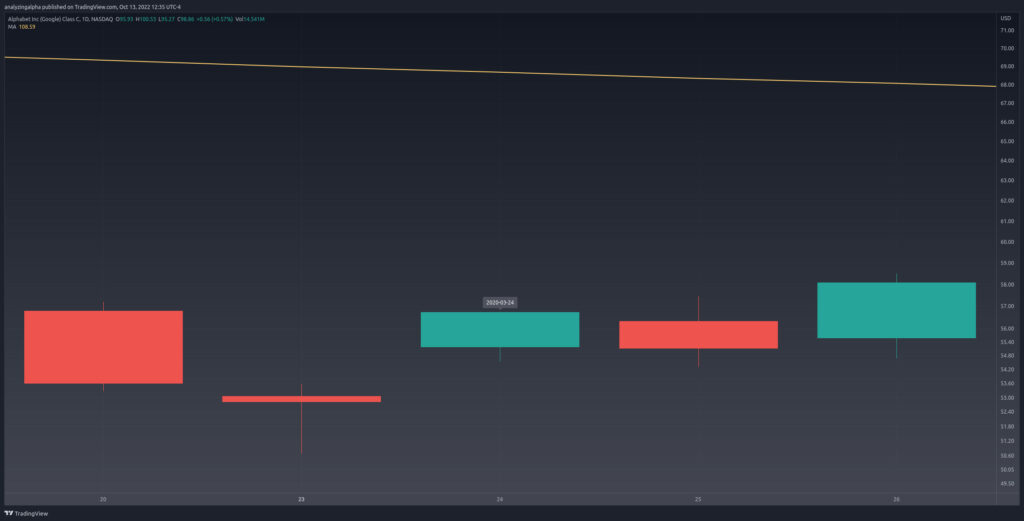
Morning Star
The morning doji star is a three-bar bullish reversal pattern that’s best traded bullishly in all markets.
Morning Star Identification
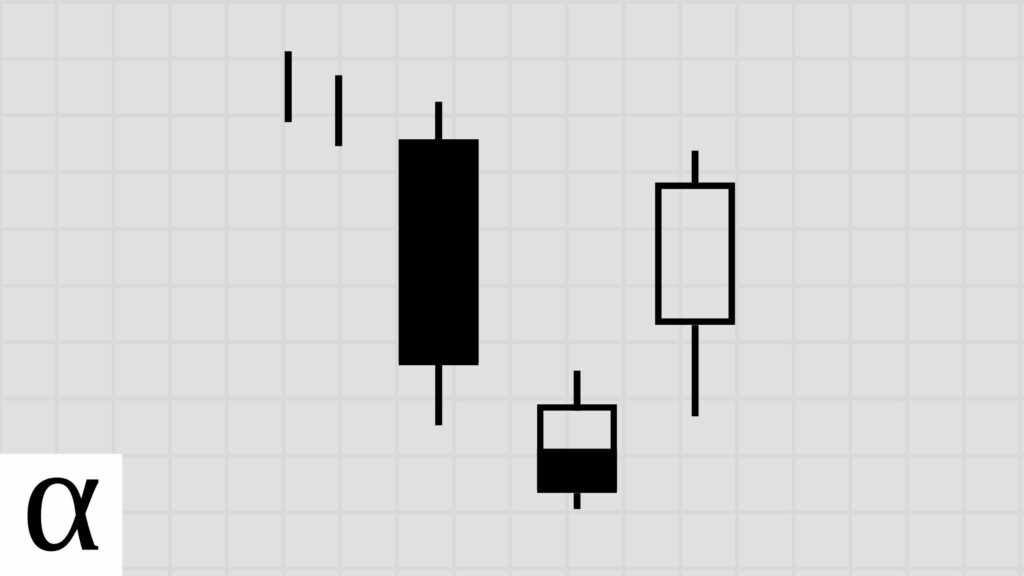
- The first candlestick is bearish and long.
- The second candlestick has a short body and gaps down.
- The third candlestick is bullish and moves well within the first candlestick’s real body.
- The morning star occurs in a downtrend.
Morning Star Example

On Neck
The on neck is a two-bar bearish continuation pattern that’s best traded using volatility-capturing strategies.
On Neck Identification

- The first candlestick is long and bearish.
- The second candlestick is bullish and opens below the prior candlestick’s low with a close equal to the previous low.
- The on neck occurs during a downtrend.
On Neck Example

Piercing
The piercing pattern is a rare two-bar bullish reversal that’s best traded using a bullish volatility-capturing strategy in the stock market. Forex and crypto traders should pass on this pattern due to a lack of statistically significant trading strategies.
Piercing Identification

- The first candlestick is long and bearish.
- The second candlestick is bullish, opens below the prior candlestick’s low, and closes between the prior candle’s open and midpoint.
- The piercing pattern occurs during a downtrend.
Piercing Example

Rickshaw Man
The rickshaw man is a one-bar indecision pattern that’s best traded using mean reversion strategies in all markets.
Rickshaw Man Identification

- A doji body near the midpoint of the candle.
Rickshaw Man Example

Rising Three Methods
The rising three methods have at least four bars and is best traded using bullish strategies. Data-driven traders will want to pass on this pattern due to a lack of daily trading results.
Rickshaw Man Identification

- The first candlestick is bullish and long.
- A group of two or more falling small-real-bodied candles that hold within the first candlestick’s range.
- A final bearish candlestick that opens above the prior small candlestick’s close and closes above the first candlestick’s close.
- The rising three methods must occur during an uptrend.
Rising Three Methods Example

Shooting Star
The shooting star is a one-bar bearish reversal that historically leads to near-term volatility.
Shooting Star Identification

- A small candlestick that gaps up with a long upper wick and little to no lower wick.
- The shooting star occurs in an uptrend.
Shooting Star Example

Stalled Pattern
The stalled pattern is a three-bar bearish reversal that historically leads to bullish movement in the stock market and bearish price action in forex.
Stalled Identification

- Three consecutive bullish candlesticks consecutively closing higher.
- The first candlestick is bullish and long.
- The second candlestick is bullish and long, with little to no upper wick opening within or near the previous body.
- A third candlestick is small, bullish, and rides the shoulder, moving around the prior closing price.
- The stalled pattern occurs in an uptrend.
Stalled Example

Stick Sandwich
The stick sandwich is a three-bar bullish reversal that historically leads to bearish price action in the stock market. Forex and crypto traders should avoid this pattern.
Stick Sandwich Identification

- The first candlestick is bearish.
- The second candlestick is bullish and only trades above the first candlestick’s close.
- The third candlestick is bearish, with a close equal to the first candlestick’s close.
- The stick sandwich occurs in a downtrend.
Stick Sandwich Example

Takuri Line
The takuri, also known as the takuri line, is a one-bar bullish reversal doji that historically leads to bearish price action.
Takuri Line Identification

- A doji candle with little to no upper shadow and a very long lower wick.
- The takuri line occurs in a downtrend.
Takuri Example

Three Black Crows
The three black crows is a rare four-bar bearish reversal that historically leads to bearish volatility.
Three Black Crows Identification
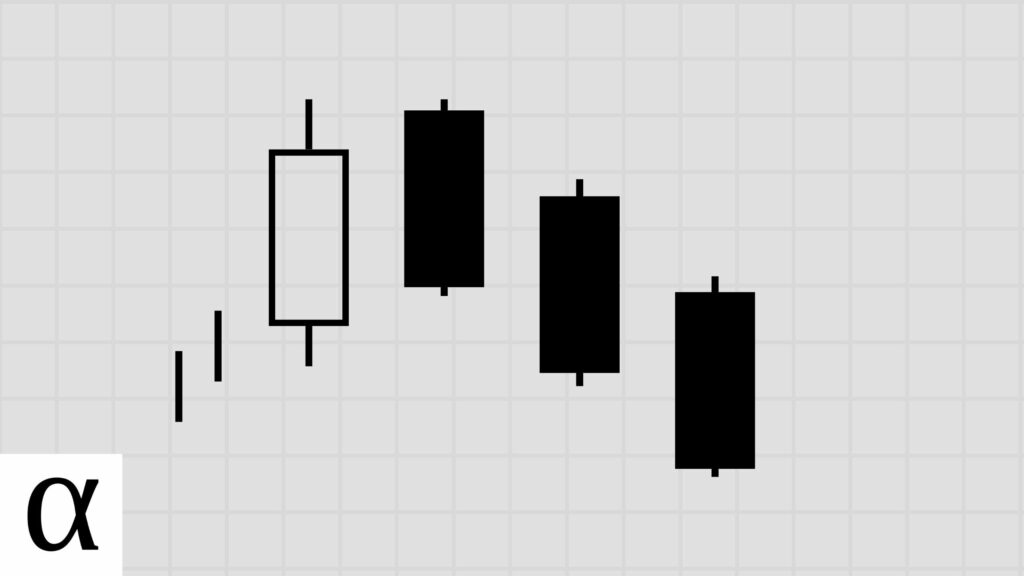
- The first candlestick is bullish.
- The second through fourth candlesticks are consecutively declining bearish candles with little to no lower shadows.
- The second candlestick’s close must be under the first candle’s high.
- The third and fourth candlesticks must open within the prior bearish candlestick’s real body.
- The three black crows occur in an uptrend.
Three Black Crows Example

Three Inside Down
The three inside down is a three-bar bearish reversal that’s best traded using bullish volatility-capturing strategies in the stock and crypto markets, and bearish strategies in the forex market.
Three Inside Down Identification
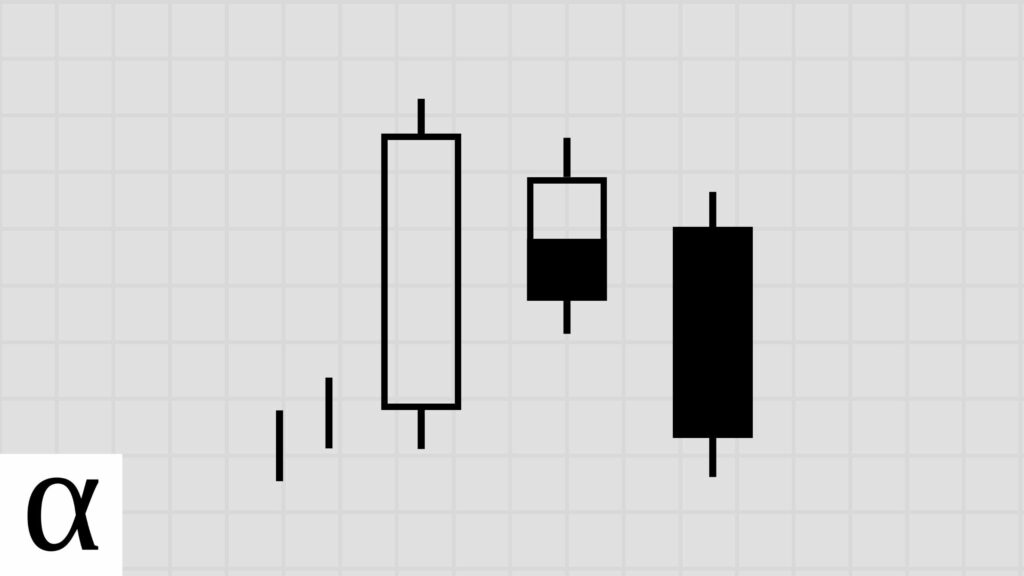
- The first candlestick is bullish with a relatively long real body.
- The second candlestick must have a small real body engulfed by the first candlestick.
- The third bearish candlestick closes lower than the first candlestick’s opening price.
- The three inside down occurs during an uptrend.
Three Inside Down Example

Three Inside Up
The three inside up is a three-bar bullish reversal that’s best traded using bullish mean reversion strategies in the stock, crypto and forex markets.
Three Inside Up Identification

- The first candle is long and bearish.
- The second candlestick has a small body engulfed by the first candlestick.
- The third bearish candlestick closes lower than the first candlestick’s opening.
- The three inside up occurs during a downtrend.
Three Inside Up Example

Three Outside Down
The three outside down is a three-bar bearish reversal that’s best traded using bullish reversion strategies in the stock and crypto markets and bearish reversion in forex.
Three Outside Down Identification
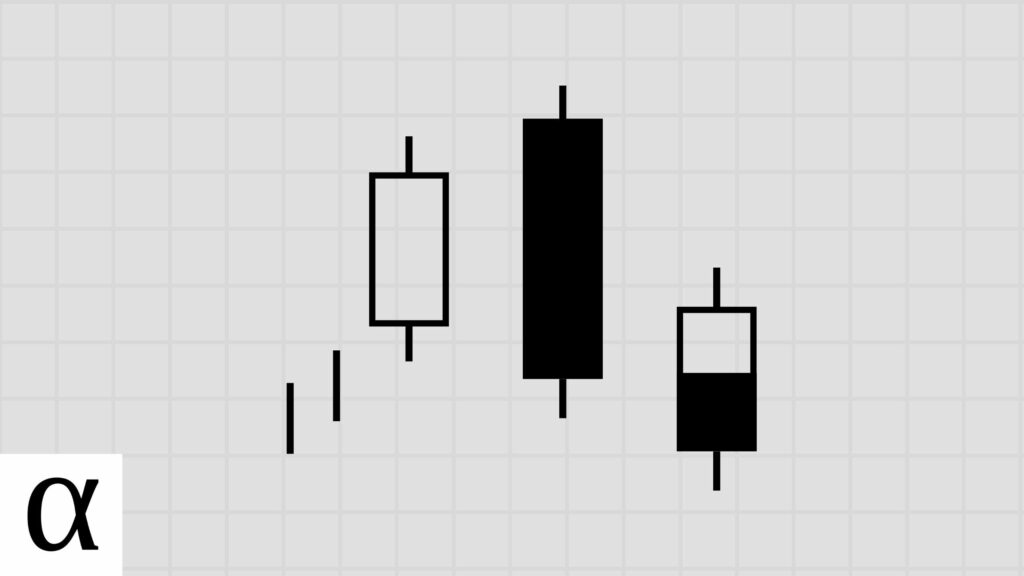
- The first candle is bullish.
- The second candlestick is bearish and engulfs the first.
- The third candlestick is bearish and closes lower than the first candlestick’s open.
- The three outside down occurs during an uptrend.
Three Outside Down Example
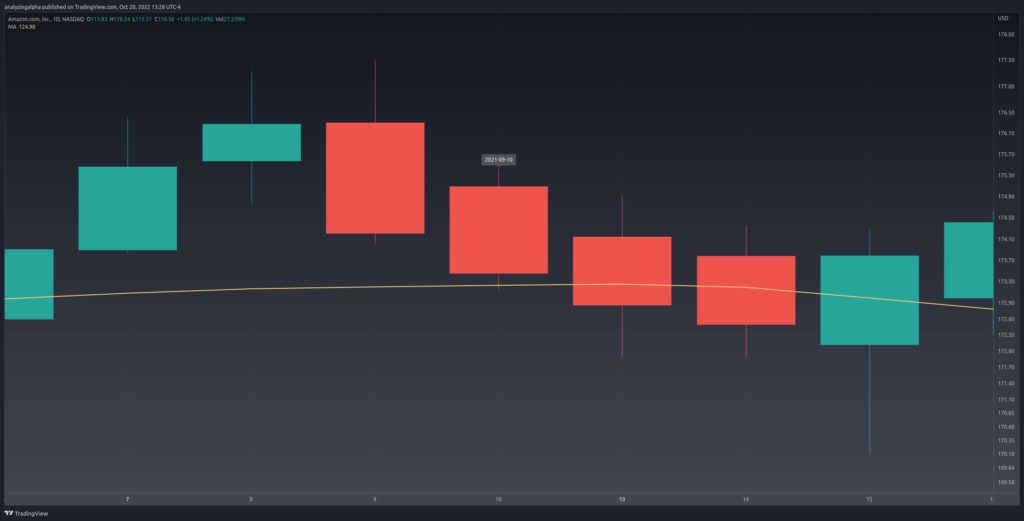
Three Outside Up
The three outside up is a three-bar bearish reversal that’s best traded using bullish strategies in the stock and crypto markets and bearish volatility-capturing strategies in forex.
Three Outside Up Identification
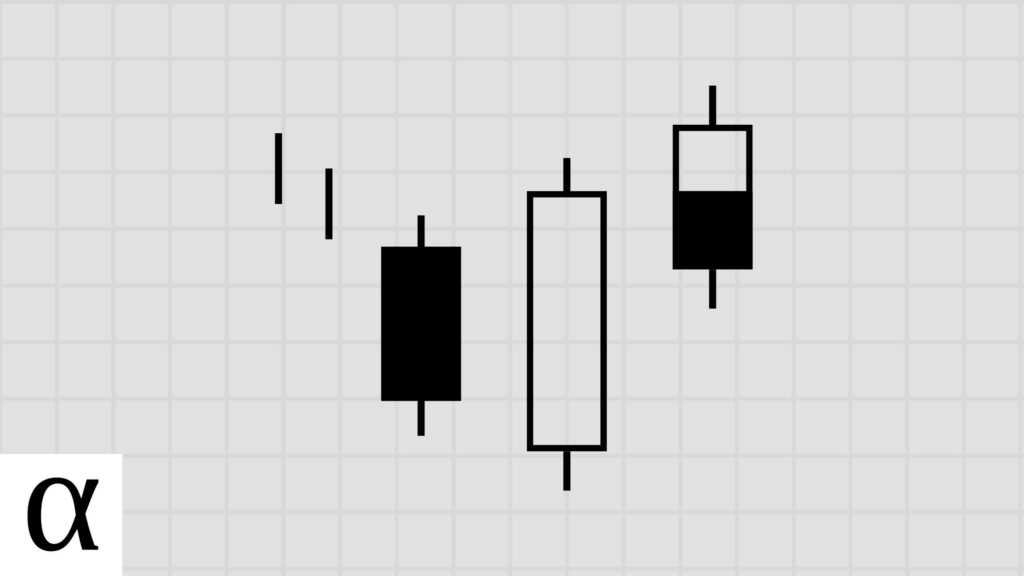
- The first candle is bearish.
- The second candlestick is bullish and engulfs the first.
- The third candlestick is bullish and closes higher than the first candle’s opening price.
- The three outside up occurs during a downtrend.
Three Outside Up Example

Three Stars in the South
The three stars in the south is an extremely rare three-bar bullish reversal candlestick pattern. Data-driven traders should avoid this pattern on the daily timeframe due to the lack of statistically significant trading results.
Three Stars in the South Identification

- The first candlestick is a long bearish candle with a long lower wick.
- The second candle is bearish and opens higher than the previous close but within the range of the prior candlestick.
- The second candlestick must have a lower wick but no longer than the previous candlestick’s wick.
- The third candlestick is a small bearish marubozu engulfed by the previous candlesticks’ range.
- The three stars in the south occurs within a downtrend.
Three Stars in the South Example

Three White Soldiers
The three advancing white soldiers, also known as the three white soldiers, is a three-bar candlestick pattern using bullish reversal strategies in the stock market.
Three Advancing White Soldiers Identification
- Three bullish medium to large candles similar in size consecutively closing higher.
- Each candlestick must open within or near the prior candlestick’s real body and close at or near the high of the day.
- The three white soldiers occur during a downtrend.
Three Advancing White Soldiers Example

Thrusting Line Pattern
The thrusting line pattern, also known as the thrusting pattern, is a rare two-bar bearish continuation that’s best traded in the stock market using bullish mean reversion trading strategies.
Thrusting Line Identification

- The first candlestick is bearish and large.
- The second candlestick is bullish, opens below the prior low, and closes into the previous body below the midpoint.
- The thrusting pattern must occur during a downtrend.
Thrusting Line Example

Two Crows
The two crows is a rare three-candle bearish reversal that’s best traded using bullish volatility-capturing strategies in the stock market.
Two Crows Identification
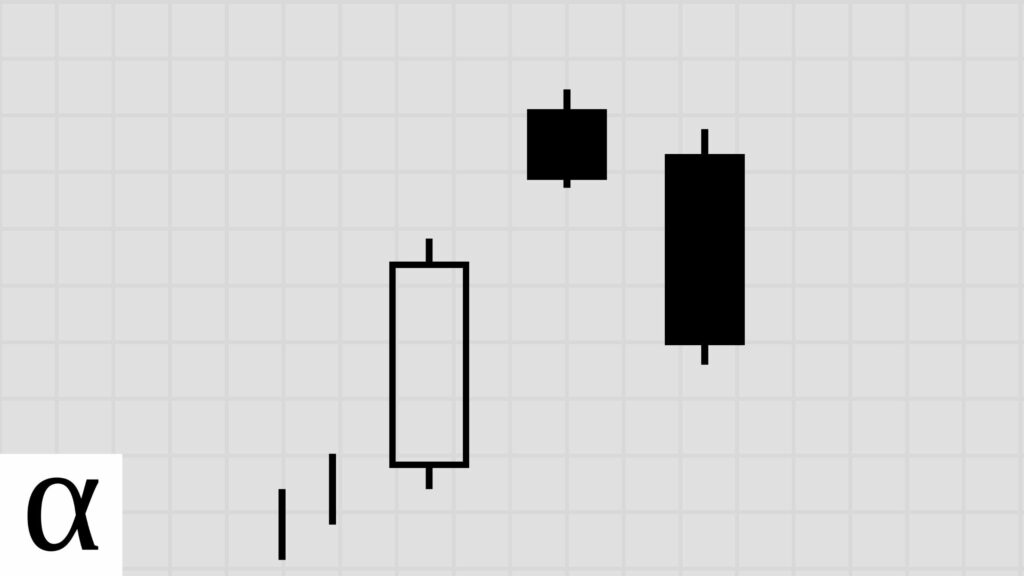
- The first candlestick is long and bullish.
- The second candle is bearish and closes above the prior close.
- The third candlestick is bearish, opens within the second candlestick’s body, and closes within the first candle’s body.
- The two crows occurs in an uptrend.
Two Crows Example
Unique Three River Bottom
The unique three river bottom is a rare three-candle bullish reversal that suggests volatility is ahead.
Unique Three River Bottom Identification

- The first candlestick is bearish and large.
- The second candlestick is bearish, its body engulfed by the first candlestick while having a lower low than the first.
- The third candlestick is small and bullish, with an open not lower than the middle candlestick’s low.
- The unique three river bottom occurs during a downtrend.
Unique Three River Bottom Example

Up Gap Side-by-Side
The up gap side-by-side, also known as the bullish side-by-side white lines, is a three-candle bullish continuation that should be traded as intended in the stock market and using bearish bounce strategies in forex.
Up Gap Side-by-Side Identification

- The first candle is of any color.
- The second candlestick must gap higher and be bullish.
- The third candlestick must have a similar size and opening to the second candlestick.
- The up gap side-by-side occurs during an uptrend.
Up Gap Side-by-Side Example

Upside Gap Three Methods
The upside gap three methods is a rare three-candle bullish continuation that should be traded to capture bullish volatility in the stock market.
Upside Gap Three Methods Identification

- The first candlestick is bullish.
- The second candlestick is bullish and gaps up.
- The third candlestick is bearish, opens with the second candlestick’s real body, and closes within the first candlestick’s body.
- The upside gap three methods occurs during an uptrend.
Upside Gap Three Methods Example

Upside Gap Two Crows
The upside gap two crows is a rare three-candle bearish reversal that should be traded to capture bullish volatility in the stock market.
Upside Gap Two Crows Identification
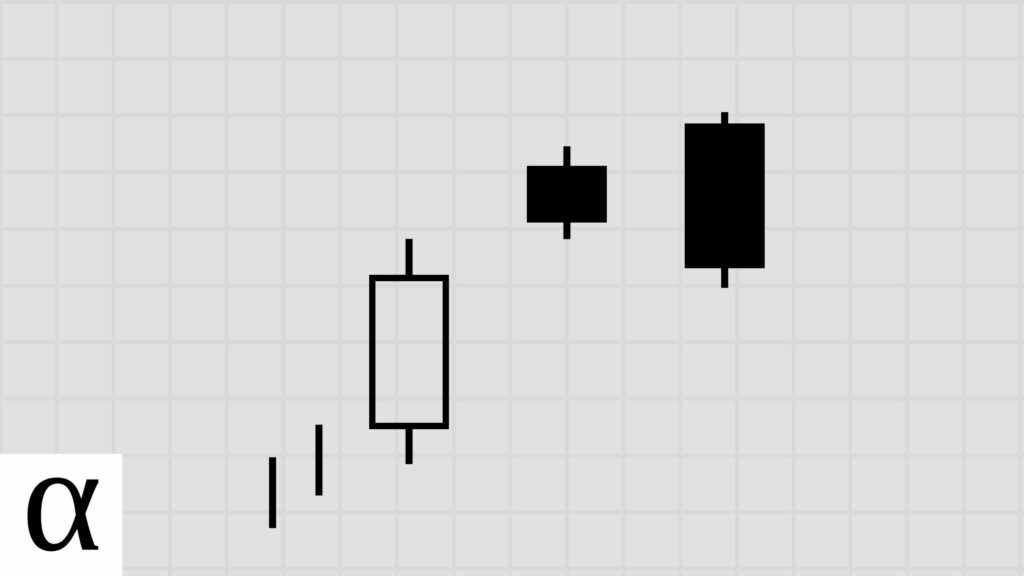
- The first candlestick is bullish.
- The second candlestick is bearish with a small body and closes higher than the previous, creating a gap.
- The third candlestick is bearish and engulfs the second candlestick’s body while closing above the first candlestick’s close.
- The upside gap two crows occurs during an uptrend.
Upside Gap Two Crows Example
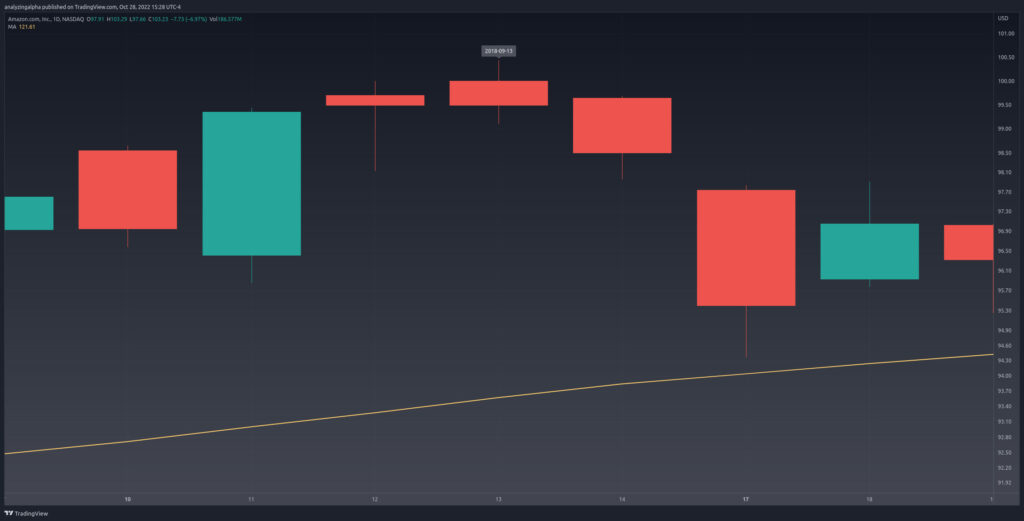
Upside Tasuki Gap
The upside tasuki gap is a rare three-candle bullish continuation that is best traded with bullish volatility-capturing strategies in the stock market.
Upside Tasuki Gap Identification
- A first candlestick.
- The second candlestick is bullish and gaps up.
- The third candlestick is bearish, opens within the prior candlestick’s real body, and closes within the gap.
- The upside tasuki gap occurs during an uptrend.
Upside Tasuki Gap Example
