The bearish harami cross is a two-bar bearish reversal Japanese candlestick pattern that suggests bullish volatility in the stock and crypto markets and a bearish bounce in the forex markets, according to the data.
The pattern loses money in every market tested using traditional technical analysis methods.
But before you use your samurai sword to remove this technical analysis pattern from existence, what if I told you that by using data, you could turn this into a consistent winner?
Would that excite you?
If so, keep reading to learn how to trade bearish harami cross candlestick patterns in a profitable, data-driven way.
What Is a Bearish Harami Cross Candlestick Pattern?
The bearish harami cross is a two-bar bearish reversal pattern that alerts traders of an incoming bearish reversal.
The name “Harami” means pregnant woman in Japanese, and the pattern is named as such due to how it looks on a candlestick chart.
And while the data does point to this pattern being bearish, it indicates incoming volatility much better.
But before we dive into the history of this bearish harami cross pattern, let’s learn how to identify it on our candlestick charts.
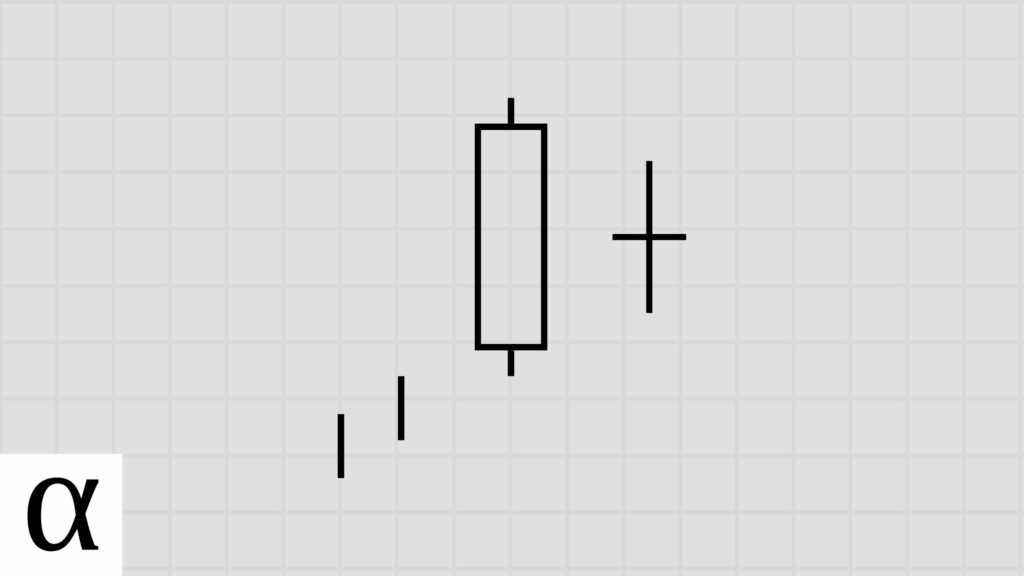
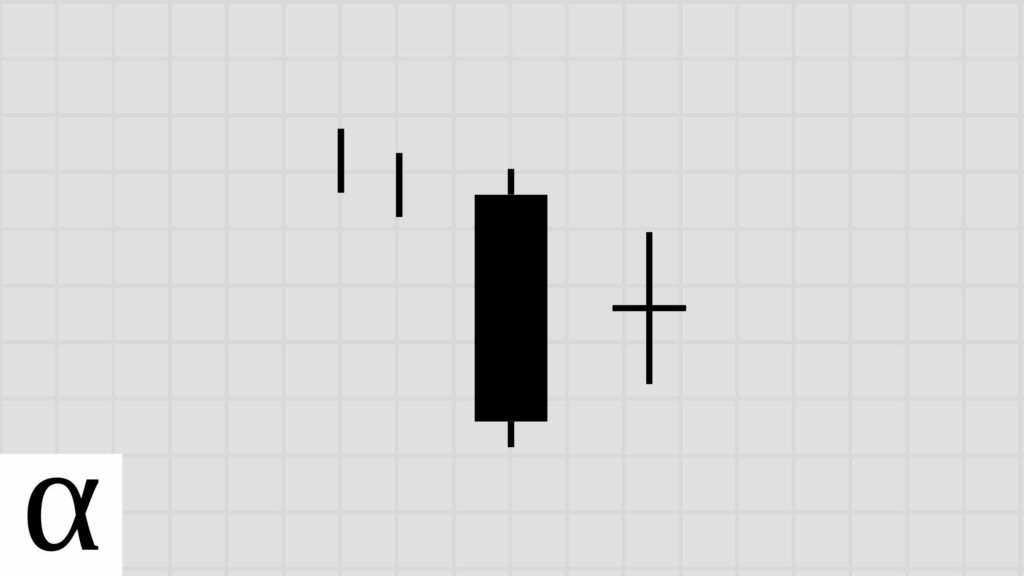
How to Identify the Bearish Harami Cross Candlestick Pattern

The following are the requirements for a valid bearish harami cross pattern:
- The first candle must have a long bullish real body.
- The second candle is a doji engulfed by the first.
- The bearish harami cross must occur in an uptrend.
Engulfing means that one candle’s open and close fit within the real body of the engulfing candle. In bearish harami cross patterns, the second doji candlestick is engulfed by the first candlestick.
The bearish harami cross appears on the Brookfield Asset Management (BAM) August 2nd, 2019, daily chart.
The price is above the 50-day simple moving average, which we’re using as a proxy for a short-term uptrend. The first bar is a relatively long bullish green marubozu candlestick. The second bar is a doji engulfed by the first bar, fulfilling all the pattern requirements.
With an understanding of how to identify this supposed bearish reversal pattern, let’s learn how to trade this harami pattern optimally.
How to Trade the Bearish Harami Cross Pattern
The bearish harami cross is best traded using a bullish mean reversion setup in all markets.
But before we optimize, let’s understand how most professional traders erroneously trade this specific pattern.
Bearish Harami Cross Bearish Reversal Trade Setup

With the price above the 50-day simple moving average and a large green candle followed by a doji engulfed in the former, the pattern is set.
Traditional traders enter short on a break of the low of the second candle and place a stop loss above the high of the first large candlestick.
The trade was profitable in the Apple example above, but expecting a possible price reversal goes against what worked best historically.
Bearish Harami Cross Bullish Mean Reversion Trade Setup

Practice makes perfect so let’s identify the bearish harami cross once again.
The stock price is above the 50-day moving average, giving us an uptrend. We see a long bullish green marubozu followed by a bearish doij candlestick whose real body is engulfed by the prior long white candle.
With the pattern identified, wise stock and crypto traders wait for the price to cross down below the low of the pattern and enter long when prices come back up through the same pattern low with a stop loss of one ATR.
Let’s make this lucid using the Danaher example above.
The low of the bearish harami cross pattern occurs at $80.17 on the first candle. On the first day after pattern identification, the price does not drop below the low, so no action is taken. On the second day, the price drops below the pattern low and retraces through that low, triggering a long entry at $80.17.
And even though this trade turned out profitably, I would argue that the most competent traders wouldn’t trade so close to an earnings announcement on candlestick patterns alone.
And while not optimal, trading the volatility bearish is also a profitable proposition.
Bearish Harami Cross Bearish Mean Reversion Trade Setup
The bearish mean reversion setup mirrors its bullish mean reversion counterpart.
Let’s get right to the trade as we already understand how to identify the bearish harami cross.
Once the pattern is identified, intelligent traders will wait for a break of the high of the pattern and then enter short when the price retraces through that same high.
Using the Euro daily on May 10th, 2021, the pattern high is set on the second day at $1.21782. The price moves above and below the pattern high the next day, triggering an entry at $1.21782, leading to a profitable trade.
Does the Bearish Harami Cross Pattern Work? (Backtest Results)
Using the following rules, I backtested the bearish harami cross candlestick pattern on the daily timeframe in the crypto, forex, and stock markets.
- A close above the 50-day SMA constitutes an uptrend.
- I tested risk-reward ranges from 1 to 5.
- The optimal risk-reward ratio is selected using profit per bar.
- Entry and exits are discussed in the how-to trade section above.
- Confirmation must occur within three days of the pattern signal.
| Id | Pattern | Pattern Bars | Required Trend | Traditional Strategy | Strategy | Market | RR | Setup | Tickers | Signals | Trades | Trade Bars | Edge | Edge Per Bar | Confirm % | Win % | Cons Wins | Cons Losses | Avg. Trade Bars | Avg. Win Bars | Avg. Loss Bars | Details |
|---|---|---|---|---|---|---|---|---|---|---|---|---|---|---|---|---|---|---|---|---|---|---|
| 8,491 | bearish_harami_cross | 2 | uptrend | bearish reversal | bullish mean reversion | crypto | 1 | atr-pattern_low | 130 | 646 | 228 | 1,352 | 0.285 | 0.14 | 0.35 | 0.65 | 6 | 3 | 5.93 | 5.13 | 7.38 | https://analyzingalpha.com/bearish-harami-cross-candlestick-pattern |
| 8,492 | bearish_harami_cross | 2 | uptrend | bearish reversal | bullish mean reversion | crypto | 2 | atr-pattern_low | 130 | 632 | 221 | 2,713 | 0.448 | 0.22 | 0.35 | 0.48 | 6 | 5 | 12.28 | 10.03 | 14.39 | https://analyzingalpha.com/bearish-harami-cross-candlestick-pattern |
| 8,493 | bearish_harami_cross | 2 | uptrend | bearish reversal | bullish mean reversion | crypto | 3 | atr-pattern_low | 130 | 625 | 217 | 3,346 | 0.566 | 0.28 | 0.35 | 0.39 | 6 | 5 | 15.42 | 14.44 | 16.05 | https://analyzingalpha.com/bearish-harami-cross-candlestick-pattern |
| 8,494 | bearish_harami_cross | 2 | uptrend | bearish reversal | bullish mean reversion | crypto | 4 | atr-pattern_low | 130 | 622 | 216 | 3,800 | 0.646 | 0.32 | 0.35 | 0.33 | 5 | 5 | 17.59 | 19.23 | 16.79 | https://analyzingalpha.com/bearish-harami-cross-candlestick-pattern |
| 8,495 | bearish_harami_cross | 2 | uptrend | bearish reversal | bullish mean reversion | crypto | 5 | atr-pattern_low | 130 | 621 | 215 | 4,189 | 0.730 | 0.37 | 0.35 | 0.29 | 3 | 5 | 19.48 | 23.87 | 17.71 | https://analyzingalpha.com/bearish-harami-cross-candlestick-pattern |
| 8,496 | bearish_harami_cross | 2 | uptrend | bearish reversal | bullish mean reversion | forex | 1 | atr-pattern_low | 714 | 7,017 | 2,125 | 10,871 | 0.262 | 0.13 | 0.30 | 0.63 | 10 | 4 | 5.12 | 5.35 | 4.72 | https://analyzingalpha.com/bearish-harami-cross-candlestick-pattern |
| 8,497 | bearish_harami_cross | 2 | uptrend | bearish reversal | bullish mean reversion | forex | 2 | atr-pattern_low | 714 | 6,868 | 2,055 | 25,836 | 0.222 | 0.11 | 0.30 | 0.41 | 6 | 7 | 12.57 | 14.98 | 10.93 | https://analyzingalpha.com/bearish-harami-cross-candlestick-pattern |
| 8,498 | bearish_harami_cross | 2 | uptrend | bearish reversal | bullish mean reversion | forex | 3 | atr-pattern_low | 714 | 6,767 | 2,011 | 39,366 | 0.157 | 0.08 | 0.30 | 0.29 | 4 | 10 | 19.58 | 29.48 | 15.54 | https://analyzingalpha.com/bearish-harami-cross-candlestick-pattern |
| 8,499 | bearish_harami_cross | 2 | uptrend | bearish reversal | bullish mean reversion | forex | 4 | atr-pattern_low | 714 | 6,699 | 1,985 | 50,509 | 0.104 | 0.05 | 0.30 | 0.22 | 4 | 10 | 25.45 | 44.75 | 19.98 | https://analyzingalpha.com/bearish-harami-cross-candlestick-pattern |
| 8,500 | bearish_harami_cross | 2 | uptrend | bearish reversal | bullish mean reversion | forex | 5 | atr-pattern_low | 714 | 6,655 | 1,965 | 58,268 | 0.090 | 0.05 | 0.30 | 0.18 | 5 | 10 | 29.65 | 59.15 | 23.10 | https://analyzingalpha.com/bearish-harami-cross-candlestick-pattern |
| 8,501 | bearish_harami_cross | 2 | uptrend | bearish reversal | bullish mean reversion | stock | 1 | atr-pattern_low | 4,784 | 104,737 | 39,675 | 139,269 | 0.179 | 0.09 | 0.38 | 0.59 | 15 | 10 | 3.51 | 3.33 | 3.77 | https://analyzingalpha.com/bearish-harami-cross-candlestick-pattern |
| 8,502 | bearish_harami_cross | 2 | uptrend | bearish reversal | bullish mean reversion | stock | 2 | atr-pattern_low | 4,784 | 103,071 | 38,942 | 262,159 | 0.232 | 0.12 | 0.38 | 0.41 | 8 | 12 | 6.73 | 7.87 | 5.94 | https://analyzingalpha.com/bearish-harami-cross-candlestick-pattern |
| 8,503 | bearish_harami_cross | 2 | uptrend | bearish reversal | bullish mean reversion | stock | 3 | atr-pattern_low | 4,784 | 101,729 | 38,392 | 368,511 | 0.286 | 0.14 | 0.38 | 0.32 | 5 | 16 | 9.60 | 13.53 | 7.73 | https://analyzingalpha.com/bearish-harami-cross-candlestick-pattern |
| 8,504 | bearish_harami_cross | 2 | uptrend | bearish reversal | bullish mean reversion | stock | 4 | atr-pattern_low | 4,784 | 100,578 | 37,900 | 465,303 | 0.346 | 0.17 | 0.38 | 0.27 | 5 | 17 | 12.28 | 20.16 | 9.37 | https://analyzingalpha.com/bearish-harami-cross-candlestick-pattern |
| 8,505 | bearish_harami_cross | 2 | uptrend | bearish reversal | bullish mean reversion | stock | 5 | atr-pattern_low | 4,784 | 99,585 | 37,470 | 556,322 | 0.400 | 0.20 | 0.38 | 0.23 | 4 | 18 | 14.85 | 27.92 | 10.85 | https://analyzingalpha.com/bearish-harami-cross-candlestick-pattern |
| 9,971 | bearish_harami_cross | 2 | uptrend | bearish reversal | bearish reversal | crypto | 1 | high-close | 130 | 651 | 641 | 1,425 | -0.277 | -0.14 | 0.98 | 0.36 | 10 | 10 | 2.22 | 2.94 | 1.81 | https://analyzingalpha.com/bearish-harami-cross-candlestick-pattern |
| 9,972 | bearish_harami_cross | 2 | uptrend | bearish reversal | bearish reversal | crypto | 2 | high-close | 130 | 642 | 631 | 2,212 | -0.156 | -0.08 | 0.98 | 0.28 | 8 | 11 | 3.51 | 5.93 | 2.55 | https://analyzingalpha.com/bearish-harami-cross-candlestick-pattern |
| 9,973 | bearish_harami_cross | 2 | uptrend | bearish reversal | bearish reversal | crypto | 3 | high-close | 130 | 632 | 619 | 2,466 | -0.071 | -0.04 | 0.98 | 0.23 | 5 | 13 | 3.98 | 6.37 | 3.26 | https://analyzingalpha.com/bearish-harami-cross-candlestick-pattern |
| 9,974 | bearish_harami_cross | 2 | uptrend | bearish reversal | bearish reversal | crypto | 4 | high-close | 130 | 628 | 615 | 3,541 | -0.080 | -0.04 | 0.98 | 0.19 | 5 | 13 | 5.76 | 9.55 | 4.89 | https://analyzingalpha.com/bearish-harami-cross-candlestick-pattern |
| 9,975 | bearish_harami_cross | 2 | uptrend | bearish reversal | bearish reversal | crypto | 5 | high-close | 130 | 627 | 614 | 4,120 | -0.020 | -0.01 | 0.98 | 0.16 | 4 | 13 | 6.71 | 6.46 | 6.76 | https://analyzingalpha.com/bearish-harami-cross-candlestick-pattern |
| 9,976 | bearish_harami_cross | 2 | uptrend | bearish reversal | bearish reversal | forex | 1 | high-close | 714 | 7,057 | 6,922 | 11,174 | -0.301 | -0.15 | 0.98 | 0.35 | 33 | 13 | 1.61 | 1.74 | 1.55 | https://analyzingalpha.com/bearish-harami-cross-candlestick-pattern |
| 9,977 | bearish_harami_cross | 2 | uptrend | bearish reversal | bearish reversal | forex | 2 | high-close | 714 | 7,038 | 6,902 | 15,249 | -0.164 | -0.08 | 0.98 | 0.28 | 27 | 14 | 2.21 | 2.94 | 1.93 | https://analyzingalpha.com/bearish-harami-cross-candlestick-pattern |
| 9,978 | bearish_harami_cross | 2 | uptrend | bearish reversal | bearish reversal | forex | 3 | high-close | 714 | 7,006 | 6,868 | 21,351 | -0.086 | -0.04 | 0.98 | 0.23 | 22 | 19 | 3.11 | 5.01 | 2.55 | https://analyzingalpha.com/bearish-harami-cross-candlestick-pattern |
| 9,979 | bearish_harami_cross | 2 | uptrend | bearish reversal | bearish reversal | forex | 4 | high-close | 714 | 6,990 | 6,849 | 26,590 | -0.084 | -0.04 | 0.98 | 0.18 | 21 | 24 | 3.88 | 6.69 | 3.25 | https://analyzingalpha.com/bearish-harami-cross-candlestick-pattern |
| 9,980 | bearish_harami_cross | 2 | uptrend | bearish reversal | bearish reversal | forex | 5 | high-close | 714 | 6,983 | 6,842 | 30,977 | -0.055 | -0.03 | 0.98 | 0.16 | 19 | 24 | 4.53 | 9.51 | 3.60 | https://analyzingalpha.com/bearish-harami-cross-candlestick-pattern |
| 9,981 | bearish_harami_cross | 2 | uptrend | bearish reversal | bearish reversal | stock | 1 | high-close | 4,784 | 106,110 | 96,089 | 207,663 | -0.124 | -0.06 | 0.91 | 0.44 | 32 | 13 | 2.16 | 2.29 | 2.06 | https://analyzingalpha.com/bearish-harami-cross-candlestick-pattern |
| 9,982 | bearish_harami_cross | 2 | uptrend | bearish reversal | bearish reversal | stock | 2 | high-close | 4,784 | 105,251 | 95,269 | 318,533 | 0.012 | 0.01 | 0.91 | 0.34 | 27 | 19 | 3.34 | 3.85 | 3.09 | https://analyzingalpha.com/bearish-harami-cross-candlestick-pattern |
| 9,983 | bearish_harami_cross | 2 | uptrend | bearish reversal | bearish reversal | stock | 3 | high-close | 4,784 | 104,623 | 94,656 | 417,787 | 0.080 | 0.04 | 0.90 | 0.27 | 23 | 27 | 4.41 | 5.62 | 3.97 | https://analyzingalpha.com/bearish-harami-cross-candlestick-pattern |
| 9,984 | bearish_harami_cross | 2 | uptrend | bearish reversal | bearish reversal | stock | 4 | high-close | 4,784 | 104,050 | 94,105 | 506,687 | 0.120 | 0.06 | 0.90 | 0.23 | 20 | 33 | 5.38 | 7.66 | 4.72 | https://analyzingalpha.com/bearish-harami-cross-candlestick-pattern |
| 9,985 | bearish_harami_cross | 2 | uptrend | bearish reversal | bearish reversal | stock | 5 | high-close | 4,784 | 103,478 | 93,561 | 589,604 | 0.150 | 0.08 | 0.90 | 0.19 | 17 | 33 | 6.30 | 9.98 | 5.43 | https://analyzingalpha.com/bearish-harami-cross-candlestick-pattern |
| 11,191 | bearish_harami_cross | 2 | uptrend | bearish reversal | bullish continuation | crypto | 1 | low-high | 130 | 638 | 419 | 2,202 | 0.101 | 0.05 | 0.66 | 0.55 | 6 | 7 | 5.26 | 5.25 | 5.27 | https://analyzingalpha.com/bearish-harami-cross-candlestick-pattern |
| 11,192 | bearish_harami_cross | 2 | uptrend | bearish reversal | bullish continuation | crypto | 2 | low-high | 130 | 625 | 411 | 3,585 | 0.208 | 0.10 | 0.66 | 0.40 | 4 | 9 | 8.72 | 8.94 | 8.58 | https://analyzingalpha.com/bearish-harami-cross-candlestick-pattern |
| 11,193 | bearish_harami_cross | 2 | uptrend | bearish reversal | bullish continuation | crypto | 3 | low-high | 130 | 620 | 408 | 4,323 | 0.323 | 0.16 | 0.66 | 0.33 | 3 | 9 | 10.60 | 12.07 | 9.86 | https://analyzingalpha.com/bearish-harami-cross-candlestick-pattern |
| 11,194 | bearish_harami_cross | 2 | uptrend | bearish reversal | bullish continuation | crypto | 4 | low-high | 130 | 613 | 402 | 4,973 | 0.434 | 0.22 | 0.66 | 0.29 | 3 | 9 | 12.37 | 14.54 | 11.50 | https://analyzingalpha.com/bearish-harami-cross-candlestick-pattern |
| 11,195 | bearish_harami_cross | 2 | uptrend | bearish reversal | bullish continuation | crypto | 5 | low-high | 130 | 608 | 398 | 5,245 | 0.540 | 0.27 | 0.65 | 0.26 | 3 | 9 | 13.18 | 16.54 | 12.02 | https://analyzingalpha.com/bearish-harami-cross-candlestick-pattern |
| 11,196 | bearish_harami_cross | 2 | uptrend | bearish reversal | bullish continuation | forex | 1 | low-high | 714 | 6,846 | 3,994 | 39,939 | -0.219 | -0.11 | 0.58 | 0.39 | 7 | 19 | 10.00 | 12.40 | 8.46 | https://analyzingalpha.com/bearish-harami-cross-candlestick-pattern |
| 11,197 | bearish_harami_cross | 2 | uptrend | bearish reversal | bullish continuation | forex | 2 | low-high | 714 | 6,703 | 3,904 | 68,911 | -0.272 | -0.14 | 0.58 | 0.24 | 5 | 19 | 17.65 | 28.86 | 14.04 | https://analyzingalpha.com/bearish-harami-cross-candlestick-pattern |
| 11,198 | bearish_harami_cross | 2 | uptrend | bearish reversal | bullish continuation | forex | 3 | low-high | 714 | 6,604 | 3,839 | 90,620 | -0.283 | -0.14 | 0.58 | 0.18 | 5 | 35 | 23.61 | 50.12 | 17.84 | https://analyzingalpha.com/bearish-harami-cross-candlestick-pattern |
| 11,199 | bearish_harami_cross | 2 | uptrend | bearish reversal | bullish continuation | forex | 4 | low-high | 714 | 6,522 | 3,786 | 105,807 | -0.296 | -0.15 | 0.58 | 0.14 | 3 | 35 | 27.95 | 70.32 | 21.02 | https://analyzingalpha.com/bearish-harami-cross-candlestick-pattern |
| 11,200 | bearish_harami_cross | 2 | uptrend | bearish reversal | bullish continuation | forex | 5 | low-high | 714 | 6,471 | 3,748 | 119,264 | -0.270 | -0.14 | 0.58 | 0.12 | 3 | 35 | 31.82 | 95.05 | 23.06 | https://analyzingalpha.com/bearish-harami-cross-candlestick-pattern |
| 11,201 | bearish_harami_cross | 2 | uptrend | bearish reversal | bullish continuation | stock | 1 | low-high | 4,784 | 103,489 | 71,994 | 382,253 | -0.035 | -0.02 | 0.70 | 0.49 | 12 | 13 | 5.31 | 5.50 | 5.13 | https://analyzingalpha.com/bearish-harami-cross-candlestick-pattern |
| 11,202 | bearish_harami_cross | 2 | uptrend | bearish reversal | bullish continuation | stock | 2 | low-high | 4,784 | 100,410 | 69,776 | 626,327 | 0.046 | 0.02 | 0.69 | 0.35 | 7 | 19 | 8.98 | 11.67 | 7.54 | https://analyzingalpha.com/bearish-harami-cross-candlestick-pattern |
| 11,203 | bearish_harami_cross | 2 | uptrend | bearish reversal | bullish continuation | stock | 3 | low-high | 4,784 | 97,956 | 68,009 | 840,948 | 0.114 | 0.06 | 0.69 | 0.28 | 6 | 21 | 12.37 | 19.66 | 9.56 | https://analyzingalpha.com/bearish-harami-cross-candlestick-pattern |
| 11,204 | bearish_harami_cross | 2 | uptrend | bearish reversal | bullish continuation | stock | 4 | low-high | 4,784 | 95,877 | 66,501 | 1,036,939 | 0.166 | 0.08 | 0.69 | 0.23 | 6 | 23 | 15.59 | 29.60 | 11.31 | https://analyzingalpha.com/bearish-harami-cross-candlestick-pattern |
| 11,205 | bearish_harami_cross | 2 | uptrend | bearish reversal | bullish continuation | stock | 5 | low-high | 4,784 | 94,061 | 65,159 | 1,222,440 | 0.220 | 0.11 | 0.69 | 0.20 | 6 | 26 | 18.76 | 40.97 | 13.07 | https://analyzingalpha.com/bearish-harami-cross-candlestick-pattern |
| 11,456 | bearish_harami_cross | 2 | uptrend | bearish reversal | bearish mean reversion | crypto | 1 | atr-pattern_high | 130 | 638 | 336 | 1,183 | -0.019 | -0.01 | 0.53 | 0.49 | 8 | 4 | 3.52 | 3.34 | 3.70 | https://analyzingalpha.com/bearish-harami-cross-candlestick-pattern |
| 11,457 | bearish_harami_cross | 2 | uptrend | bearish reversal | bearish mean reversion | crypto | 2 | atr-pattern_high | 130 | 629 | 330 | 2,280 | -0.218 | -0.11 | 0.52 | 0.26 | 4 | 8 | 6.91 | 9.05 | 6.16 | https://analyzingalpha.com/bearish-harami-cross-candlestick-pattern |
| 11,458 | bearish_harami_cross | 2 | uptrend | bearish reversal | bearish mean reversion | crypto | 3 | atr-pattern_high | 130 | 626 | 328 | 3,309 | -0.206 | -0.10 | 0.52 | 0.20 | 4 | 8 | 10.09 | 19.48 | 7.77 | https://analyzingalpha.com/bearish-harami-cross-candlestick-pattern |
| 11,459 | bearish_harami_cross | 2 | uptrend | bearish reversal | bearish mean reversion | crypto | 4 | atr-pattern_high | 130 | 620 | 323 | 3,826 | -0.362 | -0.18 | 0.52 | 0.13 | 3 | 8 | 11.85 | 28.34 | 9.45 | https://analyzingalpha.com/bearish-harami-cross-candlestick-pattern |
| 11,460 | bearish_harami_cross | 2 | uptrend | bearish reversal | bearish mean reversion | crypto | 5 | atr-pattern_high | 130 | 616 | 321 | 4,694 | -0.385 | -0.19 | 0.52 | 0.10 | 3 | 8 | 14.62 | 48.24 | 10.77 | https://analyzingalpha.com/bearish-harami-cross-candlestick-pattern |
| 11,461 | bearish_harami_cross | 2 | uptrend | bearish reversal | bearish mean reversion | forex | 1 | atr-pattern_high | 714 | 6,985 | 3,395 | 14,829 | 0.303 | 0.15 | 0.49 | 0.65 | 28 | 5 | 4.37 | 4.04 | 4.99 | https://analyzingalpha.com/bearish-harami-cross-candlestick-pattern |
| 11,462 | bearish_harami_cross | 2 | uptrend | bearish reversal | bearish mean reversion | forex | 2 | atr-pattern_high | 714 | 6,814 | 3,304 | 38,823 | 0.254 | 0.13 | 0.48 | 0.42 | 18 | 12 | 11.75 | 13.06 | 10.81 | https://analyzingalpha.com/bearish-harami-cross-candlestick-pattern |
| 11,463 | bearish_harami_cross | 2 | uptrend | bearish reversal | bearish mean reversion | forex | 3 | atr-pattern_high | 714 | 6,718 | 3,232 | 59,444 | 0.169 | 0.08 | 0.48 | 0.29 | 10 | 13 | 18.39 | 26.61 | 14.98 | https://analyzingalpha.com/bearish-harami-cross-candlestick-pattern |
| 11,464 | bearish_harami_cross | 2 | uptrend | bearish reversal | bearish mean reversion | forex | 4 | atr-pattern_high | 714 | 6,629 | 3,182 | 82,538 | 0.142 | 0.07 | 0.48 | 0.23 | 8 | 13 | 25.94 | 46.31 | 19.94 | https://analyzingalpha.com/bearish-harami-cross-candlestick-pattern |
| 11,465 | bearish_harami_cross | 2 | uptrend | bearish reversal | bearish mean reversion | forex | 5 | atr-pattern_high | 714 | 6,551 | 3,134 | 96,186 | 0.100 | 0.05 | 0.48 | 0.18 | 6 | 14 | 30.69 | 60.26 | 24.03 | https://analyzingalpha.com/bearish-harami-cross-candlestick-pattern |
| 11,466 | bearish_harami_cross | 2 | uptrend | bearish reversal | bearish mean reversion | stock | 1 | atr-pattern_high | 4,784 | 103,970 | 51,315 | 183,011 | 0.138 | 0.07 | 0.49 | 0.57 | 27 | 8 | 3.57 | 3.41 | 3.77 | https://analyzingalpha.com/bearish-harami-cross-candlestick-pattern |
| 11,467 | bearish_harami_cross | 2 | uptrend | bearish reversal | bearish mean reversion | stock | 2 | atr-pattern_high | 4,784 | 102,401 | 50,473 | 340,692 | 0.132 | 0.07 | 0.49 | 0.38 | 20 | 15 | 6.75 | 7.83 | 6.10 | https://analyzingalpha.com/bearish-harami-cross-candlestick-pattern |
| 11,468 | bearish_harami_cross | 2 | uptrend | bearish reversal | bearish mean reversion | stock | 3 | atr-pattern_high | 4,784 | 101,211 | 49,808 | 489,920 | 0.089 | 0.04 | 0.49 | 0.27 | 15 | 22 | 9.84 | 13.84 | 8.33 | https://analyzingalpha.com/bearish-harami-cross-candlestick-pattern |
| 11,469 | bearish_harami_cross | 2 | uptrend | bearish reversal | bearish mean reversion | stock | 4 | atr-pattern_high | 4,784 | 100,286 | 49,280 | 634,114 | 0.050 | 0.03 | 0.49 | 0.21 | 12 | 31 | 12.87 | 21.35 | 10.61 | https://analyzingalpha.com/bearish-harami-cross-candlestick-pattern |
| 11,470 | bearish_harami_cross | 2 | uptrend | bearish reversal | bearish mean reversion | stock | 5 | atr-pattern_high | 4,784 | 99,458 | 48,787 | 769,430 | 0.020 | 0.01 | 0.49 | 0.17 | 10 | 31 | 15.77 | 30.55 | 12.75 | https://analyzingalpha.com/bearish-harami-cross-candlestick-pattern |
| 12,116 | bearish_harami_cross | 2 | uptrend | bearish reversal | bearish reversal | crypto | 1 | high-low | 130 | 644 | 445 | 1,707 | -0.435 | -0.22 | 0.69 | 0.29 | 4 | 9 | 3.84 | 6.06 | 2.95 | https://analyzingalpha.com/bearish-harami-cross-candlestick-pattern |
| 12,117 | bearish_harami_cross | 2 | uptrend | bearish reversal | bearish reversal | crypto | 2 | high-low | 130 | 626 | 433 | 2,290 | -0.398 | -0.20 | 0.69 | 0.20 | 3 | 9 | 5.29 | 7.57 | 4.71 | https://analyzingalpha.com/bearish-harami-cross-candlestick-pattern |
| 12,118 | bearish_harami_cross | 2 | uptrend | bearish reversal | bearish reversal | crypto | 3 | high-low | 130 | 626 | 433 | 3,477 | -0.406 | -0.20 | 0.69 | 0.15 | 3 | 10 | 8.03 | 15.64 | 6.71 | https://analyzingalpha.com/bearish-harami-cross-candlestick-pattern |
| 12,119 | bearish_harami_cross | 2 | uptrend | bearish reversal | bearish reversal | crypto | 4 | high-low | 130 | 621 | 430 | 4,869 | -0.434 | -0.22 | 0.69 | 0.11 | 2 | 13 | 11.32 | 9.57 | 11.55 | https://analyzingalpha.com/bearish-harami-cross-candlestick-pattern |
| 12,120 | bearish_harami_cross | 2 | uptrend | bearish reversal | bearish reversal | crypto | 5 | high-low | 130 | 621 | 430 | 5,305 | -0.425 | -0.21 | 0.69 | 0.10 | 2 | 13 | 12.34 | 12.22 | 12.35 | https://analyzingalpha.com/bearish-harami-cross-candlestick-pattern |
| 12,121 | bearish_harami_cross | 2 | uptrend | bearish reversal | bearish reversal | forex | 1 | high-low | 714 | 6,985 | 4,546 | 14,595 | -0.401 | -0.20 | 0.65 | 0.30 | 9 | 17 | 3.21 | 4.09 | 2.84 | https://analyzingalpha.com/bearish-harami-cross-candlestick-pattern |
| 12,122 | bearish_harami_cross | 2 | uptrend | bearish reversal | bearish reversal | forex | 2 | high-low | 714 | 6,947 | 4,520 | 23,509 | -0.378 | -0.19 | 0.65 | 0.21 | 8 | 25 | 5.20 | 9.05 | 4.20 | https://analyzingalpha.com/bearish-harami-cross-candlestick-pattern |
| 12,123 | bearish_harami_cross | 2 | uptrend | bearish reversal | bearish reversal | forex | 3 | high-low | 714 | 6,927 | 4,507 | 30,340 | -0.388 | -0.19 | 0.65 | 0.15 | 7 | 25 | 6.73 | 14.49 | 5.32 | https://analyzingalpha.com/bearish-harami-cross-candlestick-pattern |
| 12,124 | bearish_harami_cross | 2 | uptrend | bearish reversal | bearish reversal | forex | 4 | high-low | 714 | 6,909 | 4,495 | 37,222 | -0.412 | -0.21 | 0.65 | 0.12 | 4 | 25 | 8.28 | 22.82 | 6.35 | https://analyzingalpha.com/bearish-harami-cross-candlestick-pattern |
| 12,125 | bearish_harami_cross | 2 | uptrend | bearish reversal | bearish reversal | forex | 5 | high-low | 714 | 6,894 | 4,484 | 44,091 | -0.415 | -0.21 | 0.65 | 0.10 | 4 | 25 | 9.83 | 32.76 | 7.38 | https://analyzingalpha.com/bearish-harami-cross-candlestick-pattern |
| 12,126 | bearish_harami_cross | 2 | uptrend | bearish reversal | bearish reversal | stock | 1 | high-low | 4,784 | 104,870 | 74,239 | 248,823 | -0.160 | -0.08 | 0.71 | 0.42 | 28 | 16 | 3.35 | 3.73 | 3.08 | https://analyzingalpha.com/bearish-harami-cross-candlestick-pattern |
| 12,127 | bearish_harami_cross | 2 | uptrend | bearish reversal | bearish reversal | stock | 2 | high-low | 4,784 | 103,758 | 73,360 | 402,948 | -0.126 | -0.06 | 0.71 | 0.29 | 22 | 24 | 5.49 | 7.14 | 4.81 | https://analyzingalpha.com/bearish-harami-cross-candlestick-pattern |
| 12,128 | bearish_harami_cross | 2 | uptrend | bearish reversal | bearish reversal | stock | 3 | high-low | 4,784 | 102,821 | 72,599 | 548,546 | -0.117 | -0.06 | 0.71 | 0.22 | 18 | 30 | 7.56 | 11.45 | 6.45 | https://analyzingalpha.com/bearish-harami-cross-candlestick-pattern |
| 12,129 | bearish_harami_cross | 2 | uptrend | bearish reversal | bearish reversal | stock | 4 | high-low | 4,784 | 102,049 | 72,025 | 674,562 | -0.112 | -0.06 | 0.71 | 0.18 | 14 | 38 | 9.37 | 16.78 | 7.78 | https://analyzingalpha.com/bearish-harami-cross-candlestick-pattern |
| 12,130 | bearish_harami_cross | 2 | uptrend | bearish reversal | bearish reversal | stock | 5 | high-low | 4,784 | 101,232 | 71,382 | 795,833 | -0.120 | -0.06 | 0.71 | 0.15 | 13 | 41 | 11.15 | 23.41 | 9.06 | https://analyzingalpha.com/bearish-harami-cross-candlestick-pattern |
| 13,276 | bearish_harami_cross | 2 | uptrend | bearish reversal | bullish continuation | crypto | 1 | low-close | 130 | 653 | 633 | 2,159 | 0.023 | 0.01 | 0.97 | 0.51 | 6 | 7 | 3.41 | 3.54 | 3.27 | https://analyzingalpha.com/bearish-harami-cross-candlestick-pattern |
| 13,277 | bearish_harami_cross | 2 | uptrend | bearish reversal | bullish continuation | crypto | 2 | low-close | 130 | 636 | 616 | 3,433 | 0.206 | 0.10 | 0.97 | 0.40 | 4 | 7 | 5.57 | 6.38 | 5.03 | https://analyzingalpha.com/bearish-harami-cross-candlestick-pattern |
| 13,278 | bearish_harami_cross | 2 | uptrend | bearish reversal | bullish continuation | crypto | 3 | low-close | 130 | 627 | 608 | 4,494 | 0.277 | 0.14 | 0.97 | 0.32 | 4 | 10 | 7.39 | 9.11 | 6.58 | https://analyzingalpha.com/bearish-harami-cross-candlestick-pattern |
| 13,279 | bearish_harami_cross | 2 | uptrend | bearish reversal | bullish continuation | crypto | 4 | low-close | 130 | 620 | 599 | 5,188 | 0.416 | 0.21 | 0.97 | 0.28 | 4 | 10 | 8.66 | 10.94 | 7.76 | https://analyzingalpha.com/bearish-harami-cross-candlestick-pattern |
| 13,280 | bearish_harami_cross | 2 | uptrend | bearish reversal | bullish continuation | crypto | 5 | low-close | 130 | 613 | 593 | 5,748 | 0.575 | 0.29 | 0.97 | 0.26 | 3 | 10 | 9.69 | 13.28 | 8.41 | https://analyzingalpha.com/bearish-harami-cross-candlestick-pattern |
| 13,281 | bearish_harami_cross | 2 | uptrend | bearish reversal | bullish continuation | forex | 1 | low-close | 714 | 6,793 | 6,624 | 45,680 | -0.125 | -0.06 | 0.98 | 0.44 | 6 | 18 | 6.90 | 6.08 | 7.53 | https://analyzingalpha.com/bearish-harami-cross-candlestick-pattern |
| 13,282 | bearish_harami_cross | 2 | uptrend | bearish reversal | bullish continuation | forex | 2 | low-close | 714 | 6,621 | 6,450 | 78,293 | -0.162 | -0.08 | 0.97 | 0.28 | 5 | 27 | 12.14 | 16.15 | 10.59 | https://analyzingalpha.com/bearish-harami-cross-candlestick-pattern |
| 13,283 | bearish_harami_cross | 2 | uptrend | bearish reversal | bullish continuation | forex | 3 | low-close | 714 | 6,501 | 6,322 | 101,006 | -0.191 | -0.10 | 0.97 | 0.20 | 4 | 53 | 15.98 | 26.79 | 13.22 | https://analyzingalpha.com/bearish-harami-cross-candlestick-pattern |
| 13,284 | bearish_harami_cross | 2 | uptrend | bearish reversal | bullish continuation | forex | 4 | low-close | 714 | 6,412 | 6,226 | 118,667 | -0.216 | -0.11 | 0.97 | 0.16 | 3 | 56 | 19.06 | 41.17 | 14.97 | https://analyzingalpha.com/bearish-harami-cross-candlestick-pattern |
| 13,285 | bearish_harami_cross | 2 | uptrend | bearish reversal | bullish continuation | forex | 5 | low-close | 714 | 6,336 | 6,148 | 136,022 | -0.230 | -0.12 | 0.97 | 0.13 | 3 | 56 | 22.12 | 60.15 | 16.53 | https://analyzingalpha.com/bearish-harami-cross-candlestick-pattern |
| 13,286 | bearish_harami_cross | 2 | uptrend | bearish reversal | bullish continuation | stock | 1 | low-close | 4,784 | 104,906 | 93,927 | 359,115 | -0.019 | -0.01 | 0.90 | 0.49 | 10 | 13 | 3.82 | 3.93 | 3.72 | https://analyzingalpha.com/bearish-harami-cross-candlestick-pattern |
| 13,287 | bearish_harami_cross | 2 | uptrend | bearish reversal | bullish continuation | stock | 2 | low-close | 4,784 | 102,023 | 91,288 | 580,560 | 0.072 | 0.04 | 0.89 | 0.36 | 6 | 19 | 6.36 | 8.09 | 5.41 | https://analyzingalpha.com/bearish-harami-cross-candlestick-pattern |
| 13,288 | bearish_harami_cross | 2 | uptrend | bearish reversal | bullish continuation | stock | 3 | low-close | 4,784 | 99,649 | 89,109 | 775,212 | 0.135 | 0.07 | 0.89 | 0.29 | 6 | 25 | 8.70 | 13.22 | 6.90 | https://analyzingalpha.com/bearish-harami-cross-candlestick-pattern |
| 13,289 | bearish_harami_cross | 2 | uptrend | bearish reversal | bullish continuation | stock | 4 | low-close | 4,784 | 97,759 | 87,341 | 946,949 | 0.204 | 0.10 | 0.89 | 0.24 | 6 | 27 | 10.84 | 19.39 | 8.13 | https://analyzingalpha.com/bearish-harami-cross-candlestick-pattern |
| 13,290 | bearish_harami_cross | 2 | uptrend | bearish reversal | bullish continuation | stock | 5 | low-close | 4,784 | 96,045 | 85,752 | 1,108,792 | 0.260 | 0.13 | 0.89 | 0.21 | 5 | 32 | 12.93 | 26.57 | 9.31 | https://analyzingalpha.com/bearish-harami-cross-candlestick-pattern |
| Strategy | Market | Setup | Trades | Edge |
Pattern:
Pattern Bars:
Required Trend:
Traditional Strategy:
Strategy:
Market:
RR:
Setup:
Tickers:
Signals:
Trades:
Trade Bars:
Edge:
Edge Per Bar:
Confirm %:
Win %:
Cons Wins:
Cons Losses:
Avg. Trade Bars:
Avg. Win Bars:
Avg. Loss Bars:
Similar Candlestick Patterns
Many candlestick patterns have similar candlesticks to the bearish harami cross. It’s essential to understand the unique differences between these confusing patterns when using candlestick pattern technical analysis.
Bullish Harami Cross vs. Bearish Harami Cross
The bullish harami cross candlestick pattern is the opposite of its bearish sibling. The bullish harami pattern occurs in a downtrend, with its first candle being a large bearish red candle followed by a smaller engulfed doji candle.
Both are supposed to reverse the current trend, but history tells us it’s volatility that we should anticipate.
Bearish Harami vs. Bearish Harami Cross

The bearish harami candlestick pattern is nearly identical to the bearish harami cross with one difference: the second candle of the bearish harami doesn’t need to be a doji, whereas it’s a requirement of the harami cross.
The Bottom Line
The bearish harami cross occurs relatively frequently in all markets, and most traders misplay it. Using data, you can understand that the pattern most likely means that volatility is incoming and profit from that knowledge.
Thirsting for more? I ranked and reviewed the best Japanese candlestick patterns.