The morning star is a three-bar bullish reversal Japanese candlestick pattern that is best traded as intended in a 21-year backtest.
If you use Japanese candlestick charting techniques, you might be surprised to learn the data shows traditional morning star trading strategies only work in the crypto markets. You’ll lose money in the forex and stock markets.
But what if you could be on the right side of every trade by listening to history? Would you be interested?
Keep reading to learn what the data says about the best morning star trading strategies.
What Is a Morning Star Candlestick Pattern?
The morning doji star is a three-bar bullish reversal pattern that precedes near-term volatility and is best traded bullishly in all markets tested.
The name comes from the middle candle that appears like the morning star candlestick chart with some imagination.
Let’s learn how to identify this three-bar candlestick pattern, and then we’ll cover the best morning doji star trading strategies.
How to Identify the Morning Star Candlestick Pattern

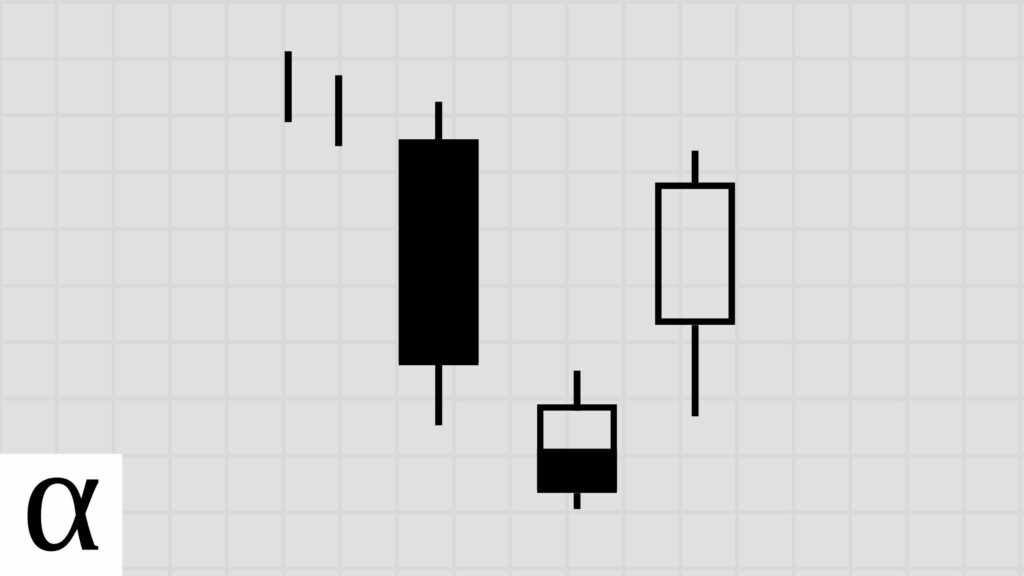
The following are the requirements for a valid morning star candlestick pattern:
- The first candle is bearish and long.
- The second candle has a short real body and gaps down.
- The third candle is bullish and moves well within the first candle’s body.
- The morning star must occur in a downtrend.
A morning star appeared on Apple’s (AAPL) daily chart on October 14th, 2021.
There’s a clear downtrend trend as prices move below the fifty-day simple moving average. The first day is bearish with a significant red candle, the second-day forms a gap down doji, and the third day is green and moves well past the first day’s real body, fulfilling the morning star pattern requirements.
Now that we can identify the morning star pattern, let’s learn how to trade this three-bar pattern on our candlestick charts.
How to Trade the Morning Star Pattern
The morning star should be traded using a bullish reversal strategy in the crypto and stock markets, and a bullish mean reversion in the forex markets, according to a 21-year backtest.
Before we discuss the best morning star candlestick trading strategy, let’s discuss how most traders are in the dark regarding this pattern.
Morning Star Bullish Reversal Trade Setup

The morning star’s last close is below the fifty-day moving average, which we consider a downward trend. There’s a sizable bearish red candle followed by a gap down into a short-bodied candle. The third day gives us a significant bullish green candle closing past the first day’s real body, fulfilling the morning star candlestick pattern requirements.
Traditional traders enter long at a price move above the third candle’s high and set their stop loss below the second candle’s low. History tells us that the traditional setup is optimal in the crypto markets, but stock traders should follow a different path.
A professional stock trader that uses data to optimize the risk-reward enters long on a break of the third candle’s close with a stop loss below the second candle’s low. This increases the potential reward and reduces the risk.
Intelligent forex trading requires a different approach.
Morning Doji Star Bullish Mean Reversion Trade Setup

Data-driven forex traders enter long after the price crosses below and back above the pattern’s low, setting a stop loss of one ATR.
Let’s use the Ethereum (ETHUSD) daily chart on July 12th, 2017, to verify our understanding.
We see a strong downtrend as the price moves away from the fifty-day simple. There’s a sizeable bearish candlestick followed by a candle gaping down with a small body. The third candle is a long bullish candle that moves well within the first bullish candle’s real body, completing the pattern.
The pattern’s low occurred on the second candle at $135.56. The price moves below this on the 17th, signaling traders to be ready for a long entry. The price moves back above the pattern low on the 17th, followed by a profitable, bullish move.
Speaking of profits, what can the historical data tell us about the best morning star trading strategies?
Does the Morning Star Candlestick Pattern Work? (Backtest Results)
I backtested the morning star pattern on the daily timeframe in the crypto, forex, and stock markets using the following rules:
- A close above the 50-day SMA constitutes an uptrend.
- I tested risk-reward ranges from 1 to 5.
- The optimal risk-reward ratio is selected using profit per bar.
- Entry and exits are discussed in the how-to trade section above.
- Confirmation must occur within three days of the pattern signal.
| Id | Pattern | Pattern Bars | Required Trend | Traditional Strategy | Market | Strategy | Setup | RR | Tickers | Signals | Trades | Trade Bars | Edge | Edge Per Bar | Confirm % | Win % | Cons Wins | Cons Losses | Avg. Trade Bars | Avg. Win Bars | Avg. Loss Bars | Details |
|---|---|---|---|---|---|---|---|---|---|---|---|---|---|---|---|---|---|---|---|---|---|---|
| 9,806 | morning_star | 3 | downtrend | bullish reversal | crypto | bearish continuation | high-low | 1 | 62 | 182 | 73 | 159 | -0.723 | -0.24 | 0.40 | 0.14 | 1 | 4 | 2.18 | 2.70 | 2.10 | https://analyzingalpha.com/morning-star-candlestick-pattern |
| 9,807 | morning_star | 3 | downtrend | bullish reversal | crypto | bearish continuation | high-low | 2 | 62 | 182 | 73 | 227 | -0.794 | -0.26 | 0.40 | 0.07 | 1 | 4 | 3.11 | 3.40 | 3.09 | https://analyzingalpha.com/morning-star-candlestick-pattern |
| 9,808 | morning_star | 3 | downtrend | bullish reversal | crypto | bearish continuation | high-low | 3 | 62 | 182 | 73 | 235 | -0.775 | -0.26 | 0.40 | 0.06 | 1 | 4 | 3.22 | 5.25 | 3.10 | https://analyzingalpha.com/morning-star-candlestick-pattern |
| 9,809 | morning_star | 3 | downtrend | bullish reversal | crypto | bearish continuation | high-low | 4 | 62 | 182 | 73 | 296 | -0.796 | -0.27 | 0.40 | 0.04 | 1 | 4 | 4.05 | 10.33 | 3.79 | https://analyzingalpha.com/morning-star-candlestick-pattern |
| 9,810 | morning_star | 3 | downtrend | bullish reversal | crypto | bearish continuation | high-low | 5 | 62 | 182 | 73 | 324 | -0.755 | -0.25 | 0.40 | 0.04 | 1 | 4 | 4.44 | 19.67 | 3.79 | https://analyzingalpha.com/morning-star-candlestick-pattern |
| 9,811 | morning_star | 3 | downtrend | bullish reversal | forex | bearish continuation | high-low | 1 | 506 | 2,170 | 620 | 1,438 | -0.698 | -0.23 | 0.29 | 0.15 | 2 | 6 | 2.32 | 4.96 | 1.85 | https://analyzingalpha.com/morning-star-candlestick-pattern |
| 9,812 | morning_star | 3 | downtrend | bullish reversal | forex | bearish continuation | high-low | 2 | 506 | 2,167 | 617 | 2,191 | -0.700 | -0.23 | 0.28 | 0.10 | 2 | 6 | 3.55 | 13.13 | 2.48 | https://analyzingalpha.com/morning-star-candlestick-pattern |
| 9,813 | morning_star | 3 | downtrend | bullish reversal | forex | bearish continuation | high-low | 3 | 506 | 2,165 | 616 | 4,574 | -0.695 | -0.23 | 0.28 | 0.08 | 2 | 6 | 7.43 | 17.28 | 6.63 | https://analyzingalpha.com/morning-star-candlestick-pattern |
| 9,814 | morning_star | 3 | downtrend | bullish reversal | forex | bearish continuation | high-low | 4 | 506 | 2,164 | 616 | 5,656 | -0.754 | -0.25 | 0.28 | 0.05 | 1 | 6 | 9.18 | 24.83 | 8.38 | https://analyzingalpha.com/morning-star-candlestick-pattern |
| 9,815 | morning_star | 3 | downtrend | bullish reversal | forex | bearish continuation | high-low | 5 | 506 | 2,164 | 616 | 6,047 | -0.780 | -0.26 | 0.28 | 0.04 | 1 | 6 | 9.82 | 32.27 | 8.98 | https://analyzingalpha.com/morning-star-candlestick-pattern |
| 9,816 | morning_star | 3 | downtrend | bullish reversal | stock | bearish continuation | high-low | 1 | 4,034 | 31,926 | 11,590 | 20,144 | -0.639 | -0.21 | 0.36 | 0.18 | 5 | 9 | 1.74 | 2.68 | 1.53 | https://analyzingalpha.com/morning-star-candlestick-pattern |
| 9,817 | morning_star | 3 | downtrend | bullish reversal | stock | bearish continuation | high-low | 2 | 4,034 | 31,897 | 11,581 | 27,402 | -0.608 | -0.20 | 0.36 | 0.13 | 5 | 10 | 2.37 | 5.22 | 1.94 | https://analyzingalpha.com/morning-star-candlestick-pattern |
| 9,818 | morning_star | 3 | downtrend | bullish reversal | stock | bearish continuation | high-low | 3 | 4,034 | 31,863 | 11,573 | 34,863 | -0.594 | -0.20 | 0.36 | 0.10 | 4 | 12 | 3.01 | 8.12 | 2.43 | https://analyzingalpha.com/morning-star-candlestick-pattern |
| 9,819 | morning_star | 3 | downtrend | bullish reversal | stock | bearish continuation | high-low | 4 | 4,034 | 31,830 | 11,564 | 43,589 | -0.588 | -0.20 | 0.36 | 0.08 | 4 | 12 | 3.77 | 11.43 | 3.08 | https://analyzingalpha.com/morning-star-candlestick-pattern |
| 9,820 | morning_star | 3 | downtrend | bullish reversal | stock | bearish continuation | high-low | 5 | 4,034 | 31,801 | 11,557 | 49,321 | -0.575 | -0.19 | 0.36 | 0.07 | 3 | 12 | 4.27 | 14.99 | 3.44 | https://analyzingalpha.com/morning-star-candlestick-pattern |
| 10,086 | morning_star | 3 | downtrend | bullish reversal | crypto | bearish mean reversion | atr-pattern_high | 1 | 62 | 182 | 72 | 267 | 0.000 | 0.00 | 0.40 | 0.50 | 3 | 2 | 3.71 | 4.14 | 3.28 | https://analyzingalpha.com/morning-star-candlestick-pattern |
| 10,087 | morning_star | 3 | downtrend | bullish reversal | crypto | bearish mean reversion | atr-pattern_high | 2 | 62 | 181 | 71 | 465 | -0.070 | -0.02 | 0.39 | 0.31 | 2 | 3 | 6.55 | 8.95 | 5.47 | https://analyzingalpha.com/morning-star-candlestick-pattern |
| 10,088 | morning_star | 3 | downtrend | bullish reversal | crypto | bearish mean reversion | atr-pattern_high | 3 | 62 | 181 | 71 | 680 | -0.209 | -0.07 | 0.39 | 0.20 | 1 | 3 | 9.58 | 20.29 | 6.95 | https://analyzingalpha.com/morning-star-candlestick-pattern |
| 10,089 | morning_star | 3 | downtrend | bullish reversal | crypto | bearish mean reversion | atr-pattern_high | 4 | 62 | 180 | 71 | 834 | -0.362 | -0.12 | 0.39 | 0.13 | 1 | 3 | 11.75 | 29.22 | 9.21 | https://analyzingalpha.com/morning-star-candlestick-pattern |
| 10,090 | morning_star | 3 | downtrend | bullish reversal | crypto | bearish mean reversion | atr-pattern_high | 5 | 62 | 180 | 70 | 932 | -0.480 | -0.16 | 0.39 | 0.09 | 1 | 3 | 13.31 | 32.33 | 11.53 | https://analyzingalpha.com/morning-star-candlestick-pattern |
| 10,091 | morning_star | 3 | downtrend | bullish reversal | forex | bearish mean reversion | atr-pattern_high | 1 | 506 | 2,167 | 1,043 | 4,851 | 0.240 | 0.08 | 0.48 | 0.62 | 6 | 3 | 4.65 | 4.10 | 5.55 | https://analyzingalpha.com/morning-star-candlestick-pattern |
| 10,092 | morning_star | 3 | downtrend | bullish reversal | forex | bearish mean reversion | atr-pattern_high | 2 | 506 | 2,146 | 1,035 | 10,198 | 0.250 | 0.08 | 0.48 | 0.42 | 5 | 5 | 9.85 | 11.24 | 8.86 | https://analyzingalpha.com/morning-star-candlestick-pattern |
| 10,093 | morning_star | 3 | downtrend | bullish reversal | forex | bearish mean reversion | atr-pattern_high | 3 | 506 | 2,135 | 1,028 | 15,629 | 0.185 | 0.06 | 0.48 | 0.30 | 5 | 5 | 15.20 | 21.44 | 12.60 | https://analyzingalpha.com/morning-star-candlestick-pattern |
| 10,094 | morning_star | 3 | downtrend | bullish reversal | forex | bearish mean reversion | atr-pattern_high | 4 | 506 | 2,123 | 1,019 | 20,415 | 0.200 | 0.07 | 0.48 | 0.24 | 5 | 5 | 20.03 | 35.55 | 15.12 | https://analyzingalpha.com/morning-star-candlestick-pattern |
| 10,095 | morning_star | 3 | downtrend | bullish reversal | forex | bearish mean reversion | atr-pattern_high | 5 | 506 | 2,120 | 1,017 | 26,945 | 0.120 | 0.04 | 0.48 | 0.19 | 5 | 6 | 26.49 | 56.78 | 19.58 | https://analyzingalpha.com/morning-star-candlestick-pattern |
| 10,096 | morning_star | 3 | downtrend | bullish reversal | stock | bearish mean reversion | atr-pattern_high | 1 | 4,034 | 31,819 | 17,216 | 73,570 | 0.125 | 0.04 | 0.54 | 0.57 | 11 | 8 | 4.27 | 3.94 | 4.71 | https://analyzingalpha.com/morning-star-candlestick-pattern |
| 10,097 | morning_star | 3 | downtrend | bullish reversal | stock | bearish mean reversion | atr-pattern_high | 2 | 4,034 | 31,534 | 17,022 | 147,077 | 0.088 | 0.03 | 0.54 | 0.36 | 8 | 11 | 8.64 | 10.31 | 7.69 | https://analyzingalpha.com/morning-star-candlestick-pattern |
| 10,098 | morning_star | 3 | downtrend | bullish reversal | stock | bearish mean reversion | atr-pattern_high | 3 | 4,034 | 31,257 | 16,835 | 218,604 | 0.074 | 0.02 | 0.54 | 0.27 | 7 | 13 | 12.99 | 18.42 | 10.99 | https://analyzingalpha.com/morning-star-candlestick-pattern |
| 10,099 | morning_star | 3 | downtrend | bullish reversal | stock | bearish mean reversion | atr-pattern_high | 4 | 4,034 | 30,979 | 16,655 | 300,468 | 0.042 | 0.01 | 0.54 | 0.21 | 7 | 13 | 18.04 | 30.10 | 14.88 | https://analyzingalpha.com/morning-star-candlestick-pattern |
| 10,100 | morning_star | 3 | downtrend | bullish reversal | stock | bearish mean reversion | atr-pattern_high | 5 | 4,034 | 30,665 | 16,435 | 378,527 | 0.010 | 0.00 | 0.54 | 0.17 | 7 | 13 | 23.03 | 47.56 | 18.07 | https://analyzingalpha.com/morning-star-candlestick-pattern |
| 11,516 | morning_star | 3 | downtrend | bullish reversal | crypto | bullish reversal | low-close | 1 | 62 | 181 | 172 | 908 | -0.043 | -0.01 | 0.95 | 0.48 | 4 | 4 | 5.28 | 5.34 | 5.22 | https://analyzingalpha.com/morning-star-candlestick-pattern |
| 11,517 | morning_star | 3 | downtrend | bullish reversal | crypto | bullish reversal | low-close | 2 | 62 | 181 | 171 | 1,392 | 0.074 | 0.02 | 0.94 | 0.36 | 3 | 4 | 8.14 | 10.54 | 6.81 | https://analyzingalpha.com/morning-star-candlestick-pattern |
| 11,518 | morning_star | 3 | downtrend | bullish reversal | crypto | bullish reversal | low-close | 3 | 62 | 179 | 169 | 1,817 | 0.160 | 0.05 | 0.94 | 0.29 | 2 | 6 | 10.75 | 15.29 | 8.90 | https://analyzingalpha.com/morning-star-candlestick-pattern |
| 11,519 | morning_star | 3 | downtrend | bullish reversal | crypto | bullish reversal | low-close | 4 | 62 | 179 | 168 | 2,077 | 0.308 | 0.10 | 0.94 | 0.26 | 2 | 6 | 12.36 | 19.66 | 9.77 | https://analyzingalpha.com/morning-star-candlestick-pattern |
| 11,520 | morning_star | 3 | downtrend | bullish reversal | crypto | bullish reversal | low-close | 5 | 62 | 179 | 167 | 2,200 | 0.400 | 0.13 | 0.93 | 0.23 | 2 | 6 | 13.17 | 23.08 | 10.16 | https://analyzingalpha.com/morning-star-candlestick-pattern |
| 11,521 | morning_star | 3 | downtrend | bullish reversal | forex | bullish reversal | low-close | 1 | 506 | 2,160 | 2,089 | 13,359 | -0.097 | -0.03 | 0.97 | 0.45 | 6 | 8 | 6.39 | 6.33 | 6.45 | https://analyzingalpha.com/morning-star-candlestick-pattern |
| 11,522 | morning_star | 3 | downtrend | bullish reversal | forex | bullish reversal | low-close | 2 | 506 | 2,149 | 2,071 | 23,941 | -0.136 | -0.05 | 0.96 | 0.29 | 4 | 9 | 11.56 | 16.55 | 9.55 | https://analyzingalpha.com/morning-star-candlestick-pattern |
| 11,523 | morning_star | 3 | downtrend | bullish reversal | forex | bullish reversal | low-close | 3 | 506 | 2,144 | 2,062 | 35,197 | -0.151 | -0.05 | 0.96 | 0.21 | 3 | 9 | 17.07 | 31.51 | 13.16 | https://analyzingalpha.com/morning-star-candlestick-pattern |
| 11,524 | morning_star | 3 | downtrend | bullish reversal | forex | bullish reversal | low-close | 4 | 506 | 2,141 | 2,053 | 44,059 | -0.154 | -0.05 | 0.96 | 0.17 | 3 | 10 | 21.46 | 47.69 | 16.13 | https://analyzingalpha.com/morning-star-candlestick-pattern |
| 11,525 | morning_star | 3 | downtrend | bullish reversal | forex | bullish reversal | low-close | 5 | 506 | 2,131 | 2,038 | 53,244 | -0.170 | -0.06 | 0.96 | 0.14 | 3 | 10 | 26.13 | 75.09 | 18.29 | https://analyzingalpha.com/morning-star-candlestick-pattern |
| 11,526 | morning_star | 3 | downtrend | bullish reversal | stock | bullish reversal | low-close | 1 | 4,034 | 31,596 | 28,290 | 205,935 | 0.075 | 0.03 | 0.90 | 0.54 | 11 | 11 | 7.28 | 7.26 | 7.30 | https://analyzingalpha.com/morning-star-candlestick-pattern |
| 11,527 | morning_star | 3 | downtrend | bullish reversal | stock | bullish reversal | low-close | 2 | 4,034 | 31,292 | 27,967 | 377,994 | 0.168 | 0.06 | 0.89 | 0.39 | 10 | 14 | 13.52 | 17.64 | 10.89 | https://analyzingalpha.com/morning-star-candlestick-pattern |
| 11,528 | morning_star | 3 | downtrend | bullish reversal | stock | bullish reversal | low-close | 3 | 4,034 | 31,035 | 27,692 | 549,399 | 0.243 | 0.08 | 0.89 | 0.31 | 8 | 15 | 19.84 | 31.22 | 14.72 | https://analyzingalpha.com/morning-star-candlestick-pattern |
| 11,529 | morning_star | 3 | downtrend | bullish reversal | stock | bullish reversal | low-close | 4 | 4,034 | 30,780 | 27,417 | 704,974 | 0.308 | 0.10 | 0.89 | 0.26 | 6 | 15 | 25.71 | 46.73 | 18.27 | https://analyzingalpha.com/morning-star-candlestick-pattern |
| 11,530 | morning_star | 3 | downtrend | bullish reversal | stock | bullish reversal | low-close | 5 | 4,034 | 30,525 | 27,133 | 847,077 | 0.365 | 0.12 | 0.89 | 0.23 | 5 | 17 | 31.22 | 65.16 | 21.25 | https://analyzingalpha.com/morning-star-candlestick-pattern |
| 13,006 | morning_star | 3 | downtrend | bullish reversal | crypto | bullish reversal | low-high | 1 | 62 | 182 | 124 | 811 | -0.036 | -0.01 | 0.68 | 0.48 | 3 | 3 | 6.54 | 5.83 | 7.20 | https://analyzingalpha.com/morning-star-candlestick-pattern |
| 13,007 | morning_star | 3 | downtrend | bullish reversal | crypto | bullish reversal | low-high | 2 | 62 | 181 | 122 | 1,184 | 0.054 | 0.02 | 0.67 | 0.35 | 3 | 5 | 9.70 | 11.79 | 8.57 | https://analyzingalpha.com/morning-star-candlestick-pattern |
| 13,008 | morning_star | 3 | downtrend | bullish reversal | crypto | bullish reversal | low-high | 3 | 62 | 180 | 122 | 1,544 | 0.151 | 0.05 | 0.68 | 0.29 | 3 | 5 | 12.66 | 17.51 | 10.70 | https://analyzingalpha.com/morning-star-candlestick-pattern |
| 13,009 | morning_star | 3 | downtrend | bullish reversal | crypto | bullish reversal | low-high | 4 | 62 | 180 | 121 | 1,744 | 0.284 | 0.09 | 0.67 | 0.26 | 3 | 5 | 14.41 | 23.45 | 11.30 | https://analyzingalpha.com/morning-star-candlestick-pattern |
| 13,010 | morning_star | 3 | downtrend | bullish reversal | crypto | bullish reversal | low-high | 5 | 62 | 180 | 120 | 1,716 | 0.450 | 0.15 | 0.67 | 0.24 | 3 | 5 | 14.30 | 22.97 | 11.54 | https://analyzingalpha.com/morning-star-candlestick-pattern |
| 13,011 | morning_star | 3 | downtrend | bullish reversal | forex | bullish reversal | low-high | 1 | 506 | 2,152 | 1,544 | 13,058 | -0.137 | -0.05 | 0.72 | 0.43 | 6 | 6 | 8.46 | 9.32 | 7.80 | https://analyzingalpha.com/morning-star-candlestick-pattern |
| 13,012 | morning_star | 3 | downtrend | bullish reversal | forex | bullish reversal | low-high | 2 | 506 | 2,144 | 1,527 | 24,984 | -0.184 | -0.06 | 0.71 | 0.27 | 4 | 7 | 16.36 | 25.00 | 13.12 | https://analyzingalpha.com/morning-star-candlestick-pattern |
| 13,013 | morning_star | 3 | downtrend | bullish reversal | forex | bullish reversal | low-high | 3 | 506 | 2,138 | 1,518 | 35,791 | -0.188 | -0.06 | 0.71 | 0.20 | 3 | 7 | 23.58 | 46.32 | 17.77 | https://analyzingalpha.com/morning-star-candlestick-pattern |
| 13,014 | morning_star | 3 | downtrend | bullish reversal | forex | bullish reversal | low-high | 4 | 506 | 2,131 | 1,503 | 44,036 | -0.200 | -0.07 | 0.71 | 0.16 | 3 | 9 | 29.30 | 71.68 | 21.21 | https://analyzingalpha.com/morning-star-candlestick-pattern |
| 13,015 | morning_star | 3 | downtrend | bullish reversal | forex | bullish reversal | low-high | 5 | 506 | 2,125 | 1,493 | 50,557 | -0.155 | -0.05 | 0.70 | 0.14 | 2 | 9 | 33.86 | 98.38 | 23.24 | https://analyzingalpha.com/morning-star-candlestick-pattern |
| 13,016 | morning_star | 3 | downtrend | bullish reversal | stock | bullish reversal | low-high | 1 | 4,034 | 31,552 | 24,873 | 209,773 | 0.060 | 0.02 | 0.79 | 0.53 | 10 | 11 | 8.43 | 8.51 | 8.34 | https://analyzingalpha.com/morning-star-candlestick-pattern |
| 13,017 | morning_star | 3 | downtrend | bullish reversal | stock | bullish reversal | low-high | 2 | 4,034 | 31,261 | 24,586 | 392,357 | 0.150 | 0.05 | 0.79 | 0.39 | 9 | 13 | 15.96 | 21.09 | 12.74 | https://analyzingalpha.com/morning-star-candlestick-pattern |
| 13,018 | morning_star | 3 | downtrend | bullish reversal | stock | bullish reversal | low-high | 3 | 4,034 | 30,990 | 24,328 | 567,718 | 0.231 | 0.08 | 0.79 | 0.31 | 6 | 14 | 23.34 | 37.10 | 17.23 | https://analyzingalpha.com/morning-star-candlestick-pattern |
| 13,019 | morning_star | 3 | downtrend | bullish reversal | stock | bullish reversal | low-high | 4 | 4,034 | 30,732 | 24,064 | 725,280 | 0.300 | 0.10 | 0.78 | 0.26 | 4 | 14 | 30.14 | 55.45 | 21.23 | https://analyzingalpha.com/morning-star-candlestick-pattern |
| 13,020 | morning_star | 3 | downtrend | bullish reversal | stock | bullish reversal | low-high | 5 | 4,034 | 30,451 | 23,783 | 876,353 | 0.360 | 0.12 | 0.78 | 0.23 | 5 | 14 | 36.85 | 77.99 | 24.82 | https://analyzingalpha.com/morning-star-candlestick-pattern |
| 13,216 | morning_star | 3 | downtrend | bullish reversal | crypto | bullish mean reversion | atr-pattern_low | 1 | 62 | 181 | 41 | 272 | 0.264 | 0.09 | 0.23 | 0.63 | 2 | 2 | 6.63 | 7.42 | 5.27 | https://analyzingalpha.com/morning-star-candlestick-pattern |
| 13,217 | morning_star | 3 | downtrend | bullish reversal | crypto | bullish mean reversion | atr-pattern_low | 2 | 62 | 181 | 33 | 313 | -0.094 | -0.03 | 0.18 | 0.30 | 1 | 2 | 9.48 | 9.60 | 9.43 | https://analyzingalpha.com/morning-star-candlestick-pattern |
| 13,218 | morning_star | 3 | downtrend | bullish reversal | crypto | bullish mean reversion | atr-pattern_low | 3 | 62 | 180 | 33 | 520 | -0.034 | -0.01 | 0.18 | 0.24 | 1 | 2 | 15.76 | 18.50 | 14.88 | https://analyzingalpha.com/morning-star-candlestick-pattern |
| 13,219 | morning_star | 3 | downtrend | bullish reversal | crypto | bullish mean reversion | atr-pattern_low | 4 | 62 | 180 | 33 | 549 | 0.058 | 0.02 | 0.18 | 0.21 | 1 | 2 | 16.64 | 21.29 | 15.38 | https://analyzingalpha.com/morning-star-candlestick-pattern |
| 13,220 | morning_star | 3 | downtrend | bullish reversal | crypto | bullish mean reversion | atr-pattern_low | 5 | 62 | 180 | 33 | 564 | 0.270 | 0.09 | 0.18 | 0.21 | 1 | 2 | 17.09 | 23.43 | 15.38 | https://analyzingalpha.com/morning-star-candlestick-pattern |
| 13,221 | morning_star | 3 | downtrend | bullish reversal | forex | bullish mean reversion | atr-pattern_low | 1 | 506 | 2,169 | 397 | 1,433 | 0.277 | 0.09 | 0.18 | 0.64 | 4 | 3 | 3.61 | 3.51 | 3.79 | https://analyzingalpha.com/morning-star-candlestick-pattern |
| 13,222 | morning_star | 3 | downtrend | bullish reversal | forex | bullish mean reversion | atr-pattern_low | 2 | 506 | 2,163 | 394 | 3,790 | 0.262 | 0.09 | 0.18 | 0.42 | 3 | 3 | 9.62 | 12.17 | 7.76 | https://analyzingalpha.com/morning-star-candlestick-pattern |
| 13,223 | morning_star | 3 | downtrend | bullish reversal | forex | bullish mean reversion | atr-pattern_low | 3 | 506 | 2,160 | 394 | 6,903 | 0.117 | 0.04 | 0.18 | 0.28 | 2 | 3 | 17.52 | 27.82 | 13.53 | https://analyzingalpha.com/morning-star-candlestick-pattern |
| 13,224 | morning_star | 3 | downtrend | bullish reversal | forex | bullish mean reversion | atr-pattern_low | 4 | 506 | 2,157 | 393 | 8,970 | 0.054 | 0.02 | 0.18 | 0.21 | 2 | 3 | 22.82 | 36.70 | 19.11 | https://analyzingalpha.com/morning-star-candlestick-pattern |
| 13,225 | morning_star | 3 | downtrend | bullish reversal | forex | bullish mean reversion | atr-pattern_low | 5 | 506 | 2,156 | 392 | 11,130 | 0.145 | 0.05 | 0.18 | 0.19 | 2 | 4 | 28.39 | 59.01 | 21.15 | https://analyzingalpha.com/morning-star-candlestick-pattern |
| 13,226 | morning_star | 3 | downtrend | bullish reversal | stock | bullish mean reversion | atr-pattern_low | 1 | 4,034 | 31,846 | 6,351 | 23,235 | 0.184 | 0.06 | 0.20 | 0.59 | 7 | 5 | 3.66 | 3.46 | 3.94 | https://analyzingalpha.com/morning-star-candlestick-pattern |
| 13,227 | morning_star | 3 | downtrend | bullish reversal | stock | bullish mean reversion | atr-pattern_low | 2 | 4,034 | 31,720 | 6,309 | 45,828 | 0.232 | 0.08 | 0.20 | 0.41 | 5 | 6 | 7.26 | 8.59 | 6.34 | https://analyzingalpha.com/morning-star-candlestick-pattern |
| 13,228 | morning_star | 3 | downtrend | bullish reversal | stock | bullish mean reversion | atr-pattern_low | 3 | 4,034 | 31,667 | 6,287 | 69,568 | 0.308 | 0.10 | 0.20 | 0.33 | 5 | 6 | 11.07 | 16.69 | 8.35 | https://analyzingalpha.com/morning-star-candlestick-pattern |
| 13,229 | morning_star | 3 | downtrend | bullish reversal | stock | bullish mean reversion | atr-pattern_low | 4 | 4,034 | 31,624 | 6,267 | 94,107 | 0.312 | 0.10 | 0.20 | 0.26 | 4 | 8 | 15.02 | 26.63 | 10.87 | https://analyzingalpha.com/morning-star-candlestick-pattern |
| 13,230 | morning_star | 3 | downtrend | bullish reversal | stock | bullish mean reversion | atr-pattern_low | 5 | 4,034 | 31,592 | 6,249 | 118,102 | 0.340 | 0.11 | 0.20 | 0.22 | 4 | 8 | 18.90 | 39.33 | 12.99 | https://analyzingalpha.com/morning-star-candlestick-pattern |
| 13,381 | morning_star | 3 | downtrend | bullish reversal | crypto | bearish continuation | high-close | 1 | 62 | 182 | 182 | 187 | -0.880 | -0.29 | 1.00 | 0.06 | 2 | 6 | 1.03 | 1.45 | 1.00 | https://analyzingalpha.com/morning-star-candlestick-pattern |
| 13,382 | morning_star | 3 | downtrend | bullish reversal | crypto | bearish continuation | high-close | 2 | 62 | 182 | 182 | 197 | -0.830 | -0.28 | 1.00 | 0.06 | 2 | 6 | 1.08 | 2.30 | 1.01 | https://analyzingalpha.com/morning-star-candlestick-pattern |
| 13,383 | morning_star | 3 | downtrend | bullish reversal | crypto | bearish continuation | high-close | 3 | 62 | 182 | 182 | 235 | -0.828 | -0.28 | 1.00 | 0.04 | 2 | 6 | 1.29 | 5.38 | 1.10 | https://analyzingalpha.com/morning-star-candlestick-pattern |
| 13,384 | morning_star | 3 | downtrend | bullish reversal | crypto | bearish continuation | high-close | 4 | 62 | 182 | 182 | 235 | -0.784 | -0.26 | 1.00 | 0.04 | 2 | 6 | 1.29 | 5.38 | 1.10 | https://analyzingalpha.com/morning-star-candlestick-pattern |
| 13,385 | morning_star | 3 | downtrend | bullish reversal | crypto | bearish continuation | high-close | 5 | 62 | 182 | 182 | 268 | -0.805 | -0.27 | 1.00 | 0.03 | 2 | 6 | 1.47 | 7.33 | 1.27 | https://analyzingalpha.com/morning-star-candlestick-pattern |
| 13,386 | morning_star | 3 | downtrend | bullish reversal | forex | bearish continuation | high-close | 1 | 506 | 2,172 | 2,154 | 2,294 | -0.838 | -0.28 | 0.99 | 0.08 | 3 | 14 | 1.06 | 1.44 | 1.03 | https://analyzingalpha.com/morning-star-candlestick-pattern |
| 13,387 | morning_star | 3 | downtrend | bullish reversal | forex | bearish continuation | high-close | 2 | 506 | 2,172 | 2,154 | 2,593 | -0.798 | -0.27 | 0.99 | 0.07 | 3 | 14 | 1.20 | 2.75 | 1.09 | https://analyzingalpha.com/morning-star-candlestick-pattern |
| 13,388 | morning_star | 3 | downtrend | bullish reversal | forex | bearish continuation | high-close | 3 | 506 | 2,171 | 2,153 | 3,050 | -0.769 | -0.26 | 0.99 | 0.06 | 3 | 14 | 1.42 | 5.42 | 1.18 | https://analyzingalpha.com/morning-star-candlestick-pattern |
| 13,389 | morning_star | 3 | downtrend | bullish reversal | forex | bearish continuation | high-close | 4 | 506 | 2,171 | 2,153 | 3,303 | -0.750 | -0.25 | 0.99 | 0.05 | 2 | 14 | 1.53 | 6.38 | 1.28 | https://analyzingalpha.com/morning-star-candlestick-pattern |
| 13,390 | morning_star | 3 | downtrend | bullish reversal | forex | bearish continuation | high-close | 5 | 506 | 2,171 | 2,153 | 4,788 | -0.740 | -0.25 | 0.99 | 0.04 | 2 | 14 | 2.22 | 4.60 | 2.11 | https://analyzingalpha.com/morning-star-candlestick-pattern |
| 13,391 | morning_star | 3 | downtrend | bullish reversal | stock | bearish continuation | high-close | 1 | 4,034 | 31,989 | 29,255 | 31,616 | -0.883 | -0.29 | 0.91 | 0.06 | 4 | 24 | 1.08 | 1.50 | 1.06 | https://analyzingalpha.com/morning-star-candlestick-pattern |
| 13,392 | morning_star | 3 | downtrend | bullish reversal | stock | bearish continuation | high-close | 2 | 4,034 | 31,980 | 29,247 | 33,183 | -0.850 | -0.28 | 0.91 | 0.05 | 4 | 24 | 1.13 | 2.10 | 1.08 | https://analyzingalpha.com/morning-star-candlestick-pattern |
| 13,393 | morning_star | 3 | downtrend | bullish reversal | stock | bearish continuation | high-close | 3 | 4,034 | 31,970 | 29,237 | 35,370 | -0.831 | -0.28 | 0.91 | 0.04 | 4 | 24 | 1.21 | 2.75 | 1.14 | https://analyzingalpha.com/morning-star-candlestick-pattern |
| 13,394 | morning_star | 3 | downtrend | bullish reversal | stock | bearish continuation | high-close | 4 | 4,034 | 31,962 | 29,228 | 36,963 | -0.804 | -0.27 | 0.91 | 0.04 | 4 | 24 | 1.26 | 3.28 | 1.18 | https://analyzingalpha.com/morning-star-candlestick-pattern |
| 13,395 | morning_star | 3 | downtrend | bullish reversal | stock | bearish continuation | high-close | 5 | 4,034 | 31,955 | 29,221 | 39,058 | -0.785 | -0.26 | 0.91 | 0.04 | 4 | 24 | 1.34 | 4.23 | 1.23 | https://analyzingalpha.com/morning-star-candlestick-pattern |
| Market | Strategy | Setup | Trades | Edge |
Pattern:
Pattern Bars:
Required Trend:
Traditional Strategy:
Market:
Strategy:
Setup:
RR:
Tickers:
Signals:
Trades:
Trade Bars:
Edge:
Edge Per Bar:
Confirm %:
Win %:
Cons Wins:
Cons Losses:
Avg. Trade Bars:
Avg. Win Bars:
Avg. Loss Bars:
Similar Candlestick Patterns
Technical analysts confuse the morning star with other candle patterns. Identifying each pattern correctly when practicing candlestick pattern technical analysis is vital.
Evening Star vs. Morning Star

The evening star candlestick pattern is the opposite of its coffee-drinking sibling. The evening star is a bearish reversal instead of a bullish reversal. Its first candle is bullish instead of bearish—the second gaps up instead of down. The final candle is bullish and moves well with the first candle’s real body instead of doing the same thing in reverse.
Traders consider these patterns to be reversals, but history tells us otherwise.
Morning Doji Star vs. Morning Star
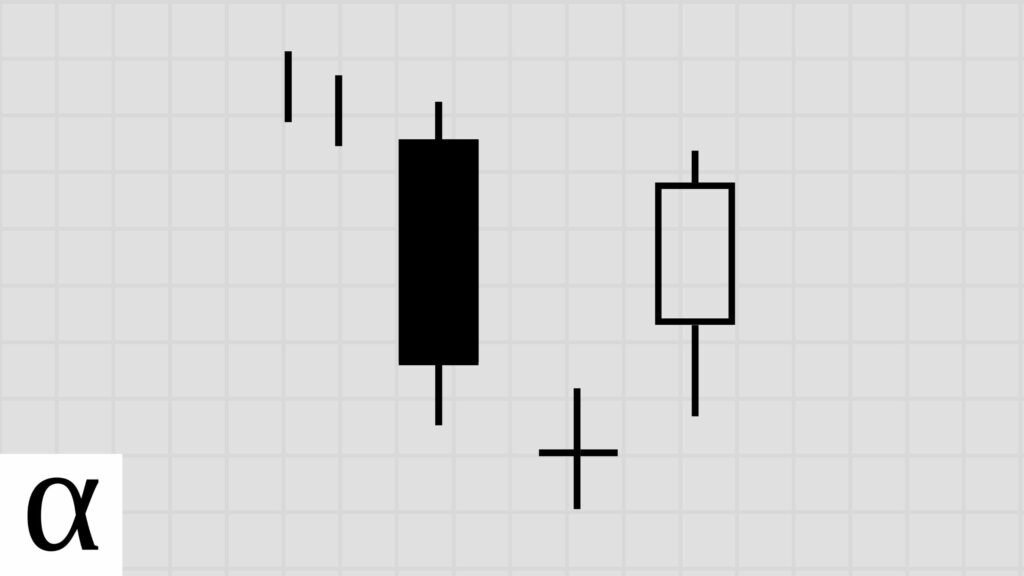
The morning doji star candlestick pattern is a two-bar bullish reversal pattern that differs from the morning doji star in one aspect: its second candle is a doji instead of a short candle.
The patterns are nearly identical with similar optimal trading strategies.
The Bottom Line
The morning star candlestick pattern is a three-candle bullish reversal pattern that historically leads to short-term volatility. The data tells us the best way to profit from this volatility using various bullish strategies.
Want to get better at candlestick trading? The data is the ultimate guide to Japanese candlestick chart patterns.