The evening star is a three-bar bearish reversal Japanese candlestick pattern that is best traded using mean reversion strategies in all markets backtested over decades.
If you’re a candlestick technical analyst, you might be surprised to learn that the evening star candlestick pattern is not a bearish reversal pattern according to history. The data shows that this pattern will likely lead to volatility and not bearish price action.
Keep reading to learn what twenty-one years of data say about the best evening star trading strategy.
What Is an Evening Star Candlestick Pattern?

The evening star is a three-bar bearish reversal candlestick pattern that is best traded using a bullish mean reversion strategy in the stock and crypto markets and a bearish mean reversion strategy in the forex markets.
The name comes from the short middle candle that gaps above the last candle and portends future dark bearish action.
The name might sound scary to those afraid of the dark, but I’m going to use data to shine a light on this pattern and how to trade it optimally. But first, let’s learn how to identify this three-bar pattern on our candlestick charts.
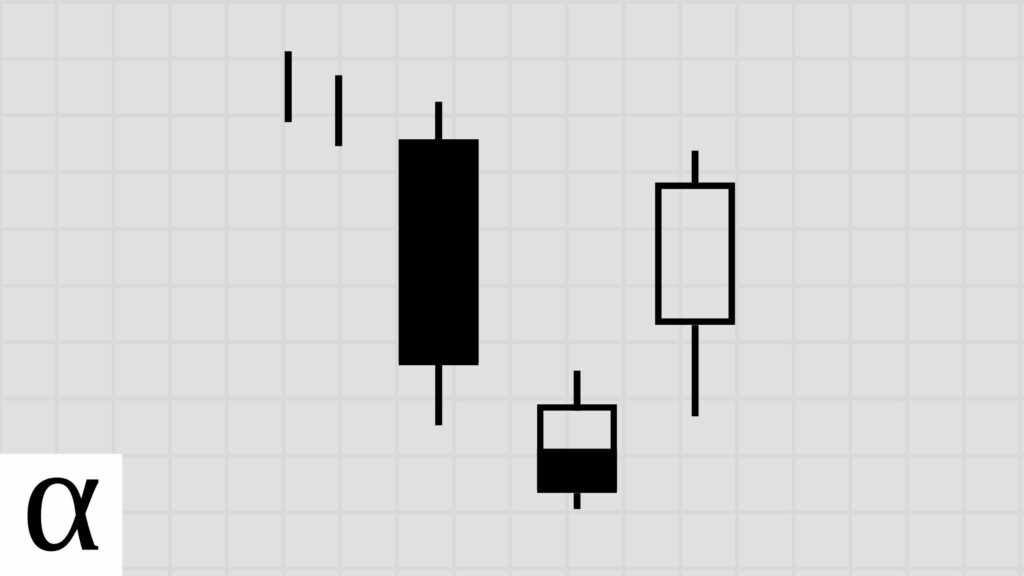
How to Identify the Evening Star Candlestick Pattern

The following are the requirements for a valid evening star candlestick pattern:
- The first candle must be bullish and long.
- The second candle is a short real-bodied candle that gaps up.
- The third candle must be bearish and move well within the first candle’s real body.
- The evening star must occur in an uptrend.
We see the evening star candlestick pattern on the Tesla (TSLA) November 23rd, 2021, daily chart.
There is an existing upward trend as the price is above the fifty-day simple moving average. The first day is a large bullish candle, the second day gaps up and forms a short-bodied candle, and the third day moves bearishly well within the first candle’s real body, fulfilling the even star pattern requirements.
Now that we understand how to identify the evening star pattern, let’s learn how to trade this three-bar pattern on our candlestick charts.
How to Trade the Evening Star Pattern
The evening star should be traded using a bullish mean reversion strategy in the stock and crypto markets and a bearish mean reversion strategy in the forex market, according to our 21-year backtest.
Before we discuss the optimal star candlestick trading strategy, let’s discuss how most traders lose money trading this pattern.
Evening Star Bearish Reversal Trade Setup

The price is above the fifty-day moving average, which we consider a short-term uptrend. There’s a large bullish green candle followed by a short-bodied candle. The third day gives us a significant bearish candle closing within the first day’s real body, fulfilling the evening star candlestick pattern requirements.
Any trader going bear on the Google (GOOG) October 20th, 2021 daily chart profited nicely due to luck. Data-driven traders understand that the best way to profit from the evening star is to capitalize on this pattern’s volatility.
Evening Star Bullish Mean Reversion Trade Setup

Data-driven stock market traders will enter long after the price crosses below and then back above the pattern’s low, setting a stop loss of one ATR.
Let’s use the Ethereum (ETHUSD) January 21st, 2021, daily chart to decrypt this.
We see upward momentum as the price is above the fifty-day simple. We see a large bullish candle followed by a small-bodied gap up. The third day prints a long bearish candle whose real body crosses well within and past the first candle’s real body. The Ethereum’s pattern low occurs on January 21st at $1,081. The price passes below and back above the low the next day, triggering an entry.
This professional crypto trader stacked satoshis and took profits a few days later. But forex traders should look in the opposite direction.
Evening Star Bearish Mean Reversion Trade Setup

Data-driven forex traders wait for the price to cross above the pattern high and enter short when the price crosses down below that high, setting a stop loss of one ATR.
Let’s use the Euro (EURUSD) chart on June 5th, 2019, in this example.
The pattern high is set on the third candle at $1.13068. The price crosses above and back below this price the next day, triggering an entry and taking profit using a 1:1 risk-reward ratio.
With this trader’s euros climbing, what can history tell us about the best evening star candlestick trading strategies?
Does the Evening Star Candlestick Pattern Work? (Backtest Results)
Using the following rules, I backtested the evening star pattern on the daily timeframe in the crypto, forex, and stock markets.
- A close above the 50-day SMA constitutes an uptrend.
- I tested risk-reward ranges from 1 to 5.
- The optimal risk-reward ratio is selected using profit per bar.
- Entry and exits are discussed in the how-to trade section above.
- Confirmation must occur within three days of the pattern signal.
| Id | Pattern | Pattern Bars | Required Trend | Traditional Strategy | Market | Strategy | Setup | RR | Tickers | Signals | Trades | Trade Bars | Edge | Edge Per Bar | Confirm % | Win % | Cons Wins | Cons Losses | Avg. Trade Bars | Avg. Win Bars | Avg. Loss Bars | Details |
|---|---|---|---|---|---|---|---|---|---|---|---|---|---|---|---|---|---|---|---|---|---|---|
| 8,321 | evening_star | 3 | uptrend | bearish reversal | crypto | bearish mean reversion | atr-pattern_high | 1 | 68 | 193 | 45 | 142 | -0.063 | -0.02 | 0.23 | 0.47 | 2 | 2 | 3.16 | 3.57 | 2.79 | https://analyzingalpha.com/evening-star-candlestick-pattern |
| 8,322 | evening_star | 3 | uptrend | bearish reversal | crypto | bearish mean reversion | atr-pattern_high | 2 | 68 | 192 | 45 | 286 | -0.196 | -0.07 | 0.23 | 0.27 | 1 | 3 | 6.36 | 11.92 | 4.33 | https://analyzingalpha.com/evening-star-candlestick-pattern |
| 8,323 | evening_star | 3 | uptrend | bearish reversal | crypto | bearish mean reversion | atr-pattern_high | 3 | 68 | 192 | 45 | 483 | -0.372 | -0.12 | 0.23 | 0.16 | 1 | 3 | 10.73 | 6.86 | 11.45 | https://analyzingalpha.com/evening-star-candlestick-pattern |
| 8,324 | evening_star | 3 | uptrend | bearish reversal | crypto | bearish mean reversion | atr-pattern_high | 4 | 68 | 192 | 45 | 510 | -0.446 | -0.15 | 0.23 | 0.11 | 1 | 3 | 11.33 | 7.60 | 11.80 | https://analyzingalpha.com/evening-star-candlestick-pattern |
| 8,325 | evening_star | 3 | uptrend | bearish reversal | crypto | bearish mean reversion | atr-pattern_high | 5 | 68 | 192 | 44 | 545 | -0.735 | -0.25 | 0.23 | 0.05 | 1 | 3 | 12.39 | 18.00 | 12.12 | https://analyzingalpha.com/evening-star-candlestick-pattern |
| 8,326 | evening_star | 3 | uptrend | bearish reversal | forex | bearish mean reversion | atr-pattern_high | 1 | 544 | 2,771 | 435 | 1,743 | 0.279 | 0.09 | 0.16 | 0.64 | 4 | 3 | 4.01 | 3.68 | 4.59 | https://analyzingalpha.com/evening-star-candlestick-pattern |
| 8,327 | evening_star | 3 | uptrend | bearish reversal | forex | bearish mean reversion | atr-pattern_high | 2 | 544 | 2,766 | 431 | 3,720 | 0.402 | 0.13 | 0.16 | 0.47 | 4 | 3 | 8.63 | 10.72 | 6.81 | https://analyzingalpha.com/evening-star-candlestick-pattern |
| 8,328 | evening_star | 3 | uptrend | bearish reversal | forex | bearish mean reversion | atr-pattern_high | 3 | 544 | 2,758 | 430 | 6,597 | 0.372 | 0.12 | 0.16 | 0.34 | 3 | 4 | 15.34 | 23.14 | 11.25 | https://analyzingalpha.com/evening-star-candlestick-pattern |
| 8,329 | evening_star | 3 | uptrend | bearish reversal | forex | bearish mean reversion | atr-pattern_high | 4 | 544 | 2,752 | 428 | 9,061 | 0.288 | 0.10 | 0.16 | 0.26 | 3 | 4 | 21.17 | 35.47 | 16.22 | https://analyzingalpha.com/evening-star-candlestick-pattern |
| 8,330 | evening_star | 3 | uptrend | bearish reversal | forex | bearish mean reversion | atr-pattern_high | 5 | 544 | 2,750 | 425 | 11,506 | 0.155 | 0.05 | 0.15 | 0.19 | 2 | 6 | 27.07 | 52.18 | 21.07 | https://analyzingalpha.com/evening-star-candlestick-pattern |
| 8,331 | evening_star | 3 | uptrend | bearish reversal | stock | bearish mean reversion | atr-pattern_high | 1 | 3,972 | 38,410 | 8,490 | 29,345 | 0.143 | 0.05 | 0.22 | 0.57 | 10 | 7 | 3.46 | 3.34 | 3.62 | https://analyzingalpha.com/evening-star-candlestick-pattern |
| 8,332 | evening_star | 3 | uptrend | bearish reversal | stock | bearish mean reversion | atr-pattern_high | 2 | 3,972 | 38,226 | 8,440 | 56,584 | 0.136 | 0.05 | 0.22 | 0.38 | 8 | 8 | 6.70 | 7.74 | 6.07 | https://analyzingalpha.com/evening-star-candlestick-pattern |
| 8,333 | evening_star | 3 | uptrend | bearish reversal | stock | bearish mean reversion | atr-pattern_high | 3 | 3,972 | 38,148 | 8,420 | 82,988 | 0.117 | 0.04 | 0.22 | 0.28 | 6 | 10 | 9.86 | 13.68 | 8.37 | https://analyzingalpha.com/evening-star-candlestick-pattern |
| 8,334 | evening_star | 3 | uptrend | bearish reversal | stock | bearish mean reversion | atr-pattern_high | 4 | 3,972 | 38,102 | 8,398 | 109,326 | 0.088 | 0.03 | 0.22 | 0.22 | 5 | 12 | 13.02 | 20.80 | 10.86 | https://analyzingalpha.com/evening-star-candlestick-pattern |
| 8,335 | evening_star | 3 | uptrend | bearish reversal | stock | bearish mean reversion | atr-pattern_high | 5 | 3,972 | 38,064 | 8,385 | 136,768 | 0.040 | 0.01 | 0.22 | 0.17 | 4 | 12 | 16.31 | 30.22 | 13.38 | https://analyzingalpha.com/evening-star-candlestick-pattern |
| 9,266 | evening_star | 3 | uptrend | bearish reversal | crypto | bullish mean reversion | atr-pattern_low | 1 | 68 | 191 | 86 | 524 | 0.280 | 0.09 | 0.45 | 0.64 | 3 | 2 | 6.09 | 6.75 | 4.94 | https://analyzingalpha.com/evening-star-candlestick-pattern |
| 9,267 | evening_star | 3 | uptrend | bearish reversal | crypto | bullish mean reversion | atr-pattern_low | 2 | 68 | 189 | 83 | 849 | 0.444 | 0.15 | 0.44 | 0.48 | 2 | 3 | 10.23 | 12.18 | 8.42 | https://analyzingalpha.com/evening-star-candlestick-pattern |
| 9,268 | evening_star | 3 | uptrend | bearish reversal | crypto | bullish mean reversion | atr-pattern_low | 3 | 68 | 189 | 83 | 1,094 | 0.489 | 0.16 | 0.44 | 0.37 | 2 | 3 | 13.18 | 17.06 | 10.87 | https://analyzingalpha.com/evening-star-candlestick-pattern |
| 9,269 | evening_star | 3 | uptrend | bearish reversal | crypto | bullish mean reversion | atr-pattern_low | 4 | 68 | 187 | 81 | 1,289 | 0.604 | 0.20 | 0.43 | 0.32 | 2 | 3 | 15.91 | 25.19 | 11.53 | https://analyzingalpha.com/evening-star-candlestick-pattern |
| 9,270 | evening_star | 3 | uptrend | bearish reversal | crypto | bullish mean reversion | atr-pattern_low | 5 | 68 | 185 | 80 | 1,409 | 0.655 | 0.22 | 0.43 | 0.28 | 2 | 3 | 17.61 | 30.32 | 12.79 | https://analyzingalpha.com/evening-star-candlestick-pattern |
| 9,271 | evening_star | 3 | uptrend | bearish reversal | forex | bullish mean reversion | atr-pattern_low | 1 | 544 | 2,770 | 1,298 | 6,741 | 0.196 | 0.07 | 0.47 | 0.60 | 6 | 5 | 5.19 | 4.51 | 6.20 | https://analyzingalpha.com/evening-star-candlestick-pattern |
| 9,272 | evening_star | 3 | uptrend | bearish reversal | forex | bullish mean reversion | atr-pattern_low | 2 | 544 | 2,752 | 1,291 | 13,930 | 0.114 | 0.04 | 0.47 | 0.37 | 5 | 6 | 10.79 | 12.01 | 10.07 | https://analyzingalpha.com/evening-star-candlestick-pattern |
| 9,273 | evening_star | 3 | uptrend | bearish reversal | forex | bullish mean reversion | atr-pattern_low | 3 | 544 | 2,736 | 1,281 | 19,678 | 0.071 | 0.02 | 0.47 | 0.27 | 3 | 7 | 15.36 | 22.75 | 12.67 | https://analyzingalpha.com/evening-star-candlestick-pattern |
| 9,274 | evening_star | 3 | uptrend | bearish reversal | forex | bullish mean reversion | atr-pattern_low | 4 | 544 | 2,728 | 1,275 | 24,914 | 0.080 | 0.03 | 0.47 | 0.22 | 3 | 9 | 19.54 | 36.86 | 14.80 | https://analyzingalpha.com/evening-star-candlestick-pattern |
| 9,275 | evening_star | 3 | uptrend | bearish reversal | forex | bullish mean reversion | atr-pattern_low | 5 | 544 | 2,715 | 1,262 | 29,220 | 0.035 | 0.01 | 0.46 | 0.17 | 2 | 9 | 23.15 | 46.39 | 18.30 | https://analyzingalpha.com/evening-star-candlestick-pattern |
| 9,276 | evening_star | 3 | uptrend | bearish reversal | stock | bullish mean reversion | atr-pattern_low | 1 | 3,972 | 38,415 | 20,976 | 87,527 | 0.201 | 0.07 | 0.55 | 0.60 | 11 | 8 | 4.17 | 3.91 | 4.57 | https://analyzingalpha.com/evening-star-candlestick-pattern |
| 9,277 | evening_star | 3 | uptrend | bearish reversal | stock | bullish mean reversion | atr-pattern_low | 2 | 3,972 | 38,035 | 20,748 | 164,406 | 0.256 | 0.09 | 0.55 | 0.42 | 9 | 13 | 7.92 | 9.26 | 6.97 | https://analyzingalpha.com/evening-star-candlestick-pattern |
| 9,278 | evening_star | 3 | uptrend | bearish reversal | stock | bullish mean reversion | atr-pattern_low | 3 | 3,972 | 37,666 | 20,530 | 232,914 | 0.308 | 0.10 | 0.55 | 0.33 | 6 | 13 | 11.35 | 15.83 | 9.18 | https://analyzingalpha.com/evening-star-candlestick-pattern |
| 9,279 | evening_star | 3 | uptrend | bearish reversal | stock | bullish mean reversion | atr-pattern_low | 4 | 3,972 | 37,350 | 20,331 | 298,619 | 0.358 | 0.12 | 0.54 | 0.27 | 6 | 13 | 14.69 | 24.00 | 11.21 | https://analyzingalpha.com/evening-star-candlestick-pattern |
| 9,280 | evening_star | 3 | uptrend | bearish reversal | stock | bullish mean reversion | atr-pattern_low | 5 | 3,972 | 37,082 | 20,155 | 366,216 | 0.390 | 0.13 | 0.54 | 0.23 | 5 | 14 | 18.17 | 33.40 | 13.57 | https://analyzingalpha.com/evening-star-candlestick-pattern |
| 9,471 | evening_star | 3 | uptrend | bearish reversal | crypto | bullish continuation | low-high | 1 | 68 | 194 | 76 | 146 | -0.556 | -0.19 | 0.39 | 0.22 | 1 | 4 | 1.92 | 4.18 | 1.27 | https://analyzingalpha.com/evening-star-candlestick-pattern |
| 9,472 | evening_star | 3 | uptrend | bearish reversal | crypto | bullish continuation | low-high | 2 | 68 | 194 | 76 | 169 | -0.452 | -0.15 | 0.39 | 0.18 | 1 | 4 | 2.22 | 5.07 | 1.58 | https://analyzingalpha.com/evening-star-candlestick-pattern |
| 9,473 | evening_star | 3 | uptrend | bearish reversal | crypto | bullish continuation | low-high | 3 | 68 | 194 | 76 | 284 | -0.526 | -0.18 | 0.39 | 0.12 | 1 | 4 | 3.74 | 5.56 | 3.49 | https://analyzingalpha.com/evening-star-candlestick-pattern |
| 9,474 | evening_star | 3 | uptrend | bearish reversal | crypto | bullish continuation | low-high | 4 | 68 | 194 | 76 | 291 | -0.408 | -0.14 | 0.39 | 0.12 | 1 | 4 | 3.83 | 6.33 | 3.49 | https://analyzingalpha.com/evening-star-candlestick-pattern |
| 9,475 | evening_star | 3 | uptrend | bearish reversal | crypto | bullish continuation | low-high | 5 | 68 | 194 | 76 | 300 | -0.290 | -0.10 | 0.39 | 0.12 | 1 | 4 | 3.95 | 7.33 | 3.49 | https://analyzingalpha.com/evening-star-candlestick-pattern |
| 9,476 | evening_star | 3 | uptrend | bearish reversal | forex | bullish continuation | low-high | 1 | 544 | 2,777 | 707 | 1,403 | -0.704 | -0.23 | 0.25 | 0.15 | 1 | 5 | 1.98 | 4.27 | 1.59 | https://analyzingalpha.com/evening-star-candlestick-pattern |
| 9,477 | evening_star | 3 | uptrend | bearish reversal | forex | bullish continuation | low-high | 2 | 544 | 2,775 | 706 | 2,111 | -0.678 | -0.23 | 0.25 | 0.11 | 1 | 6 | 2.99 | 10.12 | 2.14 | https://analyzingalpha.com/evening-star-candlestick-pattern |
| 9,478 | evening_star | 3 | uptrend | bearish reversal | forex | bullish continuation | low-high | 3 | 544 | 2,769 | 704 | 3,066 | -0.677 | -0.23 | 0.25 | 0.08 | 1 | 6 | 4.36 | 23.32 | 2.68 | https://analyzingalpha.com/evening-star-candlestick-pattern |
| 9,479 | evening_star | 3 | uptrend | bearish reversal | forex | bullish continuation | low-high | 4 | 544 | 2,768 | 704 | 5,058 | -0.746 | -0.25 | 0.25 | 0.05 | 1 | 6 | 7.18 | 33.56 | 5.76 | https://analyzingalpha.com/evening-star-candlestick-pattern |
| 9,480 | evening_star | 3 | uptrend | bearish reversal | forex | bullish continuation | low-high | 5 | 544 | 2,766 | 703 | 6,096 | -0.745 | -0.25 | 0.25 | 0.04 | 1 | 6 | 8.67 | 42.07 | 7.18 | https://analyzingalpha.com/evening-star-candlestick-pattern |
| 9,481 | evening_star | 3 | uptrend | bearish reversal | stock | bullish continuation | low-high | 1 | 3,972 | 38,587 | 14,601 | 23,771 | -0.602 | -0.20 | 0.38 | 0.20 | 3 | 12 | 1.63 | 2.57 | 1.39 | https://analyzingalpha.com/evening-star-candlestick-pattern |
| 9,482 | evening_star | 3 | uptrend | bearish reversal | stock | bullish continuation | low-high | 2 | 3,972 | 38,531 | 14,574 | 32,578 | -0.554 | -0.18 | 0.38 | 0.15 | 3 | 13 | 2.24 | 4.63 | 1.82 | https://analyzingalpha.com/evening-star-candlestick-pattern |
| 9,483 | evening_star | 3 | uptrend | bearish reversal | stock | bullish continuation | low-high | 3 | 3,972 | 38,483 | 14,559 | 40,559 | -0.514 | -0.17 | 0.38 | 0.12 | 3 | 13 | 2.79 | 7.26 | 2.16 | https://analyzingalpha.com/evening-star-candlestick-pattern |
| 9,484 | evening_star | 3 | uptrend | bearish reversal | stock | bullish continuation | low-high | 4 | 3,972 | 38,433 | 14,543 | 48,683 | -0.492 | -0.16 | 0.38 | 0.10 | 3 | 13 | 3.35 | 10.99 | 2.48 | https://analyzingalpha.com/evening-star-candlestick-pattern |
| 9,485 | evening_star | 3 | uptrend | bearish reversal | stock | bullish continuation | low-high | 5 | 3,972 | 38,399 | 14,528 | 55,781 | -0.465 | -0.16 | 0.38 | 0.09 | 3 | 14 | 3.84 | 13.67 | 2.88 | https://analyzingalpha.com/evening-star-candlestick-pattern |
| 9,941 | evening_star | 3 | uptrend | bearish reversal | crypto | bearish reversal | high-close | 1 | 68 | 190 | 184 | 1,740 | -0.042 | -0.01 | 0.97 | 0.48 | 4 | 3 | 9.46 | 9.89 | 9.06 | https://analyzingalpha.com/evening-star-candlestick-pattern |
| 9,942 | evening_star | 3 | uptrend | bearish reversal | crypto | bearish reversal | high-close | 2 | 68 | 188 | 180 | 3,211 | -0.186 | -0.06 | 0.96 | 0.27 | 3 | 4 | 17.84 | 15.10 | 18.86 | https://analyzingalpha.com/evening-star-candlestick-pattern |
| 9,943 | evening_star | 3 | uptrend | bearish reversal | crypto | bearish reversal | high-close | 3 | 68 | 184 | 174 | 4,366 | -0.314 | -0.10 | 0.95 | 0.17 | 3 | 5 | 25.09 | 38.40 | 22.32 | https://analyzingalpha.com/evening-star-candlestick-pattern |
| 9,944 | evening_star | 3 | uptrend | bearish reversal | crypto | bearish reversal | high-close | 4 | 68 | 177 | 165 | 5,671 | -0.454 | -0.15 | 0.93 | 0.11 | 2 | 5 | 34.37 | 32.17 | 34.64 | https://analyzingalpha.com/evening-star-candlestick-pattern |
| 9,945 | evening_star | 3 | uptrend | bearish reversal | crypto | bearish reversal | high-close | 5 | 68 | 175 | 162 | 6,559 | -0.480 | -0.16 | 0.93 | 0.09 | 1 | 6 | 40.49 | 90.86 | 35.72 | https://analyzingalpha.com/evening-star-candlestick-pattern |
| 9,946 | evening_star | 3 | uptrend | bearish reversal | forex | bearish reversal | high-close | 1 | 544 | 2,753 | 2,674 | 16,571 | 0.022 | 0.01 | 0.97 | 0.51 | 11 | 8 | 6.20 | 5.76 | 6.65 | https://analyzingalpha.com/evening-star-candlestick-pattern |
| 9,947 | evening_star | 3 | uptrend | bearish reversal | forex | bearish reversal | high-close | 2 | 544 | 2,731 | 2,651 | 31,098 | 0.012 | 0.00 | 0.97 | 0.34 | 9 | 8 | 11.73 | 14.64 | 10.26 | https://analyzingalpha.com/evening-star-candlestick-pattern |
| 9,948 | evening_star | 3 | uptrend | bearish reversal | forex | bearish reversal | high-close | 3 | 544 | 2,716 | 2,631 | 47,238 | 0.003 | 0.00 | 0.97 | 0.25 | 8 | 10 | 17.95 | 27.41 | 14.79 | https://analyzingalpha.com/evening-star-candlestick-pattern |
| 9,949 | evening_star | 3 | uptrend | bearish reversal | forex | bearish reversal | high-close | 4 | 544 | 2,703 | 2,613 | 63,333 | -0.012 | 0.00 | 0.97 | 0.20 | 7 | 10 | 24.24 | 46.86 | 18.68 | https://analyzingalpha.com/evening-star-candlestick-pattern |
| 9,950 | evening_star | 3 | uptrend | bearish reversal | forex | bearish reversal | high-close | 5 | 544 | 2,690 | 2,593 | 75,308 | -0.050 | -0.02 | 0.96 | 0.16 | 5 | 13 | 29.04 | 68.75 | 21.58 | https://analyzingalpha.com/evening-star-candlestick-pattern |
| 9,951 | evening_star | 3 | uptrend | bearish reversal | stock | bearish reversal | high-close | 1 | 3,972 | 38,204 | 34,485 | 222,000 | 0.004 | 0.00 | 0.90 | 0.50 | 19 | 12 | 6.44 | 6.17 | 6.71 | https://analyzingalpha.com/evening-star-candlestick-pattern |
| 9,952 | evening_star | 3 | uptrend | bearish reversal | stock | bearish reversal | high-close | 2 | 3,972 | 37,781 | 34,045 | 424,872 | -0.016 | -0.01 | 0.90 | 0.33 | 13 | 17 | 12.48 | 15.14 | 11.19 | https://analyzingalpha.com/evening-star-candlestick-pattern |
| 9,953 | evening_star | 3 | uptrend | bearish reversal | stock | bearish reversal | high-close | 3 | 3,972 | 37,371 | 33,598 | 617,609 | -0.049 | -0.02 | 0.90 | 0.24 | 10 | 19 | 18.38 | 27.76 | 15.48 | https://analyzingalpha.com/evening-star-candlestick-pattern |
| 9,954 | evening_star | 3 | uptrend | bearish reversal | stock | bearish reversal | high-close | 4 | 3,972 | 36,947 | 33,120 | 771,773 | -0.092 | -0.03 | 0.90 | 0.18 | 9 | 20 | 23.30 | 40.86 | 19.40 | https://analyzingalpha.com/evening-star-candlestick-pattern |
| 9,955 | evening_star | 3 | uptrend | bearish reversal | stock | bearish reversal | high-close | 5 | 3,972 | 36,551 | 32,666 | 914,287 | -0.135 | -0.05 | 0.89 | 0.15 | 8 | 23 | 27.99 | 55.18 | 23.37 | https://analyzingalpha.com/evening-star-candlestick-pattern |
| 11,426 | evening_star | 3 | uptrend | bearish reversal | crypto | bullish continuation | low-close | 1 | 68 | 194 | 191 | 233 | -0.857 | -0.29 | 0.98 | 0.07 | 1 | 7 | 1.22 | 1.00 | 1.24 | https://analyzingalpha.com/evening-star-candlestick-pattern |
| 11,427 | evening_star | 3 | uptrend | bearish reversal | crypto | bullish continuation | low-close | 2 | 68 | 194 | 191 | 237 | -0.814 | -0.27 | 0.98 | 0.06 | 1 | 7 | 1.24 | 1.08 | 1.25 | https://analyzingalpha.com/evening-star-candlestick-pattern |
| 11,428 | evening_star | 3 | uptrend | bearish reversal | crypto | bullish continuation | low-close | 3 | 68 | 194 | 191 | 268 | -0.766 | -0.26 | 0.98 | 0.06 | 1 | 7 | 1.40 | 3.82 | 1.26 | https://analyzingalpha.com/evening-star-candlestick-pattern |
| 11,429 | evening_star | 3 | uptrend | bearish reversal | crypto | bullish continuation | low-close | 4 | 68 | 194 | 191 | 270 | -0.708 | -0.24 | 0.98 | 0.06 | 1 | 7 | 1.41 | 4.00 | 1.26 | https://analyzingalpha.com/evening-star-candlestick-pattern |
| 11,430 | evening_star | 3 | uptrend | bearish reversal | crypto | bullish continuation | low-close | 5 | 68 | 194 | 191 | 274 | -0.690 | -0.23 | 0.98 | 0.05 | 1 | 7 | 1.43 | 4.60 | 1.26 | https://analyzingalpha.com/evening-star-candlestick-pattern |
| 11,431 | evening_star | 3 | uptrend | bearish reversal | forex | bullish continuation | low-close | 1 | 544 | 2,776 | 2,746 | 3,427 | -0.858 | -0.29 | 0.99 | 0.07 | 3 | 13 | 1.25 | 2.94 | 1.12 | https://analyzingalpha.com/evening-star-candlestick-pattern |
| 11,432 | evening_star | 3 | uptrend | bearish reversal | forex | bullish continuation | low-close | 2 | 544 | 2,775 | 2,745 | 3,970 | -0.828 | -0.28 | 0.99 | 0.06 | 2 | 13 | 1.45 | 4.17 | 1.28 | https://analyzingalpha.com/evening-star-candlestick-pattern |
| 11,433 | evening_star | 3 | uptrend | bearish reversal | forex | bullish continuation | low-close | 3 | 544 | 2,775 | 2,745 | 4,276 | -0.825 | -0.28 | 0.99 | 0.05 | 1 | 13 | 1.56 | 4.36 | 1.43 | https://analyzingalpha.com/evening-star-candlestick-pattern |
| 11,434 | evening_star | 3 | uptrend | bearish reversal | forex | bullish continuation | low-close | 4 | 544 | 2,774 | 2,744 | 4,568 | -0.800 | -0.27 | 0.99 | 0.04 | 1 | 17 | 1.66 | 6.42 | 1.47 | https://analyzingalpha.com/evening-star-candlestick-pattern |
| 11,435 | evening_star | 3 | uptrend | bearish reversal | forex | bullish continuation | low-close | 5 | 544 | 2,773 | 2,743 | 4,789 | -0.780 | -0.26 | 0.99 | 0.04 | 1 | 17 | 1.75 | 8.14 | 1.51 | https://analyzingalpha.com/evening-star-candlestick-pattern |
| 11,436 | evening_star | 3 | uptrend | bearish reversal | stock | bullish continuation | low-close | 1 | 3,972 | 38,657 | 35,871 | 37,673 | -0.881 | -0.29 | 0.93 | 0.06 | 3 | 25 | 1.05 | 1.43 | 1.03 | https://analyzingalpha.com/evening-star-candlestick-pattern |
| 11,437 | evening_star | 3 | uptrend | bearish reversal | stock | bullish continuation | low-close | 2 | 3,972 | 38,655 | 35,869 | 39,497 | -0.846 | -0.28 | 0.93 | 0.05 | 2 | 25 | 1.10 | 1.87 | 1.06 | https://analyzingalpha.com/evening-star-candlestick-pattern |
| 11,438 | evening_star | 3 | uptrend | bearish reversal | stock | bullish continuation | low-close | 3 | 3,972 | 38,647 | 35,861 | 41,528 | -0.809 | -0.27 | 0.93 | 0.05 | 2 | 27 | 1.16 | 2.53 | 1.09 | https://analyzingalpha.com/evening-star-candlestick-pattern |
| 11,439 | evening_star | 3 | uptrend | bearish reversal | stock | bullish continuation | low-close | 4 | 3,972 | 38,638 | 35,851 | 44,117 | -0.792 | -0.26 | 0.93 | 0.04 | 2 | 27 | 1.23 | 3.37 | 1.14 | https://analyzingalpha.com/evening-star-candlestick-pattern |
| 11,440 | evening_star | 3 | uptrend | bearish reversal | stock | bullish continuation | low-close | 5 | 3,972 | 38,629 | 35,842 | 46,045 | -0.765 | -0.26 | 0.93 | 0.04 | 2 | 27 | 1.28 | 4.22 | 1.17 | https://analyzingalpha.com/evening-star-candlestick-pattern |
| 13,646 | evening_star | 3 | uptrend | bearish reversal | crypto | bearish reversal | high-low | 1 | 68 | 190 | 130 | 1,437 | -0.096 | -0.03 | 0.68 | 0.45 | 3 | 3 | 11.05 | 10.76 | 11.30 | https://analyzingalpha.com/evening-star-candlestick-pattern |
| 13,647 | evening_star | 3 | uptrend | bearish reversal | crypto | bearish reversal | high-low | 2 | 68 | 186 | 126 | 3,019 | -0.216 | -0.07 | 0.68 | 0.26 | 2 | 4 | 23.96 | 24.67 | 23.71 | https://analyzingalpha.com/evening-star-candlestick-pattern |
| 13,648 | evening_star | 3 | uptrend | bearish reversal | crypto | bearish reversal | high-low | 3 | 68 | 182 | 120 | 3,714 | -0.295 | -0.10 | 0.66 | 0.18 | 2 | 4 | 30.95 | 39.05 | 29.23 | https://analyzingalpha.com/evening-star-candlestick-pattern |
| 13,649 | evening_star | 3 | uptrend | bearish reversal | crypto | bearish reversal | high-low | 4 | 68 | 177 | 115 | 5,137 | -0.484 | -0.16 | 0.65 | 0.10 | 1 | 4 | 44.67 | 123.33 | 35.50 | https://analyzingalpha.com/evening-star-candlestick-pattern |
| 13,650 | evening_star | 3 | uptrend | bearish reversal | crypto | bearish reversal | high-low | 5 | 68 | 176 | 114 | 4,976 | -0.635 | -0.21 | 0.65 | 0.06 | 1 | 4 | 43.65 | 59.43 | 42.62 | https://analyzingalpha.com/evening-star-candlestick-pattern |
| 13,651 | evening_star | 3 | uptrend | bearish reversal | forex | bearish reversal | high-low | 1 | 544 | 2,752 | 1,966 | 17,236 | -0.021 | -0.01 | 0.71 | 0.49 | 9 | 7 | 8.77 | 8.73 | 8.81 | https://analyzingalpha.com/evening-star-candlestick-pattern |
| 13,652 | evening_star | 3 | uptrend | bearish reversal | forex | bearish reversal | high-low | 2 | 544 | 2,738 | 1,955 | 33,935 | -0.034 | -0.01 | 0.71 | 0.32 | 9 | 7 | 17.36 | 24.49 | 13.95 | https://analyzingalpha.com/evening-star-candlestick-pattern |
| 13,653 | evening_star | 3 | uptrend | bearish reversal | forex | bearish reversal | high-low | 3 | 544 | 2,723 | 1,937 | 52,788 | -0.043 | -0.01 | 0.71 | 0.24 | 7 | 9 | 27.25 | 46.02 | 21.38 | https://analyzingalpha.com/evening-star-candlestick-pattern |
| 13,654 | evening_star | 3 | uptrend | bearish reversal | forex | bearish reversal | high-low | 4 | 544 | 2,705 | 1,916 | 68,269 | -0.096 | -0.03 | 0.71 | 0.18 | 4 | 9 | 35.63 | 80.57 | 25.73 | https://analyzingalpha.com/evening-star-candlestick-pattern |
| 13,655 | evening_star | 3 | uptrend | bearish reversal | forex | bearish reversal | high-low | 5 | 544 | 2,681 | 1,894 | 87,132 | -0.120 | -0.04 | 0.71 | 0.15 | 4 | 10 | 46.00 | 129.87 | 31.64 | https://analyzingalpha.com/evening-star-candlestick-pattern |
| 13,656 | evening_star | 3 | uptrend | bearish reversal | stock | bearish reversal | high-low | 1 | 3,972 | 38,104 | 29,877 | 232,939 | -0.022 | -0.01 | 0.78 | 0.49 | 15 | 11 | 7.80 | 7.66 | 7.92 | https://analyzingalpha.com/evening-star-candlestick-pattern |
| 13,657 | evening_star | 3 | uptrend | bearish reversal | stock | bearish reversal | high-low | 2 | 3,972 | 37,647 | 29,455 | 454,362 | -0.066 | -0.02 | 0.78 | 0.31 | 11 | 16 | 15.43 | 19.35 | 13.65 | https://analyzingalpha.com/evening-star-candlestick-pattern |
| 13,658 | evening_star | 3 | uptrend | bearish reversal | stock | bearish reversal | high-low | 3 | 3,972 | 37,231 | 29,023 | 648,666 | -0.117 | -0.04 | 0.78 | 0.22 | 9 | 18 | 22.35 | 34.40 | 18.92 | https://analyzingalpha.com/evening-star-candlestick-pattern |
| 13,659 | evening_star | 3 | uptrend | bearish reversal | stock | bearish reversal | high-low | 4 | 3,972 | 36,792 | 28,577 | 800,122 | -0.150 | -0.05 | 0.78 | 0.17 | 7 | 21 | 28.00 | 50.22 | 23.46 | https://analyzingalpha.com/evening-star-candlestick-pattern |
| 13,660 | evening_star | 3 | uptrend | bearish reversal | stock | bearish reversal | high-low | 5 | 3,972 | 36,332 | 28,116 | 957,279 | -0.185 | -0.06 | 0.77 | 0.14 | 7 | 23 | 34.05 | 71.31 | 28.23 | https://analyzingalpha.com/evening-star-candlestick-pattern |
| Market | Strategy | Setup | Trades | Edge |
Pattern:
Pattern Bars:
Required Trend:
Traditional Strategy:
Market:
Strategy:
Setup:
RR:
Tickers:
Signals:
Trades:
Trade Bars:
Edge:
Edge Per Bar:
Confirm %:
Win %:
Cons Wins:
Cons Losses:
Avg. Trade Bars:
Avg. Win Bars:
Avg. Loss Bars:
Similar Candlestick Patterns
Multiple candlestick patterns are often confused with the evening star pattern. It’s essential to understand the differences when using candlestick pattern technical analysis.
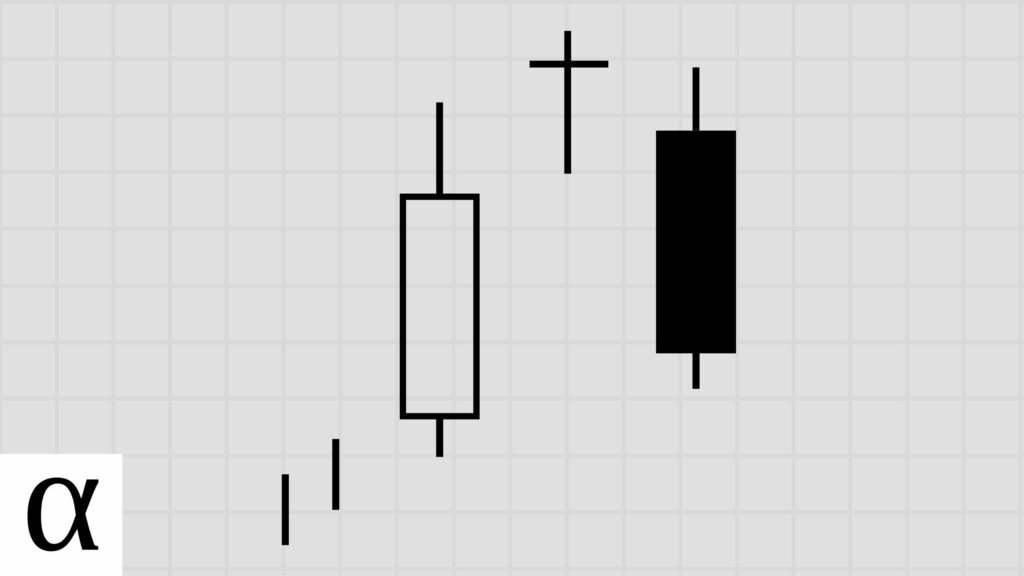
Morning Star vs. Evening Star
The morning star candlestick pattern is the mirror opposite of the evening pattern. The morning star occurs in a downtrend. Its first candle is long and bearish, the second has a short real body and gaps down, and the third candle is bullish and closes the gap.
Traditional technical analysis teaches that these patterns are reversals, but the data shows that they likely lead to future short-term volatility.
Evening Doji Star vs. Evening Star
The evening doji star candlestick pattern is similar to the evening star. They are both three-bar patterns commonly thought of as bearish reversals. The difference between the evening doji star and the evening star is that the evening doji star’s middle candle is exactly that–a doji.
The Bottom Line
The evening star candlestick pattern is a three-candle bearish reversal pattern that historically leads to volatility. The best evening star trading strategy is a bullish mean reversion strategy in the stock and crypto markets and a bearish mean reversion strategy in the forex market. Trading is easy when you use data to determine the best candlestick patterns.