The bearish three-line strike is a rare four-bar bearish continuation Japanese candlestick pattern that suggests medium-term volatility, according to a multiple decades-long backtest.
What if I told you that the crowd is wrong and you should do the opposite of conventional wisdom to turn this into a wildly profitable pattern?
Would that pique your interest?
Keep reading to learn how to profit with the bearish three-line strike candlestick pattern in a data-driven way.
What Is a Bearish Three-Line Strike Candlestick Pattern?

The bearish three-line strike candle pattern is a four-candle bearish continuation pattern. The basic premise is that the overriding trend, which in this case is bearish, will win out.
Does this hold?
Before we dig into the backtest results, let’s learn how to identify this pattern on our candlestick charts.
How to Identify Bearish Three-Line Strike Candlestick Patterns

The following are the requirements for a valid bearish three-line strike pattern:
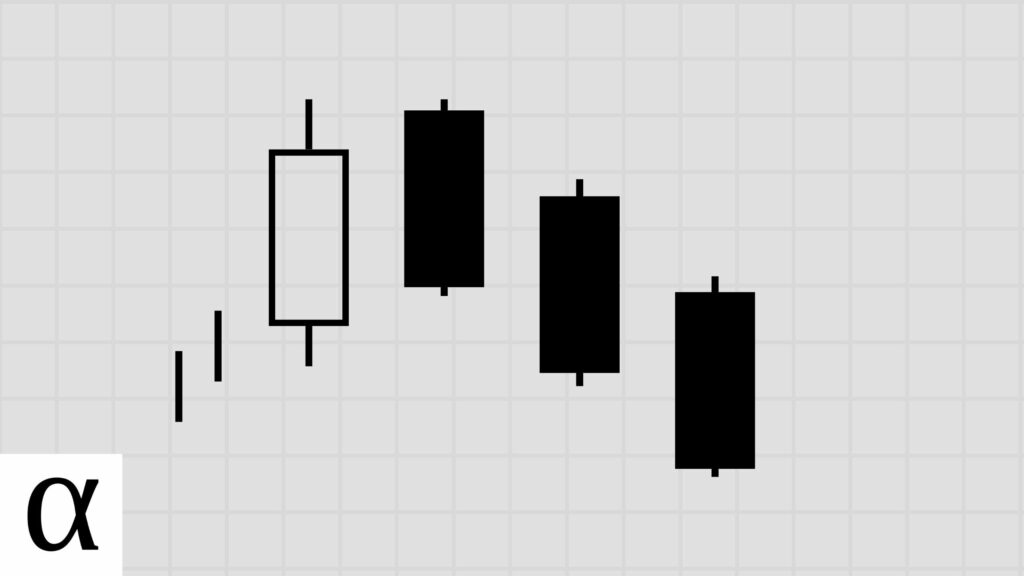
- The first three consecutive bearish candles should close lower than the previous candle.
- The first three candles should be similar in length, resembling a staircase.
- The fourth bullish bar should engulf the real bodies of all three previous bearish candles, e.g.:
- The opening price of the fourth candle should be lower than the third candle’s closing price.
- The closing price of the fourth bullish candlestick should be higher than the first candle’s opening price.
- The bearish three-line strike must occur during a downtrend.
The Starbucks (SBUX) daily chart on July 24th, 2002, shows the bearish three-line strike in action. We see that price is in a downtrend, with the price action falling under the fifty-day moving average.
We also see a downward staircase-like pattern for the three bearish candlesticks right before the reversal bar fully engulfs the last three candles.
With the bullish engulfing candle, we see that the fourth bar opened lower than the third bar’s close and higher than the first bar’s opening, which completes the pattern.
Now that we know how to identify the pattern, let’s learn how to trade this pattern profitably.
How to Trade the Bearish Three-Line Strike Candlestick Pattern
The bearish three-line strike candlestick pattern should be traded using a bearish mean reversion strategy in the crypto and forex markets and a bullish mean reversion trading strategy in the stock market.
But before we learn the optimal trade setups, let’s better understand how this pattern is traditionally traded.
Bearish Three-Line Strike Continuation Trade Setup

Let’s practice identifying this four-bar candlestick pattern again.
We see the pattern on the AMD chart above. Price is in a downtrend as it’s below the 50-day simple moving average. The first three consecutive bearish candles opened and closed lower than the previous candles. And the fourth bullish candle opened lower than the third candle’s close and closed higher than the first candle’s open and completed the pattern.
Most traders trade bearish three-line strike candlestick patterns by entering the market with a short position once the price breaks below the fourth candle’s low. The position is secured with a stop loss above the fourth candle’s high, looking for a trend continuation.
And if you’re like most traders, you’ve been on the wrong side of history.
But, as promised, there’s an even better way to trade this pattern according to backtests and capture the pattern’s likely incoming volatility.
Bearish Three-Line Strike Bullish Mean Reversion Trade Strategy

Intel Corporation’s (INTC) daily price chart on August 29th, 2005, perfectly demonstrates the mean reversion strategy. You can trade this pattern using a bullish and bearish mean reversion strategy.
For now, let’s cover the bullish side.
We see the three bearish bodies in a downward, staircase-like pattern. The fourth candle reverses the bear momentum and opens lower and closes higher than the previous candles.
With the pattern identified, how do we enter?
A bullish mean reversion strategy waits for the price to break the pattern low, which typically is the low of the fourth candle, and enters long once prices pass back above the low with a stop loss set at one average true range or ATR. We give the signal and the trigger up to three days to confirm.
Let’s make this lucid with an example.
In the Intel example above, we see the completed pattern on August 29th, 2005, with a low of $25.31 on the previous day. We now wait up to three days for the price to cross below that low.
Price crosses below our pattern low on September 1st, the third day. We now wait up to three more days for the price to cross back above the pattern low. The price rises above our target the next day, causing an entry and turning into a profitable trade.
Bearish Three-Line Strike Bullish Mean Reversion Trade Strategy

Let’s review the mean reversion strategy again; except for this type, we’ll go bearish.
We saw the bearish three-line strike candle pattern on the Canadian dollar daily chart on February 24th, 2015.
The price is in a downtrend, followed by three similar-length real-bodied candles in the downward staircase fashion, followed by a bullish engulfing candle.
With the pattern identified, smart forex and crypto traders wait for the price to rise above the high of $0.8048, which happens the day after identification with pricing moving lower, triggering a short entry leading to another profitable trade.
Regardless of which direction you trade, it’s safe to say that the bearish three-line strike means volatility is incoming.
But how profitable were these trading strategies historically?
Does the Bearish Three-Line Strike Candlestick Pattern Work? (Backtest Results)
Using the following rules, I backtested the bearish three-line strike candlestick pattern on the daily timeframe in the crypto, forex, and stock markets.
- A close above the 50-day SMA constitutes an uptrend.
- I tested risk-reward ranges from 1 to 5.
- The optimal risk-reward ratio is selected using profit per bar.
- Entry and exits are discussed in the how-to trade section above.
- Confirmation must occur within three days of the pattern signal.
| Id | Pattern | Pattern Bars | Required Trend | Traditional Strategy | Market | Strategy | Setup | RR | Tickers | Signals | Trades | Trade Bars | Edge | Edge Per Bar | Confirm % | Win % | Cons Wins | Cons Losses | Avg. Trade Bars | Avg. Win Bars | Avg. Loss Bars | Details |
|---|---|---|---|---|---|---|---|---|---|---|---|---|---|---|---|---|---|---|---|---|---|---|
| 7,571 | bearish_three_line_strike | 4 | downtrend | bearish continuation | crypto | bearish continuation | high-close | 1 | 26 | 77 | 76 | 101 | -0.182 | -0.05 | 0.99 | 0.41 | 6 | 3 | 1.33 | 1.55 | 1.18 | https://analyzingalpha.com/bearish-three-line-strike-candlestick-pattern |
| 7,572 | bearish_three_line_strike | 4 | downtrend | bearish continuation | crypto | bearish continuation | high-close | 2 | 26 | 76 | 75 | 134 | -0.160 | -0.04 | 0.99 | 0.28 | 6 | 4 | 1.79 | 2.81 | 1.39 | https://analyzingalpha.com/bearish-three-line-strike-candlestick-pattern |
| 7,573 | bearish_three_line_strike | 4 | downtrend | bearish continuation | crypto | bearish continuation | high-close | 3 | 26 | 76 | 75 | 175 | 0.071 | 0.02 | 0.99 | 0.27 | 6 | 4 | 2.33 | 4.50 | 1.55 | https://analyzingalpha.com/bearish-three-line-strike-candlestick-pattern |
| 7,574 | bearish_three_line_strike | 4 | downtrend | bearish continuation | crypto | bearish continuation | high-close | 4 | 26 | 76 | 75 | 208 | 0.200 | 0.05 | 0.99 | 0.24 | 6 | 4 | 2.77 | 6.28 | 1.67 | https://analyzingalpha.com/bearish-three-line-strike-candlestick-pattern |
| 7,575 | bearish_three_line_strike | 4 | downtrend | bearish continuation | crypto | bearish continuation | high-close | 5 | 26 | 76 | 75 | 293 | 0.275 | 0.07 | 0.99 | 0.21 | 6 | 4 | 3.91 | 10.81 | 2.03 | https://analyzingalpha.com/bearish-three-line-strike-candlestick-pattern |
| 7,576 | bearish_three_line_strike | 4 | downtrend | bearish continuation | forex | bearish continuation | high-close | 1 | 287 | 856 | 849 | 1,225 | -0.475 | -0.12 | 0.99 | 0.27 | 4 | 8 | 1.44 | 1.24 | 1.51 | https://analyzingalpha.com/bearish-three-line-strike-candlestick-pattern |
| 7,577 | bearish_three_line_strike | 4 | downtrend | bearish continuation | forex | bearish continuation | high-close | 2 | 287 | 856 | 849 | 1,530 | -0.342 | -0.09 | 0.99 | 0.22 | 4 | 8 | 1.80 | 1.74 | 1.82 | https://analyzingalpha.com/bearish-three-line-strike-candlestick-pattern |
| 7,578 | bearish_three_line_strike | 4 | downtrend | bearish continuation | forex | bearish continuation | high-close | 3 | 287 | 856 | 849 | 1,716 | -0.240 | -0.06 | 0.99 | 0.19 | 4 | 8 | 2.02 | 2.37 | 1.94 | https://analyzingalpha.com/bearish-three-line-strike-candlestick-pattern |
| 7,579 | bearish_three_line_strike | 4 | downtrend | bearish continuation | forex | bearish continuation | high-close | 4 | 287 | 855 | 848 | 1,995 | -0.200 | -0.05 | 0.99 | 0.16 | 4 | 8 | 2.35 | 3.46 | 2.14 | https://analyzingalpha.com/bearish-three-line-strike-candlestick-pattern |
| 7,580 | bearish_three_line_strike | 4 | downtrend | bearish continuation | forex | bearish continuation | high-close | 5 | 287 | 855 | 847 | 2,242 | -0.170 | -0.04 | 0.99 | 0.14 | 4 | 8 | 2.65 | 4.72 | 2.32 | https://analyzingalpha.com/bearish-three-line-strike-candlestick-pattern |
| 7,581 | bearish_three_line_strike | 4 | downtrend | bearish continuation | stock | bearish continuation | high-close | 1 | 702 | 1,709 | 1,578 | 2,481 | -0.356 | -0.09 | 0.92 | 0.32 | 5 | 6 | 1.57 | 1.54 | 1.59 | https://analyzingalpha.com/bearish-three-line-strike-candlestick-pattern |
| 7,582 | bearish_three_line_strike | 4 | downtrend | bearish continuation | stock | bearish continuation | high-close | 2 | 702 | 1,708 | 1,577 | 3,041 | -0.136 | -0.03 | 0.92 | 0.29 | 4 | 6 | 1.93 | 2.16 | 1.84 | https://analyzingalpha.com/bearish-three-line-strike-candlestick-pattern |
| 7,583 | bearish_three_line_strike | 4 | downtrend | bearish continuation | stock | bearish continuation | high-close | 3 | 702 | 1,708 | 1,576 | 4,162 | 0.034 | 0.01 | 0.92 | 0.26 | 4 | 6 | 2.64 | 4.49 | 2.00 | https://analyzingalpha.com/bearish-three-line-strike-candlestick-pattern |
| 7,584 | bearish_three_line_strike | 4 | downtrend | bearish continuation | stock | bearish continuation | high-close | 4 | 702 | 1,708 | 1,576 | 4,744 | 0.154 | 0.04 | 0.92 | 0.23 | 3 | 6 | 3.01 | 4.57 | 2.54 | https://analyzingalpha.com/bearish-three-line-strike-candlestick-pattern |
| 7,585 | bearish_three_line_strike | 4 | downtrend | bearish continuation | stock | bearish continuation | high-close | 5 | 702 | 1,708 | 1,575 | 5,278 | 0.275 | 0.07 | 0.92 | 0.21 | 3 | 6 | 3.35 | 5.27 | 2.83 | https://analyzingalpha.com/bearish-three-line-strike-candlestick-pattern |
| 7,826 | bearish_three_line_strike | 4 | downtrend | bearish continuation | crypto | bearish continuation | high-low | 1 | 26 | 77 | 20 | 80 | 0.100 | 0.03 | 0.26 | 0.55 | 4 | 1 | 4.00 | 5.55 | 2.11 | https://analyzingalpha.com/bearish-three-line-strike-candlestick-pattern |
| 7,827 | bearish_three_line_strike | 4 | downtrend | bearish continuation | crypto | bearish continuation | high-low | 2 | 26 | 76 | 19 | 116 | 0.418 | 0.10 | 0.25 | 0.47 | 3 | 1 | 6.11 | 8.33 | 4.10 | https://analyzingalpha.com/bearish-three-line-strike-candlestick-pattern |
| 7,828 | bearish_three_line_strike | 4 | downtrend | bearish continuation | crypto | bearish continuation | high-low | 3 | 26 | 75 | 19 | 258 | 0.268 | 0.07 | 0.25 | 0.32 | 2 | 1 | 13.58 | 17.67 | 11.69 | https://analyzingalpha.com/bearish-three-line-strike-candlestick-pattern |
| 7,829 | bearish_three_line_strike | 4 | downtrend | bearish continuation | crypto | bearish continuation | high-low | 4 | 26 | 73 | 18 | 250 | -0.162 | -0.04 | 0.25 | 0.17 | 1 | 4 | 13.89 | 22.67 | 12.13 | https://analyzingalpha.com/bearish-three-line-strike-candlestick-pattern |
| 7,830 | bearish_three_line_strike | 4 | downtrend | bearish continuation | crypto | bearish continuation | high-low | 5 | 26 | 73 | 18 | 270 | -0.335 | -0.08 | 0.25 | 0.11 | 1 | 4 | 15.00 | 32.50 | 12.81 | https://analyzingalpha.com/bearish-three-line-strike-candlestick-pattern |
| 7,831 | bearish_three_line_strike | 4 | downtrend | bearish continuation | forex | bearish continuation | high-low | 1 | 287 | 856 | 204 | 807 | -0.441 | -0.11 | 0.24 | 0.28 | 2 | 4 | 3.96 | 5.39 | 3.40 | https://analyzingalpha.com/bearish-three-line-strike-candlestick-pattern |
| 7,832 | bearish_three_line_strike | 4 | downtrend | bearish continuation | forex | bearish continuation | high-low | 2 | 287 | 855 | 203 | 1,361 | -0.376 | -0.09 | 0.24 | 0.21 | 2 | 4 | 6.70 | 12.17 | 5.28 | https://analyzingalpha.com/bearish-three-line-strike-candlestick-pattern |
| 7,833 | bearish_three_line_strike | 4 | downtrend | bearish continuation | forex | bearish continuation | high-low | 3 | 287 | 853 | 201 | 1,920 | -0.428 | -0.11 | 0.24 | 0.14 | 2 | 4 | 9.55 | 16.62 | 8.36 | https://analyzingalpha.com/bearish-three-line-strike-candlestick-pattern |
| 7,834 | bearish_three_line_strike | 4 | downtrend | bearish continuation | forex | bearish continuation | high-low | 4 | 287 | 852 | 201 | 2,254 | -0.454 | -0.11 | 0.24 | 0.11 | 2 | 4 | 11.21 | 28.23 | 9.12 | https://analyzingalpha.com/bearish-three-line-strike-candlestick-pattern |
| 7,835 | bearish_three_line_strike | 4 | downtrend | bearish continuation | forex | bearish continuation | high-low | 5 | 287 | 852 | 201 | 2,669 | -0.425 | -0.11 | 0.24 | 0.10 | 2 | 4 | 13.28 | 43.84 | 10.09 | https://analyzingalpha.com/bearish-three-line-strike-candlestick-pattern |
| 7,836 | bearish_three_line_strike | 4 | downtrend | bearish continuation | stock | bearish continuation | high-low | 1 | 702 | 1,707 | 424 | 3,027 | -0.160 | -0.04 | 0.25 | 0.42 | 2 | 3 | 7.14 | 7.76 | 6.69 | https://analyzingalpha.com/bearish-three-line-strike-candlestick-pattern |
| 7,837 | bearish_three_line_strike | 4 | downtrend | bearish continuation | stock | bearish continuation | high-low | 2 | 702 | 1,704 | 424 | 7,001 | -0.158 | -0.04 | 0.25 | 0.28 | 2 | 3 | 16.51 | 28.83 | 11.70 | https://analyzingalpha.com/bearish-three-line-strike-candlestick-pattern |
| 7,838 | bearish_three_line_strike | 4 | downtrend | bearish continuation | stock | bearish continuation | high-low | 3 | 702 | 1,701 | 424 | 12,067 | -0.231 | -0.06 | 0.25 | 0.19 | 2 | 3 | 28.46 | 23.84 | 29.57 | https://analyzingalpha.com/bearish-three-line-strike-candlestick-pattern |
| 7,839 | bearish_three_line_strike | 4 | downtrend | bearish continuation | stock | bearish continuation | high-low | 4 | 702 | 1,699 | 424 | 16,148 | -0.238 | -0.06 | 0.25 | 0.15 | 2 | 3 | 38.08 | 75.98 | 31.22 | https://analyzingalpha.com/bearish-three-line-strike-candlestick-pattern |
| 7,840 | bearish_three_line_strike | 4 | downtrend | bearish continuation | stock | bearish continuation | high-low | 5 | 702 | 1,695 | 421 | 16,235 | -0.215 | -0.05 | 0.25 | 0.13 | 2 | 3 | 38.56 | 79.11 | 32.47 | https://analyzingalpha.com/bearish-three-line-strike-candlestick-pattern |
| 9,821 | bearish_three_line_strike | 4 | downtrend | bearish continuation | crypto | bullish reversal | low-high | 1 | 26 | 75 | 54 | 423 | 0.039 | 0.01 | 0.72 | 0.52 | 3 | 3 | 7.83 | 6.18 | 9.62 | https://analyzingalpha.com/bearish-three-line-strike-candlestick-pattern |
| 9,822 | bearish_three_line_strike | 4 | downtrend | bearish continuation | crypto | bullish reversal | low-high | 2 | 26 | 72 | 51 | 754 | 0.056 | 0.01 | 0.71 | 0.35 | 2 | 4 | 14.78 | 16.56 | 13.82 | https://analyzingalpha.com/bearish-three-line-strike-candlestick-pattern |
| 9,823 | bearish_three_line_strike | 4 | downtrend | bearish continuation | crypto | bullish reversal | low-high | 3 | 26 | 72 | 51 | 908 | 0.252 | 0.06 | 0.71 | 0.31 | 2 | 4 | 17.80 | 25.94 | 14.09 | https://analyzingalpha.com/bearish-three-line-strike-candlestick-pattern |
| 9,824 | bearish_three_line_strike | 4 | downtrend | bearish continuation | crypto | bullish reversal | low-high | 4 | 26 | 72 | 51 | 1,099 | 0.466 | 0.12 | 0.71 | 0.29 | 2 | 4 | 21.55 | 39.07 | 14.25 | https://analyzingalpha.com/bearish-three-line-strike-candlestick-pattern |
| 9,825 | bearish_three_line_strike | 4 | downtrend | bearish continuation | crypto | bullish reversal | low-high | 5 | 26 | 71 | 51 | 1,295 | 0.535 | 0.13 | 0.72 | 0.26 | 2 | 4 | 25.39 | 56.46 | 14.76 | https://analyzingalpha.com/bearish-three-line-strike-candlestick-pattern |
| 9,826 | bearish_three_line_strike | 4 | downtrend | bearish continuation | forex | bullish reversal | low-high | 1 | 287 | 851 | 678 | 6,949 | -0.218 | -0.05 | 0.80 | 0.39 | 4 | 4 | 10.25 | 10.19 | 10.29 | https://analyzingalpha.com/bearish-three-line-strike-candlestick-pattern |
| 9,827 | bearish_three_line_strike | 4 | downtrend | bearish continuation | forex | bullish reversal | low-high | 2 | 287 | 850 | 676 | 11,763 | -0.242 | -0.06 | 0.80 | 0.25 | 4 | 6 | 17.40 | 25.60 | 14.60 | https://analyzingalpha.com/bearish-three-line-strike-candlestick-pattern |
| 9,828 | bearish_three_line_strike | 4 | downtrend | bearish continuation | forex | bullish reversal | low-high | 3 | 287 | 847 | 673 | 17,130 | -0.243 | -0.06 | 0.79 | 0.19 | 4 | 8 | 25.45 | 41.88 | 21.63 | https://analyzingalpha.com/bearish-three-line-strike-candlestick-pattern |
| 9,829 | bearish_three_line_strike | 4 | downtrend | bearish continuation | forex | bullish reversal | low-high | 4 | 287 | 847 | 670 | 21,479 | -0.212 | -0.05 | 0.79 | 0.16 | 2 | 8 | 32.06 | 72.55 | 24.53 | https://analyzingalpha.com/bearish-three-line-strike-candlestick-pattern |
| 9,830 | bearish_three_line_strike | 4 | downtrend | bearish continuation | forex | bullish reversal | low-high | 5 | 287 | 847 | 670 | 25,084 | -0.180 | -0.05 | 0.79 | 0.14 | 2 | 8 | 37.44 | 105.02 | 26.82 | https://analyzingalpha.com/bearish-three-line-strike-candlestick-pattern |
| 9,831 | bearish_three_line_strike | 4 | downtrend | bearish continuation | stock | bullish reversal | low-high | 1 | 702 | 1,705 | 1,309 | 10,333 | 0.095 | 0.02 | 0.77 | 0.55 | 4 | 3 | 7.89 | 7.62 | 8.22 | https://analyzingalpha.com/bearish-three-line-strike-candlestick-pattern |
| 9,832 | bearish_three_line_strike | 4 | downtrend | bearish continuation | stock | bullish reversal | low-high | 2 | 702 | 1,703 | 1,308 | 21,023 | 0.108 | 0.03 | 0.77 | 0.37 | 3 | 4 | 16.07 | 17.78 | 15.07 | https://analyzingalpha.com/bearish-three-line-strike-candlestick-pattern |
| 9,833 | bearish_three_line_strike | 4 | downtrend | bearish continuation | stock | bullish reversal | low-high | 3 | 702 | 1,702 | 1,307 | 29,200 | 0.132 | 0.03 | 0.77 | 0.28 | 3 | 4 | 22.34 | 30.42 | 19.14 | https://analyzingalpha.com/bearish-three-line-strike-candlestick-pattern |
| 9,834 | bearish_three_line_strike | 4 | downtrend | bearish continuation | stock | bullish reversal | low-high | 4 | 702 | 1,701 | 1,307 | 36,880 | 0.196 | 0.05 | 0.77 | 0.24 | 3 | 4 | 28.22 | 45.86 | 22.66 | https://analyzingalpha.com/bearish-three-line-strike-candlestick-pattern |
| 9,835 | bearish_three_line_strike | 4 | downtrend | bearish continuation | stock | bullish reversal | low-high | 5 | 702 | 1,700 | 1,306 | 43,543 | 0.245 | 0.06 | 0.77 | 0.21 | 3 | 4 | 33.34 | 63.99 | 25.35 | https://analyzingalpha.com/bearish-three-line-strike-candlestick-pattern |
| 12,181 | bearish_three_line_strike | 4 | downtrend | bearish continuation | crypto | bearish mean reversion | atr-pattern_high | 1 | 26 | 77 | 42 | 173 | 0.478 | 0.12 | 0.55 | 0.74 | 2 | 2 | 4.12 | 4.13 | 4.09 | https://analyzingalpha.com/bearish-three-line-strike-candlestick-pattern |
| 12,182 | bearish_three_line_strike | 4 | downtrend | bearish continuation | crypto | bearish mean reversion | atr-pattern_high | 2 | 26 | 75 | 40 | 361 | 0.350 | 0.09 | 0.53 | 0.45 | 2 | 2 | 9.02 | 11.89 | 6.68 | https://analyzingalpha.com/bearish-three-line-strike-candlestick-pattern |
| 12,183 | bearish_three_line_strike | 4 | downtrend | bearish continuation | crypto | bearish mean reversion | atr-pattern_high | 3 | 26 | 74 | 39 | 497 | 0.535 | 0.13 | 0.53 | 0.39 | 1 | 2 | 12.74 | 19.20 | 8.71 | https://analyzingalpha.com/bearish-three-line-strike-candlestick-pattern |
| 12,184 | bearish_three_line_strike | 4 | downtrend | bearish continuation | crypto | bearish mean reversion | atr-pattern_high | 4 | 26 | 74 | 39 | 615 | 0.662 | 0.17 | 0.53 | 0.33 | 1 | 3 | 15.77 | 24.31 | 11.50 | https://analyzingalpha.com/bearish-three-line-strike-candlestick-pattern |
| 12,185 | bearish_three_line_strike | 4 | downtrend | bearish continuation | crypto | bearish mean reversion | atr-pattern_high | 5 | 26 | 74 | 39 | 1,139 | 0.225 | 0.06 | 0.53 | 0.21 | 1 | 3 | 29.21 | 55.00 | 22.55 | https://analyzingalpha.com/bearish-three-line-strike-candlestick-pattern |
| 12,186 | bearish_three_line_strike | 4 | downtrend | bearish continuation | forex | bearish mean reversion | atr-pattern_high | 1 | 287 | 855 | 548 | 2,641 | 0.355 | 0.09 | 0.64 | 0.68 | 5 | 3 | 4.82 | 4.12 | 6.27 | https://analyzingalpha.com/bearish-three-line-strike-candlestick-pattern |
| 12,187 | bearish_three_line_strike | 4 | downtrend | bearish continuation | forex | bearish mean reversion | atr-pattern_high | 2 | 287 | 853 | 545 | 5,675 | 0.466 | 0.12 | 0.64 | 0.49 | 5 | 3 | 10.41 | 11.84 | 9.05 | https://analyzingalpha.com/bearish-three-line-strike-candlestick-pattern |
| 12,188 | bearish_three_line_strike | 4 | downtrend | bearish continuation | forex | bearish mean reversion | atr-pattern_high | 3 | 287 | 849 | 544 | 9,088 | 0.360 | 0.09 | 0.64 | 0.34 | 4 | 4 | 16.71 | 23.12 | 13.40 | https://analyzingalpha.com/bearish-three-line-strike-candlestick-pattern |
| 12,189 | bearish_three_line_strike | 4 | downtrend | bearish continuation | forex | bearish mean reversion | atr-pattern_high | 4 | 287 | 847 | 544 | 12,548 | 0.320 | 0.08 | 0.64 | 0.27 | 3 | 4 | 23.07 | 39.36 | 17.20 | https://analyzingalpha.com/bearish-three-line-strike-candlestick-pattern |
| 12,190 | bearish_three_line_strike | 4 | downtrend | bearish continuation | forex | bearish mean reversion | atr-pattern_high | 5 | 287 | 843 | 542 | 15,829 | 0.300 | 0.08 | 0.64 | 0.22 | 3 | 4 | 29.20 | 59.94 | 20.74 | https://analyzingalpha.com/bearish-three-line-strike-candlestick-pattern |
| 12,191 | bearish_three_line_strike | 4 | downtrend | bearish continuation | stock | bearish mean reversion | atr-pattern_high | 1 | 702 | 1,709 | 1,028 | 4,071 | 0.182 | 0.05 | 0.60 | 0.59 | 4 | 3 | 3.96 | 3.83 | 4.14 | https://analyzingalpha.com/bearish-three-line-strike-candlestick-pattern |
| 12,192 | bearish_three_line_strike | 4 | downtrend | bearish continuation | stock | bearish mean reversion | atr-pattern_high | 2 | 702 | 1,705 | 1,026 | 8,225 | 0.164 | 0.04 | 0.60 | 0.39 | 3 | 3 | 8.02 | 10.00 | 6.77 | https://analyzingalpha.com/bearish-three-line-strike-candlestick-pattern |
| 12,193 | bearish_three_line_strike | 4 | downtrend | bearish continuation | stock | bearish mean reversion | atr-pattern_high | 3 | 702 | 1,705 | 1,025 | 12,004 | 0.188 | 0.05 | 0.60 | 0.30 | 3 | 3 | 11.71 | 16.66 | 9.63 | https://analyzingalpha.com/bearish-three-line-strike-candlestick-pattern |
| 12,194 | bearish_three_line_strike | 4 | downtrend | bearish continuation | stock | bearish mean reversion | atr-pattern_high | 4 | 702 | 1,701 | 1,021 | 17,385 | 0.138 | 0.03 | 0.60 | 0.23 | 3 | 3 | 17.03 | 29.24 | 13.44 | https://analyzingalpha.com/bearish-three-line-strike-candlestick-pattern |
| 12,195 | bearish_three_line_strike | 4 | downtrend | bearish continuation | stock | bearish mean reversion | atr-pattern_high | 5 | 702 | 1,697 | 1,018 | 24,878 | 0.120 | 0.03 | 0.60 | 0.19 | 3 | 3 | 24.44 | 43.84 | 20.02 | https://analyzingalpha.com/bearish-three-line-strike-candlestick-pattern |
| 12,391 | bearish_three_line_strike | 4 | downtrend | bearish continuation | crypto | bullish reversal | low-close | 1 | 26 | 75 | 74 | 444 | -0.024 | -0.01 | 0.99 | 0.49 | 3 | 2 | 6.00 | 4.64 | 7.29 | https://analyzingalpha.com/bearish-three-line-strike-candlestick-pattern |
| 12,392 | bearish_three_line_strike | 4 | downtrend | bearish continuation | crypto | bullish reversal | low-close | 2 | 26 | 72 | 71 | 854 | -0.070 | -0.02 | 0.99 | 0.31 | 2 | 3 | 12.03 | 13.64 | 11.31 | https://analyzingalpha.com/bearish-three-line-strike-candlestick-pattern |
| 12,393 | bearish_three_line_strike | 4 | downtrend | bearish continuation | crypto | bullish reversal | low-close | 3 | 26 | 72 | 71 | 955 | -0.043 | -0.01 | 0.99 | 0.24 | 2 | 5 | 13.45 | 20.53 | 11.22 | https://analyzingalpha.com/bearish-three-line-strike-candlestick-pattern |
| 12,394 | bearish_three_line_strike | 4 | downtrend | bearish continuation | crypto | bullish reversal | low-close | 4 | 26 | 72 | 71 | 1,088 | 0.196 | 0.05 | 0.99 | 0.24 | 2 | 5 | 15.32 | 28.35 | 11.22 | https://analyzingalpha.com/bearish-three-line-strike-candlestick-pattern |
| 12,395 | bearish_three_line_strike | 4 | downtrend | bearish continuation | crypto | bullish reversal | low-close | 5 | 26 | 71 | 70 | 1,279 | 0.280 | 0.07 | 0.99 | 0.21 | 2 | 5 | 18.27 | 42.47 | 11.67 | https://analyzingalpha.com/bearish-three-line-strike-candlestick-pattern |
| 12,396 | bearish_three_line_strike | 4 | downtrend | bearish continuation | forex | bullish reversal | low-close | 1 | 287 | 849 | 832 | 7,134 | -0.163 | -0.04 | 0.98 | 0.42 | 4 | 5 | 8.57 | 8.46 | 8.66 | https://analyzingalpha.com/bearish-three-line-strike-candlestick-pattern |
| 12,397 | bearish_three_line_strike | 4 | downtrend | bearish continuation | forex | bullish reversal | low-close | 2 | 287 | 847 | 828 | 11,958 | -0.218 | -0.05 | 0.98 | 0.26 | 3 | 6 | 14.44 | 18.81 | 12.90 | https://analyzingalpha.com/bearish-three-line-strike-candlestick-pattern |
| 12,398 | bearish_three_line_strike | 4 | downtrend | bearish continuation | forex | bullish reversal | low-close | 3 | 287 | 845 | 826 | 17,280 | -0.215 | -0.05 | 0.98 | 0.20 | 2 | 8 | 20.92 | 30.20 | 18.67 | https://analyzingalpha.com/bearish-three-line-strike-candlestick-pattern |
| 12,399 | bearish_three_line_strike | 4 | downtrend | bearish continuation | forex | bullish reversal | low-close | 4 | 287 | 844 | 822 | 21,564 | -0.192 | -0.05 | 0.97 | 0.16 | 2 | 8 | 26.23 | 47.03 | 22.22 | https://analyzingalpha.com/bearish-three-line-strike-candlestick-pattern |
| 12,400 | bearish_three_line_strike | 4 | downtrend | bearish continuation | forex | bullish reversal | low-close | 5 | 287 | 844 | 821 | 25,114 | -0.145 | -0.04 | 0.97 | 0.14 | 2 | 8 | 30.59 | 72.56 | 23.62 | https://analyzingalpha.com/bearish-three-line-strike-candlestick-pattern |
| 12,401 | bearish_three_line_strike | 4 | downtrend | bearish continuation | stock | bullish reversal | low-close | 1 | 702 | 1,706 | 1,527 | 10,789 | 0.079 | 0.02 | 0.90 | 0.54 | 4 | 4 | 7.07 | 6.57 | 7.65 | https://analyzingalpha.com/bearish-three-line-strike-candlestick-pattern |
| 12,402 | bearish_three_line_strike | 4 | downtrend | bearish continuation | stock | bullish reversal | low-close | 2 | 702 | 1,703 | 1,522 | 21,177 | 0.110 | 0.03 | 0.89 | 0.37 | 3 | 5 | 13.91 | 16.01 | 12.69 | https://analyzingalpha.com/bearish-three-line-strike-candlestick-pattern |
| 12,403 | bearish_three_line_strike | 4 | downtrend | bearish continuation | stock | bullish reversal | low-close | 3 | 702 | 1,702 | 1,522 | 29,076 | 0.163 | 0.04 | 0.89 | 0.29 | 3 | 5 | 19.10 | 26.91 | 15.90 | https://analyzingalpha.com/bearish-three-line-strike-candlestick-pattern |
| 12,404 | bearish_three_line_strike | 4 | downtrend | bearish continuation | stock | bullish reversal | low-close | 4 | 702 | 1,701 | 1,521 | 37,470 | 0.250 | 0.06 | 0.89 | 0.25 | 3 | 5 | 24.64 | 41.47 | 19.03 | https://analyzingalpha.com/bearish-three-line-strike-candlestick-pattern |
| 12,405 | bearish_three_line_strike | 4 | downtrend | bearish continuation | stock | bullish reversal | low-close | 5 | 702 | 1,699 | 1,520 | 44,453 | 0.265 | 0.07 | 0.89 | 0.21 | 3 | 5 | 29.25 | 58.00 | 21.55 | https://analyzingalpha.com/bearish-three-line-strike-candlestick-pattern |
| 13,306 | bearish_three_line_strike | 4 | downtrend | bearish continuation | crypto | bullish mean reversion | atr-pattern_low | 1 | 26 | 76 | 14 | 73 | 0.000 | 0.00 | 0.18 | 0.50 | 3 | 1 | 5.21 | 5.14 | 5.29 | https://analyzingalpha.com/bearish-three-line-strike-candlestick-pattern |
| 13,307 | bearish_three_line_strike | 4 | downtrend | bearish continuation | crypto | bullish mean reversion | atr-pattern_low | 2 | 26 | 76 | 14 | 86 | 0.074 | 0.02 | 0.18 | 0.36 | 1 | 1 | 6.14 | 8.00 | 5.11 | https://analyzingalpha.com/bearish-three-line-strike-candlestick-pattern |
| 13,308 | bearish_three_line_strike | 4 | downtrend | bearish continuation | crypto | bullish mean reversion | atr-pattern_low | 3 | 26 | 75 | 14 | 125 | -0.148 | -0.04 | 0.19 | 0.21 | 1 | 3 | 8.93 | 13.00 | 7.82 | https://analyzingalpha.com/bearish-three-line-strike-candlestick-pattern |
| 13,309 | bearish_three_line_strike | 4 | downtrend | bearish continuation | crypto | bullish mean reversion | atr-pattern_low | 4 | 26 | 75 | 14 | 147 | 0.066 | 0.02 | 0.19 | 0.21 | 1 | 3 | 10.50 | 20.33 | 7.82 | https://analyzingalpha.com/bearish-three-line-strike-candlestick-pattern |
| 13,310 | bearish_three_line_strike | 4 | downtrend | bearish continuation | crypto | bullish mean reversion | atr-pattern_low | 5 | 26 | 75 | 14 | 148 | 0.280 | 0.07 | 0.19 | 0.21 | 1 | 3 | 10.57 | 20.67 | 7.82 | https://analyzingalpha.com/bearish-three-line-strike-candlestick-pattern |
| 13,311 | bearish_three_line_strike | 4 | downtrend | bearish continuation | forex | bullish mean reversion | atr-pattern_low | 1 | 287 | 856 | 150 | 486 | 0.183 | 0.05 | 0.18 | 0.59 | 3 | 2 | 3.24 | 3.11 | 3.43 | https://analyzingalpha.com/bearish-three-line-strike-candlestick-pattern |
| 13,312 | bearish_three_line_strike | 4 | downtrend | bearish continuation | forex | bullish mean reversion | atr-pattern_low | 2 | 287 | 856 | 150 | 1,133 | 0.236 | 0.06 | 0.18 | 0.41 | 3 | 3 | 7.55 | 8.82 | 6.66 | https://analyzingalpha.com/bearish-three-line-strike-candlestick-pattern |
| 13,313 | bearish_three_line_strike | 4 | downtrend | bearish continuation | forex | bullish mean reversion | atr-pattern_low | 3 | 287 | 856 | 150 | 1,506 | 0.280 | 0.07 | 0.18 | 0.32 | 2 | 3 | 10.04 | 13.27 | 8.52 | https://analyzingalpha.com/bearish-three-line-strike-candlestick-pattern |
| 13,314 | bearish_three_line_strike | 4 | downtrend | bearish continuation | forex | bullish mean reversion | atr-pattern_low | 4 | 287 | 856 | 149 | 1,954 | 0.308 | 0.08 | 0.17 | 0.26 | 2 | 3 | 13.11 | 17.90 | 11.42 | https://analyzingalpha.com/bearish-three-line-strike-candlestick-pattern |
| 13,315 | bearish_three_line_strike | 4 | downtrend | bearish continuation | forex | bullish mean reversion | atr-pattern_low | 5 | 287 | 856 | 149 | 2,811 | 0.325 | 0.08 | 0.17 | 0.22 | 2 | 3 | 18.87 | 28.18 | 16.22 | https://analyzingalpha.com/bearish-three-line-strike-candlestick-pattern |
| 13,316 | bearish_three_line_strike | 4 | downtrend | bearish continuation | stock | bullish mean reversion | atr-pattern_low | 1 | 702 | 1,708 | 290 | 1,176 | 0.197 | 0.05 | 0.17 | 0.60 | 3 | 2 | 4.06 | 3.68 | 4.62 | https://analyzingalpha.com/bearish-three-line-strike-candlestick-pattern |
| 13,317 | bearish_three_line_strike | 4 | downtrend | bearish continuation | stock | bullish mean reversion | atr-pattern_low | 2 | 702 | 1,706 | 290 | 2,336 | 0.286 | 0.07 | 0.17 | 0.43 | 2 | 2 | 8.06 | 10.09 | 6.54 | https://analyzingalpha.com/bearish-three-line-strike-candlestick-pattern |
| 13,318 | bearish_three_line_strike | 4 | downtrend | bearish continuation | stock | bullish mean reversion | atr-pattern_low | 3 | 702 | 1,706 | 290 | 3,445 | 0.468 | 0.12 | 0.17 | 0.37 | 2 | 2 | 11.88 | 17.30 | 8.76 | https://analyzingalpha.com/bearish-three-line-strike-candlestick-pattern |
| 13,319 | bearish_three_line_strike | 4 | downtrend | bearish continuation | stock | bullish mean reversion | atr-pattern_low | 4 | 702 | 1,706 | 290 | 4,533 | 0.488 | 0.12 | 0.17 | 0.30 | 2 | 2 | 15.63 | 25.24 | 11.58 | https://analyzingalpha.com/bearish-three-line-strike-candlestick-pattern |
| 13,320 | bearish_three_line_strike | 4 | downtrend | bearish continuation | stock | bullish mean reversion | atr-pattern_low | 5 | 702 | 1,704 | 289 | 6,056 | 0.480 | 0.12 | 0.17 | 0.25 | 2 | 2 | 20.96 | 33.72 | 16.80 | https://analyzingalpha.com/bearish-three-line-strike-candlestick-pattern |
| Market | Strategy | Setup | Trades | Edge |
Pattern:
Pattern Bars:
Required Trend:
Traditional Strategy:
Market:
Strategy:
Setup:
RR:
Tickers:
Signals:
Trades:
Trade Bars:
Edge:
Edge Per Bar:
Confirm %:
Win %:
Cons Wins:
Cons Losses:
Avg. Trade Bars:
Avg. Win Bars:
Avg. Loss Bars:
Similar Patterns
A few patterns look similar to the bearish three-line strike candle pattern. Understanding these nearly identical patterns is critical when using candlestick charting analysis.
Bullish Three-Line Strike vs. Bearish Three-Line Strike

The bullish three-line strike candlestick pattern is the opposite of the bearish three-line strike candlestick pattern.
The bullish three lines require an uptrend with three bullish staircase-like candles with a bearish engulfing candle, whereas the bearish requires a downtrend with three bearish candles followed by a bullish engulfing.
According to our backtests, both patterns are supposed to be continuation patterns, and both forecast volatility more often than a continuation.
Three Black Crows vs. Bearish Three-Line Strike
The three-black crows candlestick pattern is often confused with the bearish three-line strike. The most significant difference between the three black crows and the bearish three-line strike is that the three black crows is a reversal pattern that occurs in an uptrend. In contrast, the bearish three-line strike is a continuation pattern in a downtrend.
Additionally, the first candle is bullish in the direction of the prevailing trend, followed by three consecutive long-bodied bearish candles with tiny shadows, with each opening lower than the previous. This is somewhat opposite to the three-line strike, where the first three candles move in the bearish direction, followed by a fourth in the opposite direction.
And while they both are very different from an identification, our backtests show that both candlestick patterns likely lead to near-term volatility.
The Bottom Line
The bearish three-line strike pattern does signal a possible bearish trend continuation. Still, as with many patterns, a period of volatility occurs before the resumption or change in trend, which can be profitable to trade.
If this interests you, you might be excited to review my backtests results to find the most reliable candlestick patterns.