The three black crows is a rare four-bar bearish reversal Japanese candlestick pattern that is best traded using a bearish mean reversion strategy in the stock market, according to backtests spanning multiple decades.
Crypto and forex traders should avoid this pattern on the daily charts due to the lack of trade data producing statistically significant results.
If you’re a traditional candlestick technical analyst, you might be surprised that you’re flying in the wrong direction.
Keep reading to learn how to take your trading profits to new heights by learning the best three black crows trading strategies.
What Are Three Black Crows Candlestick Patterns?
The three black crows candlestick pattern is a rare four-bar bearish reversal pattern that’s best traded bearishly.
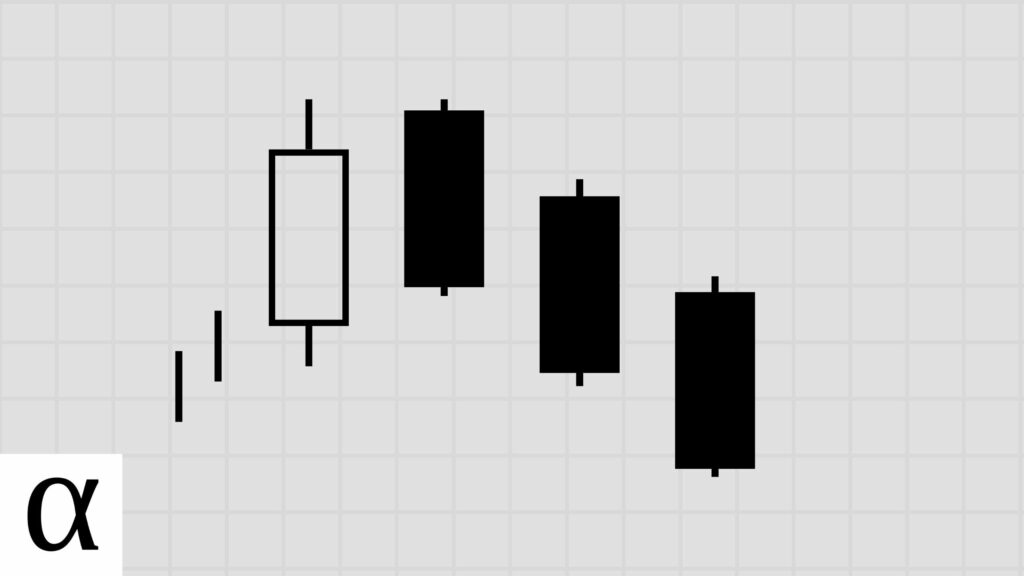
The three black crows’ name comes from the three long-bodied bearish candles representing three crows flying downward on a candlestick chart.
The pattern supposedly means there’s near-term bearish action, but history tells us that short-term volatility is more likely.
Let’s get a birds-eye-view of identifying this pattern before we learn the best black crows trading strategies.
How to Identify the Three Black Crows Pattern?

The following are the requirements for a valid three black crows pattern:
- The first candle is bullish.
- The second through fourth candles are three consecutively declining bearish candles with little to no lower wicks.
- The second candle’s close must be under the prior white candle’s high.
- The third and fourth candles must open within the prior bearish candle’s real body.
- The three black crows must occur in an uptrend.
Traders can quickly identify this four-candle pattern by looking for three bearish candles that resemble a staircase following a bullish candle. Generally, the real body of these three consecutive bearish candles is slightly longer than in recent history.
We see an example of the three black crows pattern on Target’s (TGT) daily chart occurring on December 2nd, 2019.
There’s a current uptrend as the price is significantly above the fifty-day simple moving average. We see a bullish candle followed by three consecutive long-bodied bearish candlesticks with little to no lower wicks. The last two candles open within the previous bearish candle, fulfilling the three black crow’s pattern requirements.
Now that we can see these three birds flying on our candlestick charts, let’s learn the best three black crows trading strategies.
How to Trade The Three Black Crows Pattern

We see the three black crow’s last candle is above the fifty-day moving average, which we consider a bullish trend. There’s a long-legged bullish doji followed by three bearish candles with little lower wicks consecutively closing lower, with the last two opening in the prior bearish candle’s real body, fulfilling the black crow’s candle pattern requirements.
Traditional traders enter short at the low of the final bearish candle and set a stop loss above the first bearish candle’s high.
We see traders going bear at NetApp’s (NTAP) low on December 26th, 2014, capitalizing on the downtrend. The problem is that these uninformed traders will likely lose money as they’re on the wrong side of history.
Three Black Crows Bearish Mean Reversion Trade Setup

The market was in an established uptrend as the last three black crows candlestick closed above the fifty-day moving average. We see a green candle followed by a bearish staircase with little to no lower wicks, fulfilling the three black crows’ requirements.
With the pattern identified, how do data-driven traders make their profits soar?
Traders enter the market short when the price crosses above and back below the pattern high, setting a stop loss of one ATR.
Let’s use the Avis (CAR) daily chart on July 19th, 2004, to speed up our understanding.
The pattern high occurs at $38.39. The price moved above and below this high on July 20th, producing serious profits for our data-driven trader.
Speaking of profits, what can history tell us about the best three black crows trading strategy?
Does the Three Black Crows Candlestick Pattern Work?
I backtested the three black crows candlestick pattern on the daily timeframe in the crypto, forex, and stock markets using the following rules:
- A close above the 50-day SMA constitutes an uptrend.
- I tested risk-reward ranges from 1 to 5.
- The optimal risk-reward ratio is selected using profit per bar.
- Entry and exits are discussed in the how-to trade section above.
- Confirmation must occur within three days of the pattern signal.
| Id | Pattern | Pattern Bars | Required Trend | Traditional Strategy | Market | Strategy | Setup | RR | Tickers | Signals | Trades | Trade Bars | Edge | Edge Per Bar | Confirm % | Win % | Cons Wins | Cons Losses | Avg. Trade Bars | Avg. Win Bars | Avg. Loss Bars | Details |
|---|---|---|---|---|---|---|---|---|---|---|---|---|---|---|---|---|---|---|---|---|---|---|
| 9,076 | three_black_crows | 4 | uptrend | bearish reversal | crypto | bullish continuation | low-close | 1 | 1 | 5 | 5 | 5 | -1.000 | -0.25 | 1.00 | 0.00 | 0 | 5 | 1.00 | 1.00 | https://analyzingalpha.com/three-black-crows-candlestick-pattern | |
| 9,077 | three_black_crows | 4 | uptrend | bearish reversal | crypto | bullish continuation | low-close | 2 | 1 | 5 | 5 | 5 | -1.000 | -0.25 | 1.00 | 0.00 | 0 | 5 | 1.00 | 1.00 | https://analyzingalpha.com/three-black-crows-candlestick-pattern | |
| 9,078 | three_black_crows | 4 | uptrend | bearish reversal | crypto | bullish continuation | low-close | 3 | 1 | 5 | 5 | 5 | -1.000 | -0.25 | 1.00 | 0.00 | 0 | 5 | 1.00 | 1.00 | https://analyzingalpha.com/three-black-crows-candlestick-pattern | |
| 9,079 | three_black_crows | 4 | uptrend | bearish reversal | crypto | bullish continuation | low-close | 4 | 1 | 5 | 5 | 5 | -1.000 | -0.25 | 1.00 | 0.00 | 0 | 5 | 1.00 | 1.00 | https://analyzingalpha.com/three-black-crows-candlestick-pattern | |
| 9,080 | three_black_crows | 4 | uptrend | bearish reversal | crypto | bullish continuation | low-close | 5 | 1 | 5 | 5 | 5 | -1.000 | -0.25 | 1.00 | 0.00 | 0 | 5 | 1.00 | 1.00 | https://analyzingalpha.com/three-black-crows-candlestick-pattern | |
| 9,081 | three_black_crows | 4 | uptrend | bearish reversal | stock | bullish continuation | low-close | 1 | 87 | 185 | 178 | 183 | -0.963 | -0.24 | 0.96 | 0.02 | 1 | 4 | 1.03 | 1.00 | 1.03 | https://analyzingalpha.com/three-black-crows-candlestick-pattern |
| 9,082 | three_black_crows | 4 | uptrend | bearish reversal | stock | bullish continuation | low-close | 2 | 87 | 185 | 178 | 183 | -0.946 | -0.24 | 0.96 | 0.02 | 1 | 4 | 1.03 | 1.00 | 1.03 | https://analyzingalpha.com/three-black-crows-candlestick-pattern |
| 9,083 | three_black_crows | 4 | uptrend | bearish reversal | stock | bullish continuation | low-close | 3 | 87 | 185 | 178 | 183 | -0.929 | -0.23 | 0.96 | 0.02 | 1 | 4 | 1.03 | 1.00 | 1.03 | https://analyzingalpha.com/three-black-crows-candlestick-pattern |
| 9,084 | three_black_crows | 4 | uptrend | bearish reversal | stock | bullish continuation | low-close | 4 | 87 | 185 | 178 | 183 | -0.912 | -0.23 | 0.96 | 0.02 | 1 | 4 | 1.03 | 1.00 | 1.03 | https://analyzingalpha.com/three-black-crows-candlestick-pattern |
| 9,085 | three_black_crows | 4 | uptrend | bearish reversal | stock | bullish continuation | low-close | 5 | 87 | 185 | 178 | 183 | -0.895 | -0.22 | 0.96 | 0.02 | 1 | 4 | 1.03 | 1.00 | 1.03 | https://analyzingalpha.com/three-black-crows-candlestick-pattern |
| 9,346 | three_black_crows | 4 | uptrend | bearish reversal | crypto | bearish reversal | high-close | 1 | 1 | 5 | 0 | 0 | 0.00 | 0 | 0 | https://analyzingalpha.com/three-black-crows-candlestick-pattern | ||||||
| 9,347 | three_black_crows | 4 | uptrend | bearish reversal | crypto | bearish reversal | high-close | 2 | 1 | 5 | 0 | 0 | 0.00 | 0 | 0 | https://analyzingalpha.com/three-black-crows-candlestick-pattern | ||||||
| 9,348 | three_black_crows | 4 | uptrend | bearish reversal | crypto | bearish reversal | high-close | 3 | 1 | 5 | 0 | 0 | 0.00 | 0 | 0 | https://analyzingalpha.com/three-black-crows-candlestick-pattern | ||||||
| 9,349 | three_black_crows | 4 | uptrend | bearish reversal | crypto | bearish reversal | high-close | 4 | 1 | 5 | 0 | 0 | 0.00 | 0 | 0 | https://analyzingalpha.com/three-black-crows-candlestick-pattern | ||||||
| 9,350 | three_black_crows | 4 | uptrend | bearish reversal | crypto | bearish reversal | high-close | 5 | 1 | 5 | 0 | 0 | 0.00 | 0 | 0 | https://analyzingalpha.com/three-black-crows-candlestick-pattern | ||||||
| 9,351 | three_black_crows | 4 | uptrend | bearish reversal | stock | bearish reversal | high-close | 1 | 87 | 185 | 155 | 1,660 | 0.020 | 0.01 | 0.84 | 0.51 | 3 | 3 | 10.71 | 9.77 | 11.68 | https://analyzingalpha.com/three-black-crows-candlestick-pattern |
| 9,352 | three_black_crows | 4 | uptrend | bearish reversal | stock | bearish reversal | high-close | 2 | 87 | 185 | 155 | 4,340 | 0.010 | 0.00 | 0.84 | 0.34 | 2 | 3 | 28.00 | 35.69 | 24.12 | https://analyzingalpha.com/three-black-crows-candlestick-pattern |
| 9,353 | three_black_crows | 4 | uptrend | bearish reversal | stock | bearish reversal | high-close | 3 | 87 | 185 | 154 | 5,725 | -0.068 | -0.02 | 0.83 | 0.23 | 2 | 4 | 37.18 | 72.31 | 26.46 | https://analyzingalpha.com/three-black-crows-candlestick-pattern |
| 9,354 | three_black_crows | 4 | uptrend | bearish reversal | stock | bearish reversal | high-close | 4 | 87 | 185 | 153 | 7,288 | -0.088 | -0.02 | 0.83 | 0.18 | 2 | 4 | 47.63 | 78.68 | 40.68 | https://analyzingalpha.com/three-black-crows-candlestick-pattern |
| 9,355 | three_black_crows | 4 | uptrend | bearish reversal | stock | bearish reversal | high-close | 5 | 87 | 184 | 151 | 8,931 | -0.240 | -0.06 | 0.82 | 0.13 | 2 | 4 | 59.15 | 62.58 | 58.65 | https://analyzingalpha.com/three-black-crows-candlestick-pattern |
| 10,651 | three_black_crows | 4 | uptrend | bearish reversal | crypto | bullish mean reversion | atr-pattern_low | 1 | 1 | 5 | 0 | 0 | 0.00 | 0 | 0 | https://analyzingalpha.com/three-black-crows-candlestick-pattern | ||||||
| 10,652 | three_black_crows | 4 | uptrend | bearish reversal | crypto | bullish mean reversion | atr-pattern_low | 2 | 1 | 5 | 0 | 0 | 0.00 | 0 | 0 | https://analyzingalpha.com/three-black-crows-candlestick-pattern | ||||||
| 10,653 | three_black_crows | 4 | uptrend | bearish reversal | crypto | bullish mean reversion | atr-pattern_low | 3 | 1 | 5 | 0 | 0 | 0.00 | 0 | 0 | https://analyzingalpha.com/three-black-crows-candlestick-pattern | ||||||
| 10,654 | three_black_crows | 4 | uptrend | bearish reversal | crypto | bullish mean reversion | atr-pattern_low | 4 | 1 | 5 | 0 | 0 | 0.00 | 0 | 0 | https://analyzingalpha.com/three-black-crows-candlestick-pattern | ||||||
| 10,655 | three_black_crows | 4 | uptrend | bearish reversal | crypto | bullish mean reversion | atr-pattern_low | 5 | 1 | 5 | 0 | 0 | 0.00 | 0 | 0 | https://analyzingalpha.com/three-black-crows-candlestick-pattern | ||||||
| 10,656 | three_black_crows | 4 | uptrend | bearish reversal | stock | bullish mean reversion | atr-pattern_low | 1 | 87 | 185 | 119 | 447 | 0.141 | 0.04 | 0.64 | 0.57 | 3 | 2 | 3.76 | 3.68 | 3.86 | https://analyzingalpha.com/three-black-crows-candlestick-pattern |
| 10,657 | three_black_crows | 4 | uptrend | bearish reversal | stock | bullish mean reversion | atr-pattern_low | 2 | 87 | 185 | 119 | 904 | 0.110 | 0.03 | 0.64 | 0.37 | 3 | 3 | 7.60 | 7.75 | 7.51 | https://analyzingalpha.com/three-black-crows-candlestick-pattern |
| 10,658 | three_black_crows | 4 | uptrend | bearish reversal | stock | bullish mean reversion | atr-pattern_low | 3 | 87 | 185 | 119 | 1,305 | 0.209 | 0.05 | 0.64 | 0.30 | 3 | 3 | 10.97 | 17.25 | 8.24 | https://analyzingalpha.com/three-black-crows-candlestick-pattern |
| 10,659 | three_black_crows | 4 | uptrend | bearish reversal | stock | bullish mean reversion | atr-pattern_low | 4 | 87 | 185 | 119 | 1,581 | 0.258 | 0.06 | 0.64 | 0.25 | 2 | 3 | 13.29 | 24.73 | 9.43 | https://analyzingalpha.com/three-black-crows-candlestick-pattern |
| 10,660 | three_black_crows | 4 | uptrend | bearish reversal | stock | bullish mean reversion | atr-pattern_low | 5 | 87 | 185 | 119 | 1,910 | 0.260 | 0.07 | 0.64 | 0.21 | 1 | 3 | 16.05 | 30.84 | 12.12 | https://analyzingalpha.com/three-black-crows-candlestick-pattern |
| 13,431 | three_black_crows | 4 | uptrend | bearish reversal | crypto | bearish reversal | high-low | 1 | 1 | 5 | 0 | 0 | 0.00 | 0 | 0 | https://analyzingalpha.com/three-black-crows-candlestick-pattern | ||||||
| 13,432 | three_black_crows | 4 | uptrend | bearish reversal | crypto | bearish reversal | high-low | 2 | 1 | 5 | 0 | 0 | 0.00 | 0 | 0 | https://analyzingalpha.com/three-black-crows-candlestick-pattern | ||||||
| 13,433 | three_black_crows | 4 | uptrend | bearish reversal | crypto | bearish reversal | high-low | 3 | 1 | 5 | 0 | 0 | 0.00 | 0 | 0 | https://analyzingalpha.com/three-black-crows-candlestick-pattern | ||||||
| 13,434 | three_black_crows | 4 | uptrend | bearish reversal | crypto | bearish reversal | high-low | 4 | 1 | 5 | 0 | 0 | 0.00 | 0 | 0 | https://analyzingalpha.com/three-black-crows-candlestick-pattern | ||||||
| 13,435 | three_black_crows | 4 | uptrend | bearish reversal | crypto | bearish reversal | high-low | 5 | 1 | 5 | 0 | 0 | 0.00 | 0 | 0 | https://analyzingalpha.com/three-black-crows-candlestick-pattern | ||||||
| 13,436 | three_black_crows | 4 | uptrend | bearish reversal | stock | bearish reversal | high-low | 1 | 87 | 185 | 152 | 1,690 | -0.017 | 0.00 | 0.82 | 0.49 | 2 | 3 | 11.12 | 10.25 | 11.96 | https://analyzingalpha.com/three-black-crows-candlestick-pattern |
| 13,437 | three_black_crows | 4 | uptrend | bearish reversal | stock | bearish reversal | high-low | 2 | 87 | 185 | 152 | 4,417 | -0.036 | -0.01 | 0.82 | 0.32 | 2 | 3 | 29.06 | 37.69 | 24.95 | https://analyzingalpha.com/three-black-crows-candlestick-pattern |
| 13,438 | three_black_crows | 4 | uptrend | bearish reversal | stock | bearish reversal | high-low | 3 | 87 | 185 | 151 | 5,728 | -0.046 | -0.01 | 0.82 | 0.24 | 2 | 4 | 37.93 | 72.94 | 26.97 | https://analyzingalpha.com/three-black-crows-candlestick-pattern |
| 13,439 | three_black_crows | 4 | uptrend | bearish reversal | stock | bearish reversal | high-low | 4 | 87 | 185 | 150 | 8,178 | -0.100 | -0.03 | 0.81 | 0.18 | 2 | 4 | 54.52 | 53.70 | 54.70 | https://analyzingalpha.com/three-black-crows-candlestick-pattern |
| 13,440 | three_black_crows | 4 | uptrend | bearish reversal | stock | bearish reversal | high-low | 5 | 87 | 184 | 148 | 8,925 | -0.270 | -0.07 | 0.80 | 0.12 | 2 | 4 | 60.30 | 66.06 | 59.51 | https://analyzingalpha.com/three-black-crows-candlestick-pattern |
| 13,736 | three_black_crows | 4 | uptrend | bearish reversal | crypto | bullish continuation | low-high | 1 | 1 | 5 | 5 | 5 | -1.000 | -0.25 | 1.00 | 0.00 | 0 | 5 | 1.00 | 1.00 | https://analyzingalpha.com/three-black-crows-candlestick-pattern | |
| 13,737 | three_black_crows | 4 | uptrend | bearish reversal | crypto | bullish continuation | low-high | 2 | 1 | 5 | 5 | 5 | -1.000 | -0.25 | 1.00 | 0.00 | 0 | 5 | 1.00 | 1.00 | https://analyzingalpha.com/three-black-crows-candlestick-pattern | |
| 13,738 | three_black_crows | 4 | uptrend | bearish reversal | crypto | bullish continuation | low-high | 3 | 1 | 5 | 5 | 5 | -1.000 | -0.25 | 1.00 | 0.00 | 0 | 5 | 1.00 | 1.00 | https://analyzingalpha.com/three-black-crows-candlestick-pattern | |
| 13,739 | three_black_crows | 4 | uptrend | bearish reversal | crypto | bullish continuation | low-high | 4 | 1 | 5 | 5 | 5 | -1.000 | -0.25 | 1.00 | 0.00 | 0 | 5 | 1.00 | 1.00 | https://analyzingalpha.com/three-black-crows-candlestick-pattern | |
| 13,740 | three_black_crows | 4 | uptrend | bearish reversal | crypto | bullish continuation | low-high | 5 | 1 | 5 | 5 | 5 | -1.000 | -0.25 | 1.00 | 0.00 | 0 | 5 | 1.00 | 1.00 | https://analyzingalpha.com/three-black-crows-candlestick-pattern | |
| 13,741 | three_black_crows | 4 | uptrend | bearish reversal | stock | bullish continuation | low-high | 1 | 87 | 185 | 96 | 103 | -0.918 | -0.23 | 0.52 | 0.04 | 1 | 3 | 1.07 | 1.00 | 1.08 | https://analyzingalpha.com/three-black-crows-candlestick-pattern |
| 13,742 | three_black_crows | 4 | uptrend | bearish reversal | stock | bullish continuation | low-high | 2 | 87 | 185 | 96 | 107 | -0.908 | -0.23 | 0.52 | 0.03 | 1 | 3 | 1.11 | 1.00 | 1.12 | https://analyzingalpha.com/three-black-crows-candlestick-pattern |
| 13,743 | three_black_crows | 4 | uptrend | bearish reversal | stock | bullish continuation | low-high | 3 | 87 | 185 | 96 | 121 | -0.960 | -0.24 | 0.52 | 0.01 | 1 | 3 | 1.26 | 1.00 | 1.26 | https://analyzingalpha.com/three-black-crows-candlestick-pattern |
| 13,744 | three_black_crows | 4 | uptrend | bearish reversal | stock | bullish continuation | low-high | 4 | 87 | 185 | 96 | 121 | -0.950 | -0.24 | 0.52 | 0.01 | 1 | 3 | 1.26 | 1.00 | 1.26 | https://analyzingalpha.com/three-black-crows-candlestick-pattern |
| 13,745 | three_black_crows | 4 | uptrend | bearish reversal | stock | bullish continuation | low-high | 5 | 87 | 185 | 96 | 121 | -0.940 | -0.24 | 0.52 | 0.01 | 1 | 3 | 1.26 | 1.00 | 1.26 | https://analyzingalpha.com/three-black-crows-candlestick-pattern |
| 13,876 | three_black_crows | 4 | uptrend | bearish reversal | crypto | bearish mean reversion | atr-pattern_high | 1 | 1 | 5 | 3 | 10 | 0.337 | 0.08 | 0.60 | 0.67 | 2 | 1 | 3.33 | 4.50 | 1.00 | https://analyzingalpha.com/three-black-crows-candlestick-pattern |
| 13,877 | three_black_crows | 4 | uptrend | bearish reversal | crypto | bearish mean reversion | atr-pattern_high | 2 | 1 | 5 | 3 | 20 | -1.000 | -0.25 | 0.60 | 0.00 | 0 | 3 | 6.67 | 6.67 | https://analyzingalpha.com/three-black-crows-candlestick-pattern | |
| 13,878 | three_black_crows | 4 | uptrend | bearish reversal | crypto | bearish mean reversion | atr-pattern_high | 3 | 1 | 5 | 3 | 20 | -1.000 | -0.25 | 0.60 | 0.00 | 0 | 3 | 6.67 | 6.67 | https://analyzingalpha.com/three-black-crows-candlestick-pattern | |
| 13,879 | three_black_crows | 4 | uptrend | bearish reversal | crypto | bearish mean reversion | atr-pattern_high | 4 | 1 | 5 | 3 | 20 | -1.000 | -0.25 | 0.60 | 0.00 | 0 | 3 | 6.67 | 6.67 | https://analyzingalpha.com/three-black-crows-candlestick-pattern | |
| 13,880 | three_black_crows | 4 | uptrend | bearish reversal | crypto | bearish mean reversion | atr-pattern_high | 5 | 1 | 5 | 3 | 20 | -1.000 | -0.25 | 0.60 | 0.00 | 0 | 3 | 6.67 | 6.67 | https://analyzingalpha.com/three-black-crows-candlestick-pattern | |
| 13,881 | three_black_crows | 4 | uptrend | bearish reversal | stock | bearish mean reversion | atr-pattern_high | 1 | 87 | 185 | 23 | 67 | 0.042 | 0.01 | 0.12 | 0.52 | 2 | 2 | 2.91 | 3.50 | 2.27 | https://analyzingalpha.com/three-black-crows-candlestick-pattern |
| 13,882 | three_black_crows | 4 | uptrend | bearish reversal | stock | bearish mean reversion | atr-pattern_high | 2 | 87 | 185 | 23 | 131 | 0.310 | 0.08 | 0.12 | 0.44 | 2 | 2 | 5.70 | 7.20 | 4.54 | https://analyzingalpha.com/three-black-crows-candlestick-pattern |
| 13,883 | three_black_crows | 4 | uptrend | bearish reversal | stock | bearish mean reversion | atr-pattern_high | 3 | 87 | 185 | 23 | 359 | 0.043 | 0.01 | 0.12 | 0.26 | 2 | 2 | 15.61 | 9.83 | 17.65 | https://analyzingalpha.com/three-black-crows-candlestick-pattern |
| 13,884 | three_black_crows | 4 | uptrend | bearish reversal | stock | bearish mean reversion | atr-pattern_high | 4 | 87 | 185 | 23 | 432 | -0.134 | -0.03 | 0.12 | 0.17 | 2 | 2 | 18.78 | 21.00 | 18.32 | https://analyzingalpha.com/three-black-crows-candlestick-pattern |
| 13,885 | three_black_crows | 4 | uptrend | bearish reversal | stock | bearish mean reversion | atr-pattern_high | 5 | 87 | 185 | 23 | 504 | -0.475 | -0.12 | 0.12 | 0.09 | 1 | 2 | 21.91 | 29.00 | 21.24 | https://analyzingalpha.com/three-black-crows-candlestick-pattern |
| Market | Strategy | Setup | Trades |
Pattern:
Pattern Bars:
Required Trend:
Traditional Strategy:
Market:
Strategy:
Setup:
RR:
Tickers:
Signals:
Trades:
Trade Bars:
Edge:
Edge Per Bar:
Confirm %:
Win %:
Cons Wins:
Cons Losses:
Avg. Trade Bars:
Avg. Win Bars:
Avg. Loss Bars:
Similar Candlestick Patterns
Traders confuse the three black crows with other candlestick patterns. You need to identify these patterns correctly to make your trading profits fly.
Three Identical Crows vs. Three Black Crows
The three identical crows candlestick pattern is a three-bar bearish reversal pattern almost identical to three black crows.
The difference between the identical crows and the three black crows is that the identical crows have three candles, and each candle opens at or near the last candle’s close. In contrast, the three black crows require an initial bullish candle followed by three bearish candles that open with the prior bearish candle’s real body.
Bearish Three-Line Strike vs. Three Black Crows

The bearish three-line strike pattern is a four-bar bearish continuation pattern. It’s confused with the three black crows as it’s similar in size and shape. The critical understanding is that the bearish three-line strike occurs in a downtrend while the three black crows occur in an uptrend.
The three-line strike has three stair-step bearish candles followed by a large bullish candle, whereas the three black crows has a bullish candle followed by three bearish candles.
Three White Soldiers vs. Three Black Crows Pattern

The three white soldiers candlestick pattern is a three-bar bullish reversal pattern. It has three stair-step line bullish candles that consecutively close higher with little to no upper wicks, whereas the three black crows as three successively lower closing candles with little to no lower shadows.
The only reason the three white soldiers and three black crows aren’t complete opposites is that the three black crows patterns require a bullish first candle that the three white soldiers don’t.
The Bottom Line
The three black crows pattern is a rare four-bar bullish reversal candlestick pattern that’s best traded using bearish mean reversion strategies in the stock market, according to a 21-year backtest.
Forex and crypto traders that care about statistical significance shouldn’t trade this pattern and instead select strong candlestick patterns.