The identical three crows is a rare three-bar bullish reversal Japanese candlestick pattern that is best traded using a bearish mean reversion strategy in the stock and forex markets, according to extensive backtesting.
If you’re following traditional identical three crows trading strategies, you’re likely losing money or barely breaking even.
Keep reading if you’re a candlestick technical analyst interested in looking at the data to make your portfolio profits take off using the best identical three crows trading strategies.
What Is an Identical Three Crows Candlestick Pattern?
The three identical crows candlestick pattern is a three-bar bullish reversal pattern.
The three identical crow’s name comes from the three black candles that appear to be flying in formation on a candlestick chart.
The pattern is supposed to mean that bearish action is incoming, but as we’ll soon see, the data tells us a different story.
But before we learn how to trade this three-bar pattern optimally, let’s take a gander at how to identify these three birds.
How to Identify the Identical Three Crows Candlestick Pattern

The following are the requirements for a valid identical three crows candlestick pattern:
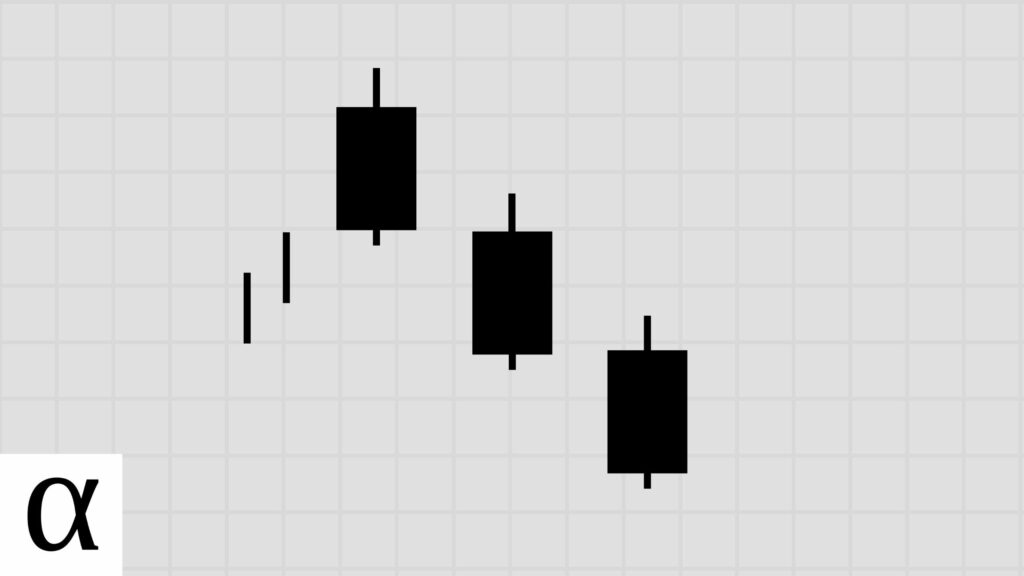
- Three consecutive bearish candlesticks with little to no lower shadow.
- The second and third candles must open at or near the prior candle’s close.
- The identical three crows must occur during an uptrend.
We see the identical three crows on the daily chart of White Mountain Insurance (WTM) on April 28th, 2021.
The price is below the fifty-day moving average, giving us a bearish trend. We see three bearish candles with short lower wicks, with the second and third candles opening near the prior candle’s close, fulfilling our identical three crows pattern requirements.
Now that we know how to identify these black birds, how do we best trade this supposed bearish reversal pattern?
How to Trade Identical Three Crows Candlestick Patterns
The identical three crows candlestick pattern should be traded using a bearish mean reversion strategy in the stock and forex markets according to history.
Crypto traders should avoid trading this pattern as there is insufficient data to determine the best identical three crows trading strategy with any statistical significance.
Let’s learn how traders typically lose money when trading this pattern, and then we’ll cover the optimal trading strategies for forex and stock traders.
Identical Three Crows Bearish Reversal Trade Setup

Let’s practice identifying the identical three crows.
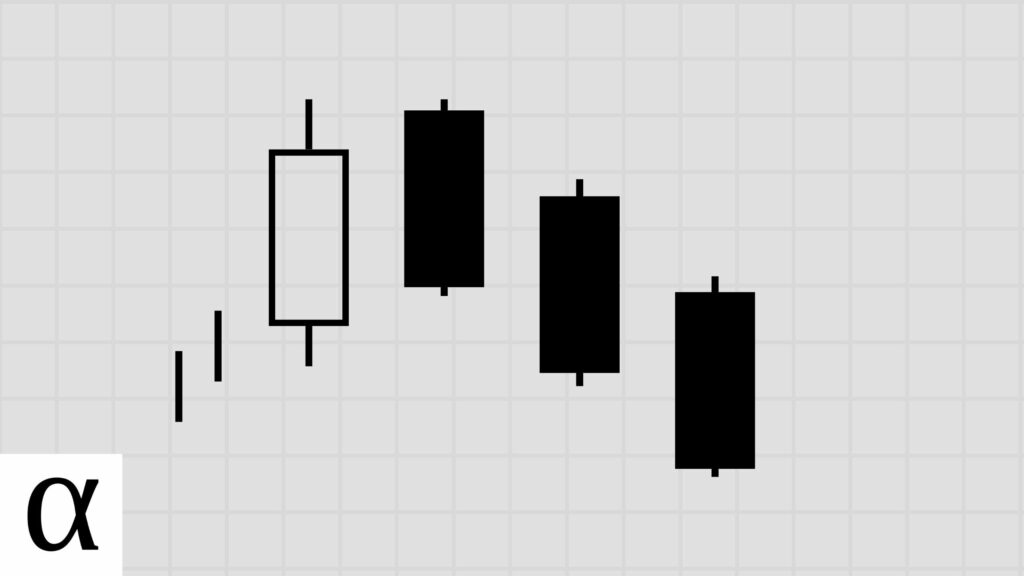
We see that the identical three crows’ last candle is above the fifty-day moving average, which we consider a bullish price trend. There are three bearish candles with little to no lower wicks, with the second and third candles opening near the prior candles’ close, fulfilling the pattern requirements.
With the identical three crows identified, traditional traders go short at a break of the third candle’s low, setting a stop loss above the first candle’s high.
We see that a trader using traditional identical three crows trading techniques on the Takung Art (TKAT) April 12th, 2021 daily chart had some nice gains, but according to data, there’s a much better way.
Identical Three Crows Bearish Mean Reversion Trade Setup

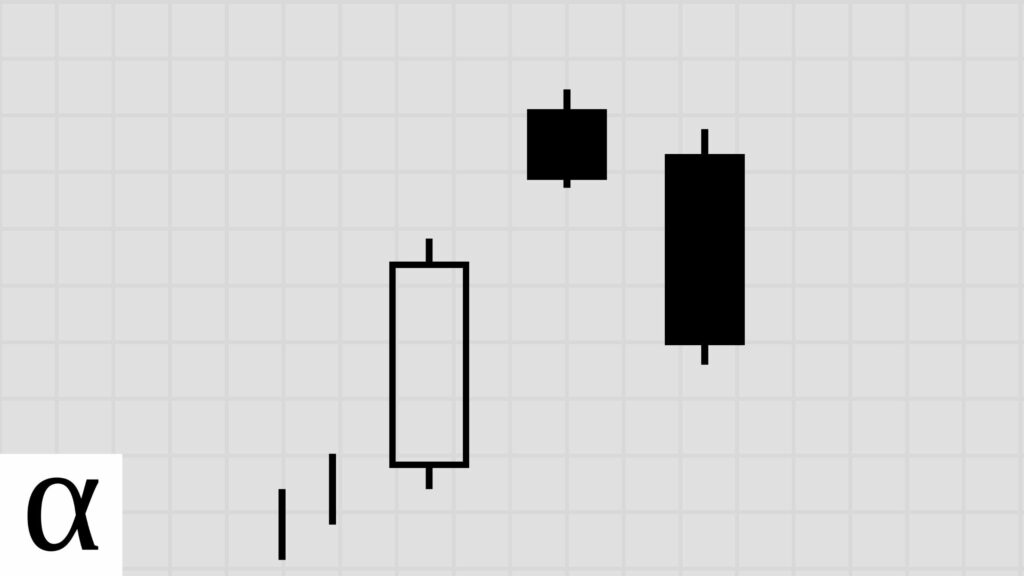
Data-driven traders bet in the same direction as traditional traders, except they have a much more favorable entry price.
These wise stock and forex traders wait for a break of the three crow’s high and then enter short when the price moves back below this high, setting a stop loss of one ATR.
Let’s use the Everest Re (RE) June 23rd, 2003, daily chart to ensure that we understand.
The pattern high occurs on the first day at $78.05. The price crosses above and back below this price two days later on June 25th, causing a short entry. These professional traders likely took significant gains the following day.
Speaking of gains, what does history tell us about the best identical three crows trading strategy?
Does the Identical Three Crows Candlestick Pattern Work? (Backtest Results)
Using the following rules, I backtested the identical three crows candlestick pattern on the daily timeframe in the crypto, forex, and stock markets.
- A close above the 50-day SMA constitutes an uptrend.
- I tested risk-reward ranges from 1 to 5.
- The optimal risk-reward ratio is selected using profit per bar.
- Entry and exits are discussed in the how-to trade section above.
- Confirmation must occur within three days of the pattern signal.
| Id | Pattern | Pattern Bars | Required Trend | Traditional Strategy | Market | Strategy | Setup | RR | Tickers | Signals | Trades | Trade Bars | Edge | Edge Per Bar | Confirm % | Win % | Cons Wins | Cons Losses | Avg. Trade Bars | Avg. Win Bars | Avg. Loss Bars | Details |
|---|---|---|---|---|---|---|---|---|---|---|---|---|---|---|---|---|---|---|---|---|---|---|
| 11,621 | identical_three_crows | 3 | uptrend | bearish reversal | crypto | bearish reversal | high-low | 1 | 75 | 201 | 142 | 2,643 | -0.123 | -0.04 | 0.71 | 0.44 | 4 | 6 | 18.61 | 12.56 | 23.30 | https://analyzingalpha.com/identical-three-crows-candlestick-pattern |
| 11,622 | identical_three_crows | 3 | uptrend | bearish reversal | crypto | bearish reversal | high-low | 2 | 75 | 199 | 138 | 4,688 | -0.170 | -0.06 | 0.69 | 0.28 | 2 | 7 | 33.97 | 25.61 | 37.15 | https://analyzingalpha.com/identical-three-crows-candlestick-pattern |
| 11,623 | identical_three_crows | 3 | uptrend | bearish reversal | crypto | bearish reversal | high-low | 3 | 75 | 190 | 131 | 7,508 | -0.326 | -0.11 | 0.69 | 0.17 | 2 | 7 | 57.31 | 19.55 | 64.94 | https://analyzingalpha.com/identical-three-crows-candlestick-pattern |
| 11,624 | identical_three_crows | 3 | uptrend | bearish reversal | crypto | bearish reversal | high-low | 4 | 75 | 190 | 128 | 8,130 | -0.380 | -0.13 | 0.67 | 0.13 | 1 | 7 | 63.52 | 37.31 | 67.26 | https://analyzingalpha.com/identical-three-crows-candlestick-pattern |
| 11,625 | identical_three_crows | 3 | uptrend | bearish reversal | crypto | bearish reversal | high-low | 5 | 75 | 188 | 126 | 8,732 | -0.385 | -0.13 | 0.67 | 0.10 | 1 | 7 | 69.30 | 73.38 | 68.83 | https://analyzingalpha.com/identical-three-crows-candlestick-pattern |
| 11,626 | identical_three_crows | 3 | uptrend | bearish reversal | forex | bearish reversal | high-low | 1 | 518 | 6,506 | 3,775 | 45,649 | 0.158 | 0.05 | 0.58 | 0.58 | 22 | 7 | 12.09 | 10.32 | 14.51 | https://analyzingalpha.com/identical-three-crows-candlestick-pattern |
| 11,627 | identical_three_crows | 3 | uptrend | bearish reversal | forex | bearish reversal | high-low | 2 | 518 | 6,293 | 3,651 | 79,933 | 0.264 | 0.09 | 0.58 | 0.42 | 19 | 9 | 21.89 | 24.12 | 20.26 | https://analyzingalpha.com/identical-three-crows-candlestick-pattern |
| 11,628 | identical_three_crows | 3 | uptrend | bearish reversal | forex | bearish reversal | high-low | 3 | 518 | 6,150 | 3,566 | 112,622 | 0.323 | 0.11 | 0.58 | 0.33 | 19 | 19 | 31.58 | 42.76 | 26.05 | https://analyzingalpha.com/identical-three-crows-candlestick-pattern |
| 11,629 | identical_three_crows | 3 | uptrend | bearish reversal | forex | bearish reversal | high-low | 4 | 518 | 5,992 | 3,463 | 138,052 | 0.362 | 0.12 | 0.58 | 0.27 | 19 | 19 | 39.86 | 57.26 | 33.33 | https://analyzingalpha.com/identical-three-crows-candlestick-pattern |
| 11,630 | identical_three_crows | 3 | uptrend | bearish reversal | forex | bearish reversal | high-low | 5 | 518 | 5,770 | 3,323 | 165,710 | 0.430 | 0.14 | 0.58 | 0.24 | 19 | 21 | 49.87 | 76.84 | 41.45 | https://analyzingalpha.com/identical-three-crows-candlestick-pattern |
| 11,631 | identical_three_crows | 3 | uptrend | bearish reversal | stock | bearish reversal | high-low | 1 | 121 | 237 | 199 | 2,674 | 0.158 | 0.05 | 0.84 | 0.58 | 3 | 3 | 13.44 | 14.13 | 12.49 | https://analyzingalpha.com/identical-three-crows-candlestick-pattern |
| 11,632 | identical_three_crows | 3 | uptrend | bearish reversal | stock | bearish reversal | high-low | 2 | 121 | 235 | 193 | 5,279 | 0.208 | 0.07 | 0.82 | 0.40 | 2 | 4 | 27.35 | 30.87 | 24.97 | https://analyzingalpha.com/identical-three-crows-candlestick-pattern |
| 11,633 | identical_three_crows | 3 | uptrend | bearish reversal | stock | bearish reversal | high-low | 3 | 121 | 235 | 191 | 7,721 | 0.154 | 0.05 | 0.81 | 0.29 | 2 | 4 | 40.42 | 48.84 | 37.02 | https://analyzingalpha.com/identical-three-crows-candlestick-pattern |
| 11,634 | identical_three_crows | 3 | uptrend | bearish reversal | stock | bearish reversal | high-low | 4 | 121 | 233 | 189 | 12,693 | 0.088 | 0.03 | 0.81 | 0.22 | 2 | 4 | 67.16 | 55.56 | 70.37 | https://analyzingalpha.com/identical-three-crows-candlestick-pattern |
| 11,635 | identical_three_crows | 3 | uptrend | bearish reversal | stock | bearish reversal | high-low | 5 | 121 | 233 | 189 | 15,177 | -0.020 | -0.01 | 0.81 | 0.16 | 1 | 4 | 80.30 | 86.58 | 79.07 | https://analyzingalpha.com/identical-three-crows-candlestick-pattern |
| 12,316 | identical_three_crows | 3 | uptrend | bearish reversal | crypto | bullish continuation | low-close | 1 | 75 | 229 | 214 | 214 | -0.976 | -0.33 | 0.93 | 0.01 | 1 | 9 | 1.00 | 1.00 | 1.00 | https://analyzingalpha.com/identical-three-crows-candlestick-pattern |
| 12,317 | identical_three_crows | 3 | uptrend | bearish reversal | crypto | bullish continuation | low-close | 2 | 75 | 229 | 214 | 214 | -0.962 | -0.32 | 0.93 | 0.01 | 1 | 9 | 1.00 | 1.00 | 1.00 | https://analyzingalpha.com/identical-three-crows-candlestick-pattern |
| 12,318 | identical_three_crows | 3 | uptrend | bearish reversal | crypto | bullish continuation | low-close | 3 | 75 | 229 | 214 | 214 | -0.948 | -0.32 | 0.93 | 0.01 | 1 | 9 | 1.00 | 1.00 | 1.00 | https://analyzingalpha.com/identical-three-crows-candlestick-pattern |
| 12,319 | identical_three_crows | 3 | uptrend | bearish reversal | crypto | bullish continuation | low-close | 4 | 75 | 229 | 214 | 214 | -0.934 | -0.31 | 0.93 | 0.01 | 1 | 9 | 1.00 | 1.00 | 1.00 | https://analyzingalpha.com/identical-three-crows-candlestick-pattern |
| 12,320 | identical_three_crows | 3 | uptrend | bearish reversal | crypto | bullish continuation | low-close | 5 | 75 | 229 | 214 | 214 | -0.920 | -0.31 | 0.93 | 0.01 | 1 | 9 | 1.00 | 1.00 | 1.00 | https://analyzingalpha.com/identical-three-crows-candlestick-pattern |
| 12,321 | identical_three_crows | 3 | uptrend | bearish reversal | forex | bullish continuation | low-close | 1 | 518 | 6,877 | 4,691 | 4,706 | -0.996 | -0.33 | 0.68 | 0.00 | 1 | 44 | 1.00 | 1.05 | 1.00 | https://analyzingalpha.com/identical-three-crows-candlestick-pattern |
| 12,322 | identical_three_crows | 3 | uptrend | bearish reversal | forex | bullish continuation | low-close | 2 | 518 | 6,877 | 4,691 | 4,706 | -0.992 | -0.33 | 0.68 | 0.00 | 1 | 44 | 1.00 | 1.05 | 1.00 | https://analyzingalpha.com/identical-three-crows-candlestick-pattern |
| 12,323 | identical_three_crows | 3 | uptrend | bearish reversal | forex | bullish continuation | low-close | 3 | 518 | 6,877 | 4,691 | 4,713 | -0.988 | -0.33 | 0.68 | 0.00 | 1 | 44 | 1.00 | 1.28 | 1.00 | https://analyzingalpha.com/identical-three-crows-candlestick-pattern |
| 12,324 | identical_three_crows | 3 | uptrend | bearish reversal | forex | bullish continuation | low-close | 4 | 518 | 6,877 | 4,691 | 4,720 | -0.984 | -0.33 | 0.68 | 0.00 | 0 | 44 | 1.01 | 1.29 | 1.01 | https://analyzingalpha.com/identical-three-crows-candlestick-pattern |
| 12,325 | identical_three_crows | 3 | uptrend | bearish reversal | forex | bullish continuation | low-close | 5 | 518 | 6,877 | 4,691 | 4,738 | -0.985 | -0.33 | 0.68 | 0.00 | 0 | 44 | 1.01 | 2.25 | 1.01 | https://analyzingalpha.com/identical-three-crows-candlestick-pattern |
| 12,326 | identical_three_crows | 3 | uptrend | bearish reversal | stock | bullish continuation | low-close | 1 | 121 | 268 | 244 | 244 | -0.978 | -0.33 | 0.91 | 0.01 | 1 | 4 | 1.00 | 1.00 | 1.00 | https://analyzingalpha.com/identical-three-crows-candlestick-pattern |
| 12,327 | identical_three_crows | 3 | uptrend | bearish reversal | stock | bullish continuation | low-close | 2 | 121 | 268 | 244 | 244 | -0.966 | -0.32 | 0.91 | 0.01 | 1 | 4 | 1.00 | 1.00 | 1.00 | https://analyzingalpha.com/identical-three-crows-candlestick-pattern |
| 12,328 | identical_three_crows | 3 | uptrend | bearish reversal | stock | bullish continuation | low-close | 3 | 121 | 268 | 244 | 244 | -0.954 | -0.32 | 0.91 | 0.01 | 1 | 4 | 1.00 | 1.00 | 1.00 | https://analyzingalpha.com/identical-three-crows-candlestick-pattern |
| 12,329 | identical_three_crows | 3 | uptrend | bearish reversal | stock | bullish continuation | low-close | 4 | 121 | 268 | 244 | 245 | -0.942 | -0.31 | 0.91 | 0.01 | 1 | 4 | 1.00 | 1.33 | 1.00 | https://analyzingalpha.com/identical-three-crows-candlestick-pattern |
| 12,330 | identical_three_crows | 3 | uptrend | bearish reversal | stock | bullish continuation | low-close | 5 | 121 | 268 | 244 | 245 | -0.930 | -0.31 | 0.91 | 0.01 | 1 | 4 | 1.00 | 1.33 | 1.00 | https://analyzingalpha.com/identical-three-crows-candlestick-pattern |
| 12,361 | identical_three_crows | 3 | uptrend | bearish reversal | crypto | bullish continuation | low-high | 1 | 75 | 201 | 111 | 120 | -0.943 | -0.31 | 0.55 | 0.03 | 1 | 4 | 1.08 | 4.00 | 1.00 | https://analyzingalpha.com/identical-three-crows-candlestick-pattern |
| 12,362 | identical_three_crows | 3 | uptrend | bearish reversal | crypto | bullish continuation | low-high | 2 | 75 | 201 | 111 | 120 | -0.916 | -0.31 | 0.55 | 0.03 | 1 | 4 | 1.08 | 4.00 | 1.00 | https://analyzingalpha.com/identical-three-crows-candlestick-pattern |
| 12,363 | identical_three_crows | 3 | uptrend | bearish reversal | crypto | bullish continuation | low-high | 3 | 75 | 201 | 111 | 124 | -0.926 | -0.31 | 0.55 | 0.02 | 1 | 4 | 1.12 | 6.50 | 1.02 | https://analyzingalpha.com/identical-three-crows-candlestick-pattern |
| 12,364 | identical_three_crows | 3 | uptrend | bearish reversal | crypto | bullish continuation | low-high | 4 | 75 | 201 | 111 | 125 | -0.908 | -0.30 | 0.55 | 0.02 | 1 | 4 | 1.13 | 7.00 | 1.02 | https://analyzingalpha.com/identical-three-crows-candlestick-pattern |
| 12,365 | identical_three_crows | 3 | uptrend | bearish reversal | crypto | bullish continuation | low-high | 5 | 75 | 201 | 111 | 126 | -0.890 | -0.30 | 0.55 | 0.02 | 1 | 4 | 1.14 | 7.50 | 1.02 | https://analyzingalpha.com/identical-three-crows-candlestick-pattern |
| 12,366 | identical_three_crows | 3 | uptrend | bearish reversal | forex | bullish continuation | low-high | 1 | 518 | 6,644 | 2,687 | 2,745 | -0.996 | -0.33 | 0.40 | 0.00 | 0 | 27 | 1.02 | 1.67 | 1.02 | https://analyzingalpha.com/identical-three-crows-candlestick-pattern |
| 12,367 | identical_three_crows | 3 | uptrend | bearish reversal | forex | bullish continuation | low-high | 2 | 518 | 6,644 | 2,687 | 2,761 | -0.994 | -0.33 | 0.40 | 0.00 | 0 | 27 | 1.03 | 2.33 | 1.02 | https://analyzingalpha.com/identical-three-crows-candlestick-pattern |
| 12,368 | identical_three_crows | 3 | uptrend | bearish reversal | forex | bullish continuation | low-high | 3 | 518 | 6,644 | 2,687 | 2,769 | -0.991 | -0.33 | 0.40 | 0.00 | 0 | 27 | 1.03 | 3.12 | 1.02 | https://analyzingalpha.com/identical-three-crows-candlestick-pattern |
| 12,369 | identical_three_crows | 3 | uptrend | bearish reversal | forex | bullish continuation | low-high | 4 | 518 | 6,643 | 2,686 | 2,806 | -0.988 | -0.33 | 0.40 | 0.00 | 0 | 27 | 1.04 | 7.29 | 1.03 | https://analyzingalpha.com/identical-three-crows-candlestick-pattern |
| 12,370 | identical_three_crows | 3 | uptrend | bearish reversal | forex | bullish continuation | low-high | 5 | 518 | 6,643 | 2,686 | 2,847 | -0.990 | -0.33 | 0.40 | 0.00 | 0 | 27 | 1.06 | 13.80 | 1.04 | https://analyzingalpha.com/identical-three-crows-candlestick-pattern |
| 12,371 | identical_three_crows | 3 | uptrend | bearish reversal | stock | bullish continuation | low-high | 1 | 121 | 241 | 125 | 125 | -0.964 | -0.32 | 0.52 | 0.02 | 1 | 4 | 1.00 | 1.00 | 1.00 | https://analyzingalpha.com/identical-three-crows-candlestick-pattern |
| 12,372 | identical_three_crows | 3 | uptrend | bearish reversal | stock | bullish continuation | low-high | 2 | 121 | 241 | 125 | 125 | -0.948 | -0.32 | 0.52 | 0.02 | 1 | 4 | 1.00 | 1.00 | 1.00 | https://analyzingalpha.com/identical-three-crows-candlestick-pattern |
| 12,373 | identical_three_crows | 3 | uptrend | bearish reversal | stock | bullish continuation | low-high | 3 | 121 | 241 | 125 | 126 | -0.966 | -0.32 | 0.52 | 0.01 | 1 | 4 | 1.01 | 1.00 | 1.01 | https://analyzingalpha.com/identical-three-crows-candlestick-pattern |
| 12,374 | identical_three_crows | 3 | uptrend | bearish reversal | stock | bullish continuation | low-high | 4 | 121 | 241 | 125 | 126 | -0.958 | -0.32 | 0.52 | 0.01 | 1 | 4 | 1.01 | 1.00 | 1.01 | https://analyzingalpha.com/identical-three-crows-candlestick-pattern |
| 12,375 | identical_three_crows | 3 | uptrend | bearish reversal | stock | bullish continuation | low-high | 5 | 121 | 241 | 125 | 127 | -1.000 | -0.33 | 0.52 | 0.00 | 0 | 4 | 1.02 | 1.02 | https://analyzingalpha.com/identical-three-crows-candlestick-pattern | |
| 12,691 | identical_three_crows | 3 | uptrend | bearish reversal | crypto | bearish reversal | high-close | 1 | 75 | 197 | 146 | 2,717 | -0.145 | -0.05 | 0.74 | 0.43 | 3 | 4 | 18.61 | 11.97 | 23.51 | https://analyzingalpha.com/identical-three-crows-candlestick-pattern |
| 12,692 | identical_three_crows | 3 | uptrend | bearish reversal | crypto | bearish reversal | high-close | 2 | 75 | 195 | 142 | 5,001 | -0.194 | -0.06 | 0.73 | 0.27 | 2 | 5 | 35.22 | 30.95 | 36.78 | https://analyzingalpha.com/identical-three-crows-candlestick-pattern |
| 12,693 | identical_three_crows | 3 | uptrend | bearish reversal | crypto | bearish reversal | high-close | 3 | 75 | 188 | 135 | 7,383 | -0.351 | -0.12 | 0.72 | 0.16 | 2 | 5 | 54.69 | 27.27 | 60.03 | https://analyzingalpha.com/identical-three-crows-candlestick-pattern |
| 12,694 | identical_three_crows | 3 | uptrend | bearish reversal | crypto | bearish reversal | high-close | 4 | 75 | 186 | 131 | 8,166 | -0.420 | -0.14 | 0.70 | 0.12 | 1 | 5 | 62.34 | 37.07 | 65.60 | https://analyzingalpha.com/identical-three-crows-candlestick-pattern |
| 12,695 | identical_three_crows | 3 | uptrend | bearish reversal | crypto | bearish reversal | high-close | 5 | 75 | 184 | 128 | 8,695 | -0.440 | -0.15 | 0.70 | 0.09 | 1 | 5 | 67.93 | 71.17 | 67.59 | https://analyzingalpha.com/identical-three-crows-candlestick-pattern |
| 12,696 | identical_three_crows | 3 | uptrend | bearish reversal | forex | bearish reversal | high-close | 1 | 518 | 6,519 | 3,849 | 46,383 | 0.145 | 0.05 | 0.59 | 0.58 | 22 | 7 | 12.05 | 10.29 | 14.43 | https://analyzingalpha.com/identical-three-crows-candlestick-pattern |
| 12,697 | identical_three_crows | 3 | uptrend | bearish reversal | forex | bearish reversal | high-close | 2 | 518 | 6,299 | 3,720 | 81,288 | 0.260 | 0.09 | 0.59 | 0.42 | 19 | 9 | 21.85 | 24.27 | 20.10 | https://analyzingalpha.com/identical-three-crows-candlestick-pattern |
| 12,698 | identical_three_crows | 3 | uptrend | bearish reversal | forex | bearish reversal | high-close | 3 | 518 | 6,157 | 3,631 | 114,087 | 0.317 | 0.11 | 0.59 | 0.33 | 19 | 19 | 31.42 | 42.45 | 26.02 | https://analyzingalpha.com/identical-three-crows-candlestick-pattern |
| 12,699 | identical_three_crows | 3 | uptrend | bearish reversal | forex | bearish reversal | high-close | 4 | 518 | 5,996 | 3,525 | 139,193 | 0.358 | 0.12 | 0.59 | 0.27 | 19 | 19 | 39.49 | 56.97 | 32.94 | https://analyzingalpha.com/identical-three-crows-candlestick-pattern |
| 12,700 | identical_three_crows | 3 | uptrend | bearish reversal | forex | bearish reversal | high-close | 5 | 518 | 5,774 | 3,384 | 167,721 | 0.420 | 0.14 | 0.59 | 0.24 | 19 | 21 | 49.56 | 76.46 | 41.24 | https://analyzingalpha.com/identical-three-crows-candlestick-pattern |
| 12,701 | identical_three_crows | 3 | uptrend | bearish reversal | stock | bearish reversal | high-close | 1 | 121 | 237 | 205 | 2,650 | 0.160 | 0.05 | 0.86 | 0.58 | 3 | 3 | 12.93 | 13.29 | 12.42 | https://analyzingalpha.com/identical-three-crows-candlestick-pattern |
| 12,702 | identical_three_crows | 3 | uptrend | bearish reversal | stock | bearish reversal | high-close | 2 | 121 | 235 | 199 | 5,196 | 0.224 | 0.07 | 0.85 | 0.41 | 2 | 4 | 26.11 | 33.12 | 21.30 | https://analyzingalpha.com/identical-three-crows-candlestick-pattern |
| 12,703 | identical_three_crows | 3 | uptrend | bearish reversal | stock | bearish reversal | high-close | 3 | 121 | 235 | 198 | 7,916 | 0.194 | 0.06 | 0.84 | 0.30 | 2 | 4 | 39.98 | 48.08 | 36.54 | https://analyzingalpha.com/identical-three-crows-candlestick-pattern |
| 12,704 | identical_three_crows | 3 | uptrend | bearish reversal | stock | bearish reversal | high-close | 4 | 121 | 233 | 195 | 12,791 | 0.080 | 0.03 | 0.84 | 0.22 | 2 | 4 | 65.59 | 53.95 | 68.79 | https://analyzingalpha.com/identical-three-crows-candlestick-pattern |
| 12,705 | identical_three_crows | 3 | uptrend | bearish reversal | stock | bearish reversal | high-close | 5 | 121 | 233 | 195 | 15,400 | -0.045 | -0.02 | 0.84 | 0.16 | 1 | 4 | 78.97 | 85.42 | 77.76 | https://analyzingalpha.com/identical-three-crows-candlestick-pattern |
| 13,761 | identical_three_crows | 3 | uptrend | bearish reversal | crypto | bearish mean reversion | atr-pattern_high | 1 | 75 | 197 | 38 | 172 | -0.159 | -0.05 | 0.19 | 0.42 | 2 | 1 | 4.53 | 3.25 | 5.45 | https://analyzingalpha.com/identical-three-crows-candlestick-pattern |
| 13,762 | identical_three_crows | 3 | uptrend | bearish reversal | crypto | bearish mean reversion | atr-pattern_high | 2 | 75 | 195 | 37 | 219 | -0.274 | -0.09 | 0.19 | 0.24 | 1 | 2 | 5.92 | 5.22 | 6.14 | https://analyzingalpha.com/identical-three-crows-candlestick-pattern |
| 13,763 | identical_three_crows | 3 | uptrend | bearish reversal | crypto | bearish mean reversion | atr-pattern_high | 3 | 75 | 194 | 36 | 270 | -0.329 | -0.11 | 0.19 | 0.17 | 1 | 3 | 7.50 | 11.50 | 6.70 | https://analyzingalpha.com/identical-three-crows-candlestick-pattern |
| 13,764 | identical_three_crows | 3 | uptrend | bearish reversal | crypto | bearish mean reversion | atr-pattern_high | 4 | 75 | 194 | 35 | 269 | -0.434 | -0.14 | 0.18 | 0.11 | 1 | 3 | 7.69 | 12.75 | 7.03 | https://analyzingalpha.com/identical-three-crows-candlestick-pattern |
| 13,765 | identical_three_crows | 3 | uptrend | bearish reversal | crypto | bearish mean reversion | atr-pattern_high | 5 | 75 | 194 | 34 | 432 | -0.825 | -0.28 | 0.18 | 0.03 | 1 | 3 | 12.71 | 11.00 | 12.76 | https://analyzingalpha.com/identical-three-crows-candlestick-pattern |
| 13,766 | identical_three_crows | 3 | uptrend | bearish reversal | forex | bearish mean reversion | atr-pattern_high | 1 | 518 | 6,566 | 596 | 1,938 | 0.276 | 0.09 | 0.09 | 0.64 | 12 | 3 | 3.25 | 3.64 | 2.58 | https://analyzingalpha.com/identical-three-crows-candlestick-pattern |
| 13,767 | identical_three_crows | 3 | uptrend | bearish reversal | forex | bearish mean reversion | atr-pattern_high | 2 | 518 | 6,485 | 573 | 7,062 | 0.382 | 0.13 | 0.09 | 0.46 | 9 | 7 | 12.32 | 15.84 | 9.32 | https://analyzingalpha.com/identical-three-crows-candlestick-pattern |
| 13,768 | identical_three_crows | 3 | uptrend | bearish reversal | forex | bearish mean reversion | atr-pattern_high | 3 | 518 | 6,461 | 562 | 10,806 | 0.345 | 0.12 | 0.09 | 0.34 | 7 | 7 | 19.23 | 30.13 | 13.75 | https://analyzingalpha.com/identical-three-crows-candlestick-pattern |
| 13,769 | identical_three_crows | 3 | uptrend | bearish reversal | forex | bearish mean reversion | atr-pattern_high | 4 | 518 | 6,443 | 555 | 14,568 | 0.396 | 0.13 | 0.09 | 0.28 | 6 | 7 | 26.25 | 46.25 | 18.50 | https://analyzingalpha.com/identical-three-crows-candlestick-pattern |
| 13,770 | identical_three_crows | 3 | uptrend | bearish reversal | forex | bearish mean reversion | atr-pattern_high | 5 | 518 | 6,425 | 548 | 16,484 | 0.465 | 0.16 | 0.09 | 0.25 | 5 | 7 | 30.08 | 57.31 | 21.27 | https://analyzingalpha.com/identical-three-crows-candlestick-pattern |
| 13,771 | identical_three_crows | 3 | uptrend | bearish reversal | stock | bearish mean reversion | atr-pattern_high | 1 | 121 | 237 | 37 | 89 | 0.299 | 0.10 | 0.16 | 0.65 | 2 | 1 | 2.41 | 2.08 | 3.00 | https://analyzingalpha.com/identical-three-crows-candlestick-pattern |
| 13,772 | identical_three_crows | 3 | uptrend | bearish reversal | stock | bearish mean reversion | atr-pattern_high | 2 | 121 | 237 | 37 | 215 | 0.294 | 0.10 | 0.16 | 0.43 | 2 | 2 | 5.81 | 5.00 | 6.43 | https://analyzingalpha.com/identical-three-crows-candlestick-pattern |
| 13,773 | identical_three_crows | 3 | uptrend | bearish reversal | stock | bearish mean reversion | atr-pattern_high | 3 | 121 | 237 | 37 | 479 | 0.615 | 0.21 | 0.16 | 0.41 | 2 | 2 | 12.95 | 19.87 | 8.23 | https://analyzingalpha.com/identical-three-crows-candlestick-pattern |
| 13,774 | identical_three_crows | 3 | uptrend | bearish reversal | stock | bearish mean reversion | atr-pattern_high | 4 | 121 | 237 | 37 | 600 | 1.020 | 0.34 | 0.16 | 0.41 | 2 | 2 | 16.22 | 27.93 | 8.23 | https://analyzingalpha.com/identical-three-crows-candlestick-pattern |
| 13,775 | identical_three_crows | 3 | uptrend | bearish reversal | stock | bearish mean reversion | atr-pattern_high | 5 | 121 | 237 | 37 | 944 | 0.940 | 0.31 | 0.16 | 0.32 | 2 | 2 | 25.51 | 49.83 | 13.84 | https://analyzingalpha.com/identical-three-crows-candlestick-pattern |
| 13,856 | identical_three_crows | 3 | uptrend | bearish reversal | crypto | bullish mean reversion | atr-pattern_low | 1 | 75 | 190 | 100 | 447 | 0.140 | 0.05 | 0.53 | 0.57 | 3 | 2 | 4.47 | 4.58 | 4.33 | https://analyzingalpha.com/identical-three-crows-candlestick-pattern |
| 13,857 | identical_three_crows | 3 | uptrend | bearish reversal | crypto | bullish mean reversion | atr-pattern_low | 2 | 75 | 190 | 98 | 887 | 0.348 | 0.12 | 0.52 | 0.45 | 3 | 2 | 9.05 | 12.27 | 6.43 | https://analyzingalpha.com/identical-three-crows-candlestick-pattern |
| 13,858 | identical_three_crows | 3 | uptrend | bearish reversal | crypto | bullish mean reversion | atr-pattern_low | 3 | 75 | 188 | 97 | 1,257 | 0.566 | 0.19 | 0.52 | 0.39 | 3 | 3 | 12.96 | 17.87 | 9.80 | https://analyzingalpha.com/identical-three-crows-candlestick-pattern |
| 13,859 | identical_three_crows | 3 | uptrend | bearish reversal | crypto | bullish mean reversion | atr-pattern_low | 4 | 75 | 186 | 96 | 1,449 | 0.766 | 0.26 | 0.52 | 0.35 | 3 | 3 | 15.09 | 20.68 | 12.03 | https://analyzingalpha.com/identical-three-crows-candlestick-pattern |
| 13,860 | identical_three_crows | 3 | uptrend | bearish reversal | crypto | bullish mean reversion | atr-pattern_low | 5 | 75 | 185 | 95 | 1,634 | 0.825 | 0.28 | 0.51 | 0.31 | 3 | 3 | 17.20 | 22.41 | 14.91 | https://analyzingalpha.com/identical-three-crows-candlestick-pattern |
| 13,861 | identical_three_crows | 3 | uptrend | bearish reversal | forex | bullish mean reversion | atr-pattern_low | 1 | 518 | 6,496 | 1,955 | 8,702 | 0.096 | 0.03 | 0.30 | 0.55 | 12 | 10 | 4.45 | 3.25 | 5.89 | https://analyzingalpha.com/identical-three-crows-candlestick-pattern |
| 13,862 | identical_three_crows | 3 | uptrend | bearish reversal | forex | bullish mean reversion | atr-pattern_low | 2 | 518 | 6,441 | 1,921 | 20,655 | 0.138 | 0.05 | 0.30 | 0.38 | 6 | 23 | 10.75 | 10.50 | 10.90 | https://analyzingalpha.com/identical-three-crows-candlestick-pattern |
| 13,863 | identical_three_crows | 3 | uptrend | bearish reversal | forex | bullish mean reversion | atr-pattern_low | 3 | 518 | 6,390 | 1,889 | 27,259 | 0.234 | 0.08 | 0.30 | 0.31 | 6 | 23 | 14.43 | 17.25 | 13.18 | https://analyzingalpha.com/identical-three-crows-candlestick-pattern |
| 13,864 | identical_three_crows | 3 | uptrend | bearish reversal | forex | bullish mean reversion | atr-pattern_low | 4 | 518 | 6,362 | 1,875 | 33,242 | 0.288 | 0.10 | 0.29 | 0.26 | 6 | 23 | 17.73 | 26.15 | 14.81 | https://analyzingalpha.com/identical-three-crows-candlestick-pattern |
| 13,865 | identical_three_crows | 3 | uptrend | bearish reversal | forex | bullish mean reversion | atr-pattern_low | 5 | 518 | 6,320 | 1,851 | 40,131 | 0.360 | 0.12 | 0.29 | 0.23 | 6 | 23 | 21.68 | 34.51 | 17.93 | https://analyzingalpha.com/identical-three-crows-candlestick-pattern |
| 13,866 | identical_three_crows | 3 | uptrend | bearish reversal | stock | bullish mean reversion | atr-pattern_low | 1 | 121 | 236 | 151 | 739 | 0.219 | 0.07 | 0.64 | 0.61 | 3 | 2 | 4.89 | 5.00 | 4.73 | https://analyzingalpha.com/identical-three-crows-candlestick-pattern |
| 13,867 | identical_three_crows | 3 | uptrend | bearish reversal | stock | bullish mean reversion | atr-pattern_low | 2 | 121 | 236 | 151 | 1,205 | 0.172 | 0.06 | 0.64 | 0.39 | 2 | 3 | 7.98 | 9.29 | 7.14 | https://analyzingalpha.com/identical-three-crows-candlestick-pattern |
| 13,868 | identical_three_crows | 3 | uptrend | bearish reversal | stock | bullish mean reversion | atr-pattern_low | 3 | 121 | 235 | 150 | 1,580 | 0.231 | 0.08 | 0.64 | 0.31 | 2 | 3 | 10.53 | 16.98 | 7.68 | https://analyzingalpha.com/identical-three-crows-candlestick-pattern |
| 13,869 | identical_three_crows | 3 | uptrend | bearish reversal | stock | bullish mean reversion | atr-pattern_low | 4 | 121 | 235 | 150 | 2,412 | 0.200 | 0.07 | 0.64 | 0.24 | 2 | 3 | 16.08 | 22.89 | 13.93 | https://analyzingalpha.com/identical-three-crows-candlestick-pattern |
| 13,870 | identical_three_crows | 3 | uptrend | bearish reversal | stock | bullish mean reversion | atr-pattern_low | 5 | 121 | 235 | 149 | 2,659 | 0.295 | 0.10 | 0.63 | 0.22 | 2 | 3 | 17.85 | 31.69 | 14.06 | https://analyzingalpha.com/identical-three-crows-candlestick-pattern |
| Market | Strategy | Setup | Trades | Edge |
Pattern:
Pattern Bars:
Required Trend:
Traditional Strategy:
Market:
Strategy:
Setup:
RR:
Tickers:
Signals:
Trades:
Trade Bars:
Edge:
Edge Per Bar:
Confirm %:
Win %:
Cons Wins:
Cons Losses:
Avg. Trade Bars:
Avg. Win Bars:
Avg. Loss Bars:
Similar Candlestick Patterns
Multiple candlestick patterns are often confused with the identical three crows pattern. You must understand how to identify each unique pattern on your candlestick charts.
Three Black Crows vs. Identical Three Crows
The three black crows candlestick pattern is a four-bar bullish reversal pattern that shares much with its black brethren. The three black crows have a white candle followed by three black candles with little to no lower wick that opens within the last candle’s real body. It’s these three candles that are often confused with each other. The critical understanding is black crows open within prior real bodies, and identical crows open at or near previous closes.
Identification differences aside, they represent incoming volatility followed by a bearish downward move.
Two Crows vs. Identical Three Crows
The two crows candlestick pattern is a three-bar bullish reversal pattern. The pattern contained a large bullish candle, followed by a bearish candle that closes higher than the prior open, with a final candle that opens within the preceding candle’s real body and closes with the first candle’s real body.
Aside from the name, these two patterns don’t share much, including optimal trading strategies.
The Bottom Line
The identical three crows is a rare three-bar bearish reversal pattern that’s best traded using bearish mean reversion trading strategies in the stock and forex markets, according to a 21-year backtest. Crypto traders should avoid this pattern due to the lack of data to form any statistically significant conclusions.
Data-driven traders should probably find more frequent bearish reversal candlestick patterns.