The two crows Japanese candlestick pattern is a rare three-bar bearish reversal pattern that’s historically best traded using bullish volatility strategies.
Data-driven forex and crypto traders should pass on the two crows pattern as there are not enough daily data to determine statistically significant trading strategies.
Traditional candlestick chartists who go bear on this pattern might be surprised that they’re on the wrong side of history.
Keep reading if you want to learn how to slice through Japanese candlesticks like a samurai and trade the two crows candlestick pattern in a data-driven, profitable way.
What Is a Two Crows Pattern?
The two crows Japanese candlestick pattern is a three-bar pattern that supposedly signals a weakening uptrend and a possible bearish reversal.
The two crows pattern gets its name from the black candles that fly above the previous white candle.
And while conventional trading methods believe these two patterns represent dark days again for the bulls, the data tells us another story. But before we get to the optimal way to fly with this pattern, let’s learn how to identify this three-candle pattern.
How to Identify The Two Crows Candlestick Pattern

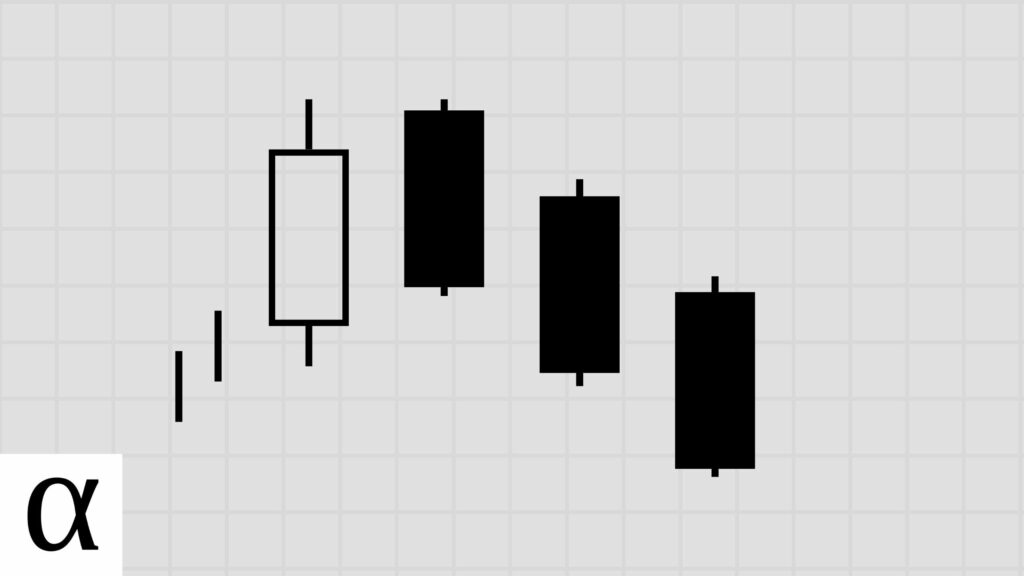
A valid two crows pattern requires the following:
- The first candle is long and bullish.
- The second is bearish closing above the previous close.
- The third candle is bearish, opens within the second candle’s real body, and closes within the first candle’s real body.
- The two crows must occur in an uptrend.
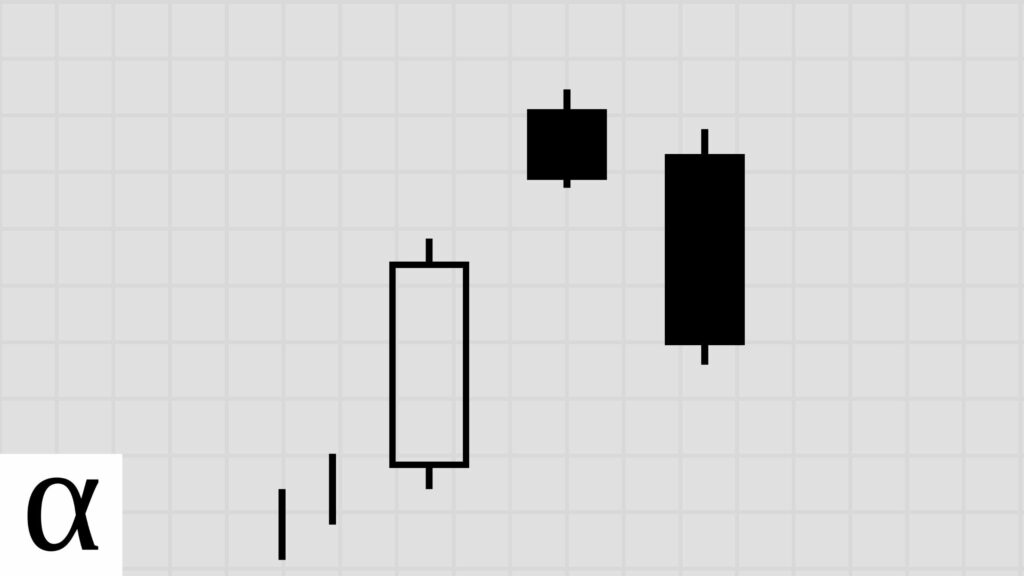
The two crows in the name refer to the two bearish candlesticks in the pattern. However, the pattern consists of another essential bullish candle. So, the two crows pattern contains three bars, as seen on the S&P Global September 10th, 2021 daily chart.
The prerequisite is that there must be an uptrend. During an uptrend, the price makes a series of higher highs and higher lows in a particular timeframe. You can also use moving averages to smooth price action to determine uptrends.
The pattern is invalid if it forms during a sideways market or a downtrend.
Additionally, the first long bullish candle should be longer than the previous candles. Discretionary traders can use an indicator such as the average daily range to help identify longer bars.
With an understanding of how to spot this rare bird, let’s learn the best two crows candlestick trading strategies.
How to Trade the Two Crows Candlestick Pattern
The two crows candlestick pattern should be traded using a bullish mean reversion trading strategy in the stock market, expecting a sizable bullish move. Forex and crypto traders who rely on data over luck should avoid this pattern.
Let’s cover how traders typically trade the two crows, and then we’ll move on to how a data-driven, informed trader does it.
Two Crows Bearish Reversal Trade Setup

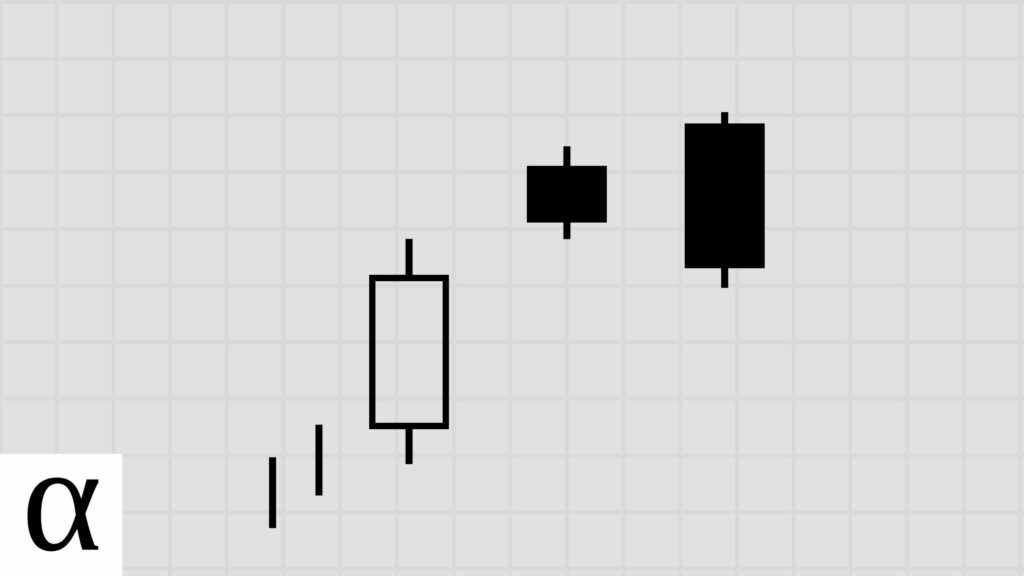
We can see a clear example of a two crows pattern in the Amazon daily chart on October 14th, 2020. Amazon’s closing price is above the 50-day moving average, which we’re using to determine the uptrend algorithmically.
The first candle is a long bullish candle that reinforces the strength of the bulls. The second is bearish and closes with a gap. The third candle opens within the second candle’s body and closes with the third candle’s real body, which completes the pattern.
With the signal set, traders now wait for the entry.
Traders conventionally trade the two crows candle pattern by entering the markets with a sell position at the third candle’s low with a stop loss above the second candle’s high.
The day after the two crows candlestick pattern formation, we see price gaps below the previous day’s low, triggering a short entry. Price does retrace higher, but it never hits the stop loss and continues lower.
This is how traders traditionally trade the two crows candle pattern, and if you’re one of them, you’re likely losing money.
Now let’s learn how to trade this pattern profitably. Are you ready for your portfolio value to soar?
Two Crows Bullish Mean Reversion Trade Setup

The Chiplote Mexican Grill (CMG) chart on September 10th, 2021, gives us a birds-eye view of this pattern again.
We see the upward momentum of the price as it rides above the fifty-day simple moving average.
The first candle is a long green candle in the direction of the trend. The second candle closes bearish and above the prior day’s close. The third candle opens within the real body of the second candle and closes within the first candle’s real body, completing the pattern.
Data-driven traders enter long when the price goes below and then back above the pattern’s low, setting a stop loss of one ATR.
The pattern low occurs on the first day at $445.58. The price moves below and back above this low on the 13th, triggering an entry. These savvy stock traders can now afford to buy a lot more burritos.
So how much money did these savvy stock traders make?
Does the Two Crows Candlestick Pattern Work? (Backtest Results)
I backtested two crows candlestick patterns on the daily timeframe in the crypto, forex, and stock markets using the following rules:
- A close above the 50-day SMA constitutes an uptrend.
- I tested risk-reward ranges from 1 to 5.
- The optimal risk-reward ratio is selected using profit per bar.
- Entry and exits are discussed in the trading section above.
- Confirmation must occur within three days of the pattern signal.
| Id | Pattern | Pattern Bars | Required Trend | Traditional Strategy | Market | Strategy | Setup | RR | Tickers | Signals | Trades | Trade Bars | Edge | Edge Per Bar | Confirm % | Win % | Cons Wins | Cons Losses | Avg. Trade Bars | Avg. Win Bars | Avg. Loss Bars | Details |
|---|---|---|---|---|---|---|---|---|---|---|---|---|---|---|---|---|---|---|---|---|---|---|
| 8,236 | two_crows | 3 | uptrend | bearish reversal | forex | bearish reversal | high-close | 1 | 4 | 8 | 8 | 20 | 0.500 | 0.17 | 1.00 | 0.75 | 2 | 1 | 2.50 | 3.00 | 1.00 | https://analyzingalpha.com/two-crows-candlestick-pattern |
| 8,237 | two_crows | 3 | uptrend | bearish reversal | forex | bearish reversal | high-close | 2 | 4 | 8 | 8 | 44 | 0.870 | 0.29 | 1.00 | 0.63 | 2 | 2 | 5.50 | 3.80 | 8.33 | https://analyzingalpha.com/two-crows-candlestick-pattern |
| 8,238 | two_crows | 3 | uptrend | bearish reversal | forex | bearish reversal | high-close | 3 | 4 | 8 | 8 | 89 | 0.505 | 0.17 | 1.00 | 0.38 | 1 | 2 | 11.12 | 7.00 | 13.60 | https://analyzingalpha.com/two-crows-candlestick-pattern |
| 8,239 | two_crows | 3 | uptrend | bearish reversal | forex | bearish reversal | high-close | 4 | 4 | 8 | 8 | 110 | -0.380 | -0.13 | 1.00 | 0.13 | 1 | 2 | 13.75 | 16.00 | 13.43 | https://analyzingalpha.com/two-crows-candlestick-pattern |
| 8,240 | two_crows | 3 | uptrend | bearish reversal | forex | bearish reversal | high-close | 5 | 4 | 8 | 8 | 130 | -0.255 | -0.09 | 1.00 | 0.13 | 1 | 2 | 16.25 | 36.00 | 13.43 | https://analyzingalpha.com/two-crows-candlestick-pattern |
| 8,241 | two_crows | 3 | uptrend | bearish reversal | stock | bearish reversal | high-close | 1 | 1,665 | 4,897 | 4,506 | 27,070 | 0.035 | 0.01 | 0.92 | 0.52 | 6 | 6 | 6.01 | 5.28 | 6.78 | https://analyzingalpha.com/two-crows-candlestick-pattern |
| 8,242 | two_crows | 3 | uptrend | bearish reversal | stock | bearish reversal | high-close | 2 | 1,665 | 4,884 | 4,490 | 53,317 | 0.014 | 0.00 | 0.92 | 0.34 | 4 | 7 | 11.87 | 14.31 | 10.64 | https://analyzingalpha.com/two-crows-candlestick-pattern |
| 8,243 | two_crows | 3 | uptrend | bearish reversal | stock | bearish reversal | high-close | 3 | 1,665 | 4,872 | 4,471 | 74,007 | -0.034 | -0.01 | 0.92 | 0.24 | 4 | 7 | 16.55 | 24.73 | 13.94 | https://analyzingalpha.com/two-crows-candlestick-pattern |
| 8,244 | two_crows | 3 | uptrend | bearish reversal | stock | bearish reversal | high-close | 4 | 1,665 | 4,855 | 4,445 | 87,684 | -0.080 | -0.03 | 0.92 | 0.19 | 3 | 8 | 19.73 | 32.84 | 16.75 | https://analyzingalpha.com/two-crows-candlestick-pattern |
| 8,245 | two_crows | 3 | uptrend | bearish reversal | stock | bearish reversal | high-close | 5 | 1,665 | 4,849 | 4,431 | 102,158 | -0.095 | -0.03 | 0.91 | 0.15 | 3 | 8 | 23.06 | 39.78 | 20.08 | https://analyzingalpha.com/two-crows-candlestick-pattern |
| 9,221 | two_crows | 3 | uptrend | bearish reversal | forex | bullish continuation | low-close | 1 | 4 | 8 | 8 | 9 | -0.500 | -0.17 | 1.00 | 0.25 | 1 | 2 | 1.12 | 1.00 | 1.17 | https://analyzingalpha.com/two-crows-candlestick-pattern |
| 9,222 | two_crows | 3 | uptrend | bearish reversal | forex | bullish continuation | low-close | 2 | 4 | 8 | 8 | 9 | -0.250 | -0.08 | 1.00 | 0.25 | 1 | 2 | 1.12 | 1.00 | 1.17 | https://analyzingalpha.com/two-crows-candlestick-pattern |
| 9,223 | two_crows | 3 | uptrend | bearish reversal | forex | bullish continuation | low-close | 3 | 4 | 8 | 8 | 18 | 0.000 | 0.00 | 1.00 | 0.25 | 1 | 2 | 2.25 | 5.50 | 1.17 | https://analyzingalpha.com/two-crows-candlestick-pattern |
| 9,224 | two_crows | 3 | uptrend | bearish reversal | forex | bullish continuation | low-close | 4 | 4 | 8 | 8 | 39 | -1.000 | -0.33 | 1.00 | 0.00 | 0 | 2 | 4.88 | 4.88 | https://analyzingalpha.com/two-crows-candlestick-pattern | |
| 9,225 | two_crows | 3 | uptrend | bearish reversal | forex | bullish continuation | low-close | 5 | 4 | 8 | 8 | 39 | -1.000 | -0.33 | 1.00 | 0.00 | 0 | 2 | 4.88 | 4.88 | https://analyzingalpha.com/two-crows-candlestick-pattern | |
| 9,226 | two_crows | 3 | uptrend | bearish reversal | stock | bullish continuation | low-close | 1 | 1,665 | 4,912 | 4,593 | 5,294 | -0.716 | -0.24 | 0.94 | 0.14 | 2 | 8 | 1.15 | 1.42 | 1.11 | https://analyzingalpha.com/two-crows-candlestick-pattern |
| 9,227 | two_crows | 3 | uptrend | bearish reversal | stock | bullish continuation | low-close | 2 | 1,665 | 4,911 | 4,592 | 5,949 | -0.640 | -0.21 | 0.94 | 0.12 | 2 | 9 | 1.30 | 2.12 | 1.18 | https://analyzingalpha.com/two-crows-candlestick-pattern |
| 9,228 | two_crows | 3 | uptrend | bearish reversal | stock | bullish continuation | low-close | 3 | 1,665 | 4,910 | 4,591 | 6,570 | -0.585 | -0.20 | 0.94 | 0.11 | 2 | 10 | 1.43 | 2.99 | 1.25 | https://analyzingalpha.com/two-crows-candlestick-pattern |
| 9,229 | two_crows | 3 | uptrend | bearish reversal | stock | bullish continuation | low-close | 4 | 1,665 | 4,910 | 4,591 | 7,162 | -0.538 | -0.18 | 0.94 | 0.09 | 2 | 10 | 1.56 | 3.88 | 1.32 | https://analyzingalpha.com/two-crows-candlestick-pattern |
| 9,230 | two_crows | 3 | uptrend | bearish reversal | stock | bullish continuation | low-close | 5 | 1,665 | 4,910 | 4,591 | 7,985 | -0.495 | -0.17 | 0.94 | 0.09 | 2 | 10 | 1.74 | 5.89 | 1.35 | https://analyzingalpha.com/two-crows-candlestick-pattern |
| 9,876 | two_crows | 3 | uptrend | bearish reversal | forex | bullish continuation | low-high | 1 | 4 | 8 | 4 | 23 | -0.500 | -0.17 | 0.50 | 0.25 | 0 | 1 | 5.75 | 1.00 | 7.33 | https://analyzingalpha.com/two-crows-candlestick-pattern |
| 9,877 | two_crows | 3 | uptrend | bearish reversal | forex | bullish continuation | low-high | 2 | 4 | 8 | 4 | 35 | -1.000 | -0.33 | 0.50 | 0.00 | 0 | 2 | 8.75 | 8.75 | https://analyzingalpha.com/two-crows-candlestick-pattern | |
| 9,878 | two_crows | 3 | uptrend | bearish reversal | forex | bullish continuation | low-high | 3 | 4 | 8 | 4 | 35 | -1.000 | -0.33 | 0.50 | 0.00 | 0 | 2 | 8.75 | 8.75 | https://analyzingalpha.com/two-crows-candlestick-pattern | |
| 9,879 | two_crows | 3 | uptrend | bearish reversal | forex | bullish continuation | low-high | 4 | 4 | 8 | 4 | 35 | -1.000 | -0.33 | 0.50 | 0.00 | 0 | 2 | 8.75 | 8.75 | https://analyzingalpha.com/two-crows-candlestick-pattern | |
| 9,880 | two_crows | 3 | uptrend | bearish reversal | forex | bullish continuation | low-high | 5 | 4 | 8 | 4 | 35 | -1.000 | -0.33 | 0.50 | 0.00 | 0 | 2 | 8.75 | 8.75 | https://analyzingalpha.com/two-crows-candlestick-pattern | |
| 9,881 | two_crows | 3 | uptrend | bearish reversal | stock | bullish continuation | low-high | 1 | 1,665 | 4,910 | 2,418 | 4,328 | -0.485 | -0.16 | 0.49 | 0.26 | 4 | 7 | 1.79 | 2.56 | 1.53 | https://analyzingalpha.com/two-crows-candlestick-pattern |
| 9,882 | two_crows | 3 | uptrend | bearish reversal | stock | bullish continuation | low-high | 2 | 1,665 | 4,907 | 2,415 | 6,439 | -0.430 | -0.14 | 0.49 | 0.19 | 2 | 7 | 2.67 | 5.77 | 1.94 | https://analyzingalpha.com/two-crows-candlestick-pattern |
| 9,883 | two_crows | 3 | uptrend | bearish reversal | stock | bullish continuation | low-high | 3 | 1,665 | 4,906 | 2,414 | 8,043 | -0.406 | -0.14 | 0.49 | 0.15 | 2 | 7 | 3.33 | 8.65 | 2.41 | https://analyzingalpha.com/two-crows-candlestick-pattern |
| 9,884 | two_crows | 3 | uptrend | bearish reversal | stock | bullish continuation | low-high | 4 | 1,665 | 4,905 | 2,412 | 9,672 | -0.380 | -0.13 | 0.49 | 0.13 | 2 | 7 | 4.01 | 12.18 | 2.84 | https://analyzingalpha.com/two-crows-candlestick-pattern |
| 9,885 | two_crows | 3 | uptrend | bearish reversal | stock | bullish continuation | low-high | 5 | 1,665 | 4,903 | 2,411 | 11,453 | -0.340 | -0.11 | 0.49 | 0.11 | 2 | 7 | 4.75 | 17.05 | 3.23 | https://analyzingalpha.com/two-crows-candlestick-pattern |
| 11,886 | two_crows | 3 | uptrend | bearish reversal | forex | bearish mean reversion | atr-pattern_high | 1 | 4 | 8 | 2 | 20 | 0.000 | 0.00 | 0.25 | 0.50 | 1 | 1 | 10.00 | 19.00 | 1.00 | https://analyzingalpha.com/two-crows-candlestick-pattern |
| 11,887 | two_crows | 3 | uptrend | bearish reversal | forex | bearish mean reversion | atr-pattern_high | 2 | 4 | 8 | 2 | 23 | 0.500 | 0.17 | 0.25 | 0.50 | 1 | 1 | 11.50 | 22.00 | 1.00 | https://analyzingalpha.com/two-crows-candlestick-pattern |
| 11,888 | two_crows | 3 | uptrend | bearish reversal | forex | bearish mean reversion | atr-pattern_high | 3 | 4 | 8 | 2 | 63 | 1.000 | 0.33 | 0.25 | 0.50 | 1 | 1 | 31.50 | 62.00 | 1.00 | https://analyzingalpha.com/two-crows-candlestick-pattern |
| 11,889 | two_crows | 3 | uptrend | bearish reversal | forex | bearish mean reversion | atr-pattern_high | 4 | 4 | 8 | 2 | 64 | 1.500 | 0.50 | 0.25 | 0.50 | 1 | 1 | 32.00 | 63.00 | 1.00 | https://analyzingalpha.com/two-crows-candlestick-pattern |
| 11,890 | two_crows | 3 | uptrend | bearish reversal | forex | bearish mean reversion | atr-pattern_high | 5 | 4 | 8 | 2 | 85 | 2.000 | 0.67 | 0.25 | 0.50 | 1 | 1 | 42.50 | 84.00 | 1.00 | https://analyzingalpha.com/two-crows-candlestick-pattern |
| 11,891 | two_crows | 3 | uptrend | bearish reversal | stock | bearish mean reversion | atr-pattern_high | 1 | 1,665 | 4,909 | 1,435 | 5,111 | 0.143 | 0.05 | 0.29 | 0.57 | 3 | 3 | 3.56 | 3.36 | 3.83 | https://analyzingalpha.com/two-crows-candlestick-pattern |
| 11,892 | two_crows | 3 | uptrend | bearish reversal | stock | bearish mean reversion | atr-pattern_high | 2 | 1,665 | 4,904 | 1,434 | 9,522 | 0.162 | 0.05 | 0.29 | 0.39 | 3 | 4 | 6.64 | 7.51 | 6.10 | https://analyzingalpha.com/two-crows-candlestick-pattern |
| 11,893 | two_crows | 3 | uptrend | bearish reversal | stock | bearish mean reversion | atr-pattern_high | 3 | 1,665 | 4,902 | 1,433 | 13,596 | 0.154 | 0.05 | 0.29 | 0.29 | 3 | 4 | 9.49 | 13.00 | 8.07 | https://analyzingalpha.com/two-crows-candlestick-pattern |
| 11,894 | two_crows | 3 | uptrend | bearish reversal | stock | bearish mean reversion | atr-pattern_high | 4 | 1,665 | 4,899 | 1,429 | 17,551 | 0.084 | 0.03 | 0.29 | 0.22 | 3 | 4 | 12.28 | 18.96 | 10.44 | https://analyzingalpha.com/two-crows-candlestick-pattern |
| 11,895 | two_crows | 3 | uptrend | bearish reversal | stock | bearish mean reversion | atr-pattern_high | 5 | 1,665 | 4,899 | 1,427 | 22,168 | 0.020 | 0.01 | 0.29 | 0.17 | 3 | 4 | 15.53 | 28.90 | 12.81 | https://analyzingalpha.com/two-crows-candlestick-pattern |
| 12,331 | two_crows | 3 | uptrend | bearish reversal | forex | bullish mean reversion | atr-pattern_low | 1 | 4 | 8 | 3 | 11 | 0.337 | 0.11 | 0.38 | 0.67 | 2 | 1 | 3.67 | 4.50 | 2.00 | https://analyzingalpha.com/two-crows-candlestick-pattern |
| 12,332 | two_crows | 3 | uptrend | bearish reversal | forex | bullish mean reversion | atr-pattern_low | 2 | 4 | 8 | 3 | 28 | -1.000 | -0.33 | 0.38 | 0.00 | 0 | 2 | 9.33 | 9.33 | https://analyzingalpha.com/two-crows-candlestick-pattern | |
| 12,333 | two_crows | 3 | uptrend | bearish reversal | forex | bullish mean reversion | atr-pattern_low | 3 | 4 | 8 | 3 | 28 | -1.000 | -0.33 | 0.38 | 0.00 | 0 | 2 | 9.33 | 9.33 | https://analyzingalpha.com/two-crows-candlestick-pattern | |
| 12,334 | two_crows | 3 | uptrend | bearish reversal | forex | bullish mean reversion | atr-pattern_low | 4 | 4 | 8 | 3 | 28 | -1.000 | -0.33 | 0.38 | 0.00 | 0 | 2 | 9.33 | 9.33 | https://analyzingalpha.com/two-crows-candlestick-pattern | |
| 12,335 | two_crows | 3 | uptrend | bearish reversal | forex | bullish mean reversion | atr-pattern_low | 5 | 4 | 8 | 3 | 28 | -1.000 | -0.33 | 0.38 | 0.00 | 0 | 2 | 9.33 | 9.33 | https://analyzingalpha.com/two-crows-candlestick-pattern | |
| 12,336 | two_crows | 3 | uptrend | bearish reversal | stock | bullish mean reversion | atr-pattern_low | 1 | 1,665 | 4,910 | 2,001 | 8,104 | 0.157 | 0.05 | 0.41 | 0.58 | 5 | 4 | 4.05 | 3.77 | 4.43 | https://analyzingalpha.com/two-crows-candlestick-pattern |
| 12,337 | two_crows | 3 | uptrend | bearish reversal | stock | bullish mean reversion | atr-pattern_low | 2 | 1,665 | 4,902 | 1,997 | 14,882 | 0.190 | 0.06 | 0.41 | 0.40 | 3 | 5 | 7.45 | 8.51 | 6.76 | https://analyzingalpha.com/two-crows-candlestick-pattern |
| 12,338 | two_crows | 3 | uptrend | bearish reversal | stock | bullish mean reversion | atr-pattern_low | 3 | 1,665 | 4,894 | 1,993 | 20,464 | 0.234 | 0.08 | 0.41 | 0.31 | 3 | 5 | 10.27 | 14.02 | 8.60 | https://analyzingalpha.com/two-crows-candlestick-pattern |
| 12,339 | two_crows | 3 | uptrend | bearish reversal | stock | bullish mean reversion | atr-pattern_low | 4 | 1,665 | 4,886 | 1,990 | 25,475 | 0.284 | 0.09 | 0.41 | 0.26 | 2 | 5 | 12.80 | 21.35 | 9.86 | https://analyzingalpha.com/two-crows-candlestick-pattern |
| 12,340 | two_crows | 3 | uptrend | bearish reversal | stock | bullish mean reversion | atr-pattern_low | 5 | 1,665 | 4,884 | 1,987 | 30,456 | 0.335 | 0.11 | 0.41 | 0.22 | 2 | 5 | 15.33 | 28.09 | 11.67 | https://analyzingalpha.com/two-crows-candlestick-pattern |
| 12,916 | two_crows | 3 | uptrend | bearish reversal | forex | bearish reversal | high-low | 1 | 4 | 8 | 6 | 48 | 0.663 | 0.22 | 0.75 | 0.83 | 2 | 0 | 8.00 | 8.80 | 4.00 | https://analyzingalpha.com/two-crows-candlestick-pattern |
| 12,917 | two_crows | 3 | uptrend | bearish reversal | forex | bearish reversal | high-low | 2 | 4 | 8 | 6 | 110 | -0.004 | 0.00 | 0.75 | 0.33 | 1 | 2 | 18.33 | 20.00 | 17.50 | https://analyzingalpha.com/two-crows-candlestick-pattern |
| 12,918 | two_crows | 3 | uptrend | bearish reversal | forex | bearish reversal | high-low | 3 | 4 | 8 | 6 | 141 | -1.000 | -0.33 | 0.75 | 0.00 | 0 | 2 | 23.50 | 23.50 | https://analyzingalpha.com/two-crows-candlestick-pattern | |
| 12,919 | two_crows | 3 | uptrend | bearish reversal | forex | bearish reversal | high-low | 4 | 4 | 8 | 6 | 141 | -1.000 | -0.33 | 0.75 | 0.00 | 0 | 2 | 23.50 | 23.50 | https://analyzingalpha.com/two-crows-candlestick-pattern | |
| 12,920 | two_crows | 3 | uptrend | bearish reversal | forex | bearish reversal | high-low | 5 | 4 | 8 | 6 | 141 | -1.000 | -0.33 | 0.75 | 0.00 | 0 | 2 | 23.50 | 23.50 | https://analyzingalpha.com/two-crows-candlestick-pattern | |
| 12,921 | two_crows | 3 | uptrend | bearish reversal | stock | bearish reversal | high-low | 1 | 1,665 | 4,894 | 3,834 | 29,720 | -0.017 | -0.01 | 0.78 | 0.49 | 6 | 4 | 7.75 | 7.04 | 8.45 | https://analyzingalpha.com/two-crows-candlestick-pattern |
| 12,922 | two_crows | 3 | uptrend | bearish reversal | stock | bearish reversal | high-low | 2 | 1,665 | 4,878 | 3,814 | 58,643 | -0.062 | -0.02 | 0.78 | 0.31 | 4 | 6 | 15.38 | 18.85 | 13.79 | https://analyzingalpha.com/two-crows-candlestick-pattern |
| 12,923 | two_crows | 3 | uptrend | bearish reversal | stock | bearish reversal | high-low | 3 | 1,665 | 4,865 | 3,795 | 81,799 | -0.111 | -0.04 | 0.78 | 0.22 | 4 | 6 | 21.55 | 31.59 | 18.67 | https://analyzingalpha.com/two-crows-candlestick-pattern |
| 12,924 | two_crows | 3 | uptrend | bearish reversal | stock | bearish reversal | high-low | 4 | 1,665 | 4,851 | 3,771 | 95,353 | -0.158 | -0.05 | 0.78 | 0.17 | 4 | 8 | 25.29 | 42.36 | 21.84 | https://analyzingalpha.com/two-crows-candlestick-pattern |
| 12,925 | two_crows | 3 | uptrend | bearish reversal | stock | bearish reversal | high-low | 5 | 1,665 | 4,844 | 3,756 | 117,459 | -0.200 | -0.07 | 0.78 | 0.13 | 4 | 8 | 31.27 | 60.55 | 26.72 | https://analyzingalpha.com/two-crows-candlestick-pattern |
| Market | Strategy | Setup | Trades |
Pattern:
Pattern Bars:
Required Trend:
Traditional Strategy:
Market:
Strategy:
Setup:
RR:
Tickers:
Signals:
Trades:
Trade Bars:
Edge:
Edge Per Bar:
Confirm %:
Win %:
Cons Wins:
Cons Losses:
Avg. Trade Bars:
Avg. Win Bars:
Avg. Loss Bars:
Similar Japanese Candlestick Patterns
Traders confuse the two crows pattern with other candlestick patterns.
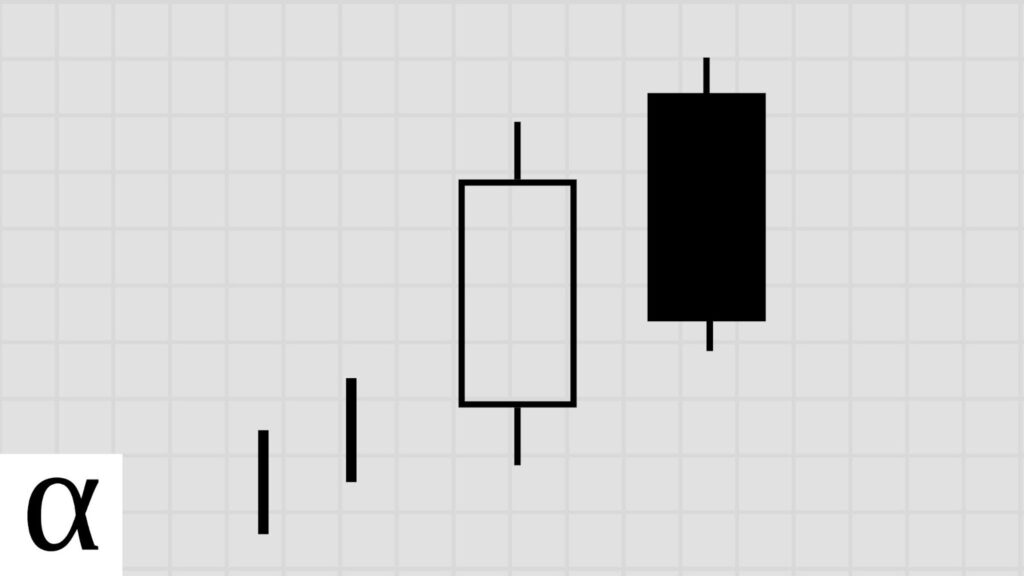
Upside Gap Two Crows vs. Two Crows
The upside gap two crows candlestick pattern is nearly identical to its bird-like brother. The two crows and upside gap two crows candle patterns are three candle bearish reversal patterns. The first two candles of both patterns are similar. But the difference lies in the third candle.
In the two crows pattern, the third candle opens within the second candle’s real body and closes within the first candle’s body. In the upside gap two crows pattern, the third candle’s real body engulfs the second candle and closes above the first candle’s close.
Three Black Crows vs. Two Crows
Three black crows candlestick pattern and the two crows are bearish reversal candlestick patterns consisting of three candles. While the two crows pattern consists of one bullish candle and two bearish candles, the three black crows patterns consist of one bullish candle and three bearish candles of similar length.
Dark Cloud Cover Vs. Two Crows
The dark cloud cover candlestick pattern and the two crows are bearish reversal patterns. But the dark cloud cover consists of 2 candles, and the two crows contain three candles. And the arrangement of the candles differs in both patterns.
The Bottom Line
The two crows candlestick doesn’t work as advertised.
While misinformed traders think the two crows pattern identifies a shift in buyer’s momentum, more informed traders understand that this pattern is likely a temporary pullback in the longer-term trend.
And while the pattern does provide profits in the stock market when traded as a continuation pattern, why not focus on only the most profitable candlestick patterns?