The upside gap two crows is a rare three-bar bearish reversal Japanese candlestick pattern that suggests near-term bullish volatility is ahead.
Crypto and forex traders relying on history instead of luck should avoid the upside gap two crows and the similar two crows pattern due to insufficient daily data to determine statistically significant trading strategies.
The data shows that traditional upside gap two-crows trading methods don’t even break even.
The good news is that this article will teach you to fly with this elusive three-bar pattern.
What Is an Upside Gap Two Crows Candlestick Pattern?
The upside gap two crows is a rare three-candle bullish reversal that’s best traded in the other direction.
The upside gap two crows pattern’s name comes from the two dark candles resembling crows on a candlestick chart.
Before we learn how to go against the grain and make money, let’s get a birds-eye view of the upside gap two crows.
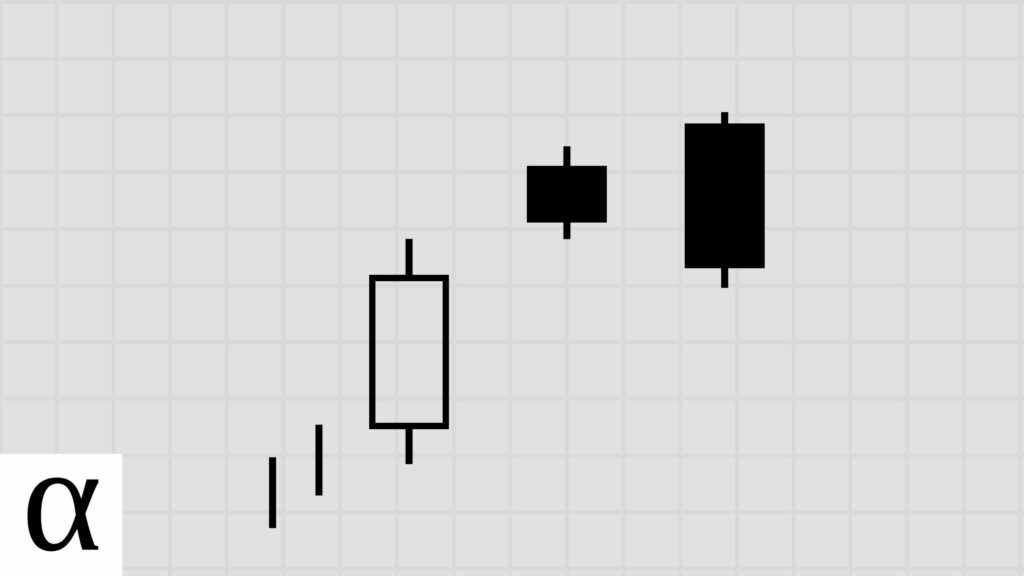
How to Identify the Upside Gap Two Crows Candlestick Pattern
A valid upside gap two crows candlestick pattern requires the following:
- The first candle is bullish.
- The second candle must be bearish with a small real body and closes higher than the first, creating a gap.
- The third candle must be bearish and engulf the second candle’s real body while closing above the first candle’s close.
- The upside gap two crows must occur during an uptrend.
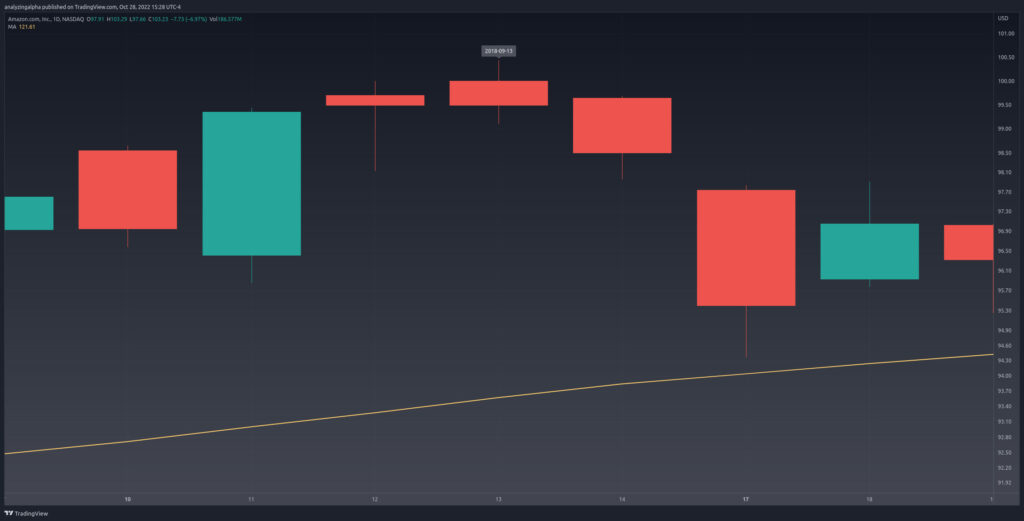
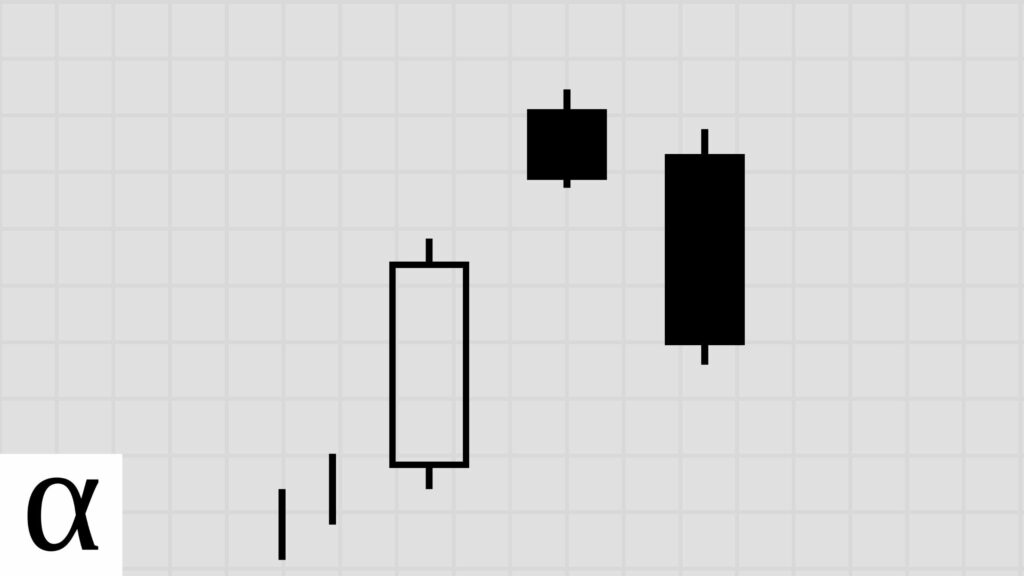
Amazon’s daily chart on September 13th, 2018, delivers traders the upside gap two crows on a silver platter.
The pattern is well above the fifty-day simple moving average, which we’re using as a proxy for a short-term bull market. There’s a large bullish green candle, a small-bodied candle that gaps up and closes above the first candle’s close, and a third bearish candle that engulfs the second candle and closes above the first candle’s close, fulfilling the up gap two crows pattern requirements.
Now that we can spot these two crows, let’s learn how to take our portfolio’s profits to new heights with the best upside gap two crows trading strategy.
How to Trade the Upside Gap Two Crows Pattern
The data shows that the best upside gap two crows stock trading strategy is a bullish mean reversion strategy expecting a significant risk-reward trade.
Before we take flight and learn the best upside gaps two crows trading strategy, let’s know how most traders crash when trading these birds on their candlestick charts.
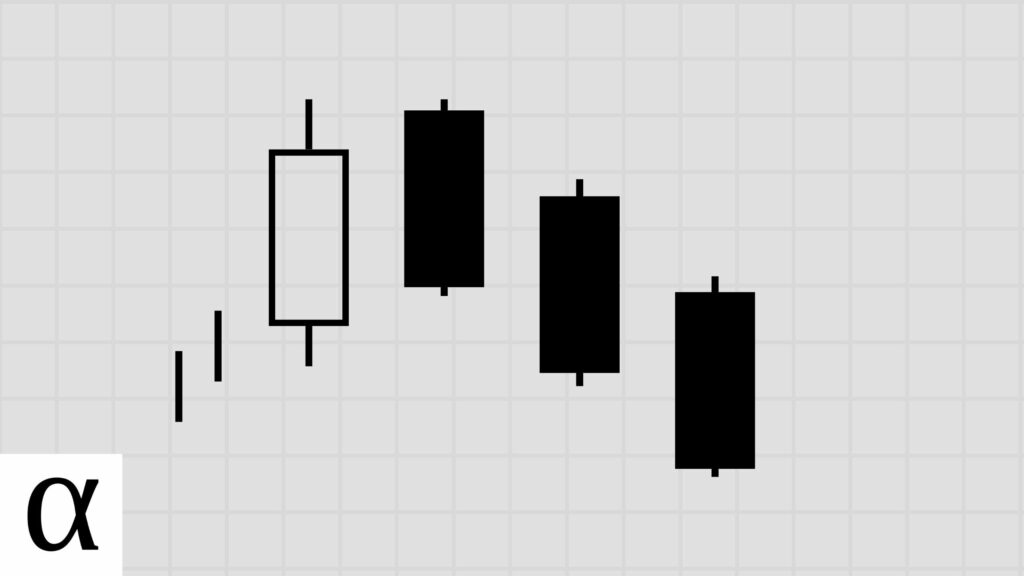
Upside Gap Two Crows Bearish Reversal Trade Setup
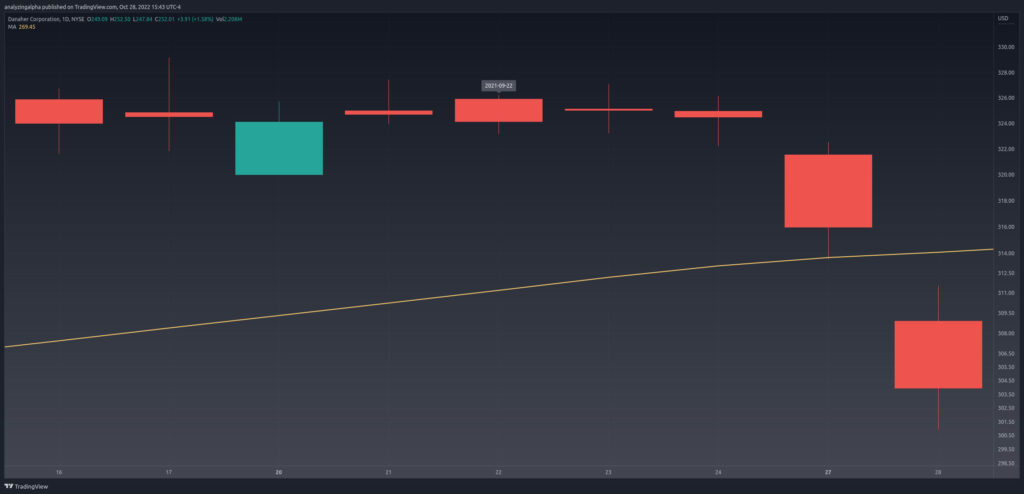
The price is in a bullish uptrend as it’s hovering above the fifty-day SMA. There’s a bullish candle, a small-bodied bearish candle closing above the first candle’s close, and a third candle closing above the third candle’s close while engulfing the second candle’s real body.
You don’t need to be versed in the Danaher Business System to clearly see the upside gap two crows on the September 22nd, 2021, daily chart.
With the three-candle pattern identified, most Japanese candlestick charting techniques recommend entering short when the price moves below the third candle’s low and setting a stop loss above the third candle’s high.
The problem is that these traditional traders are flying in the wrong direction.
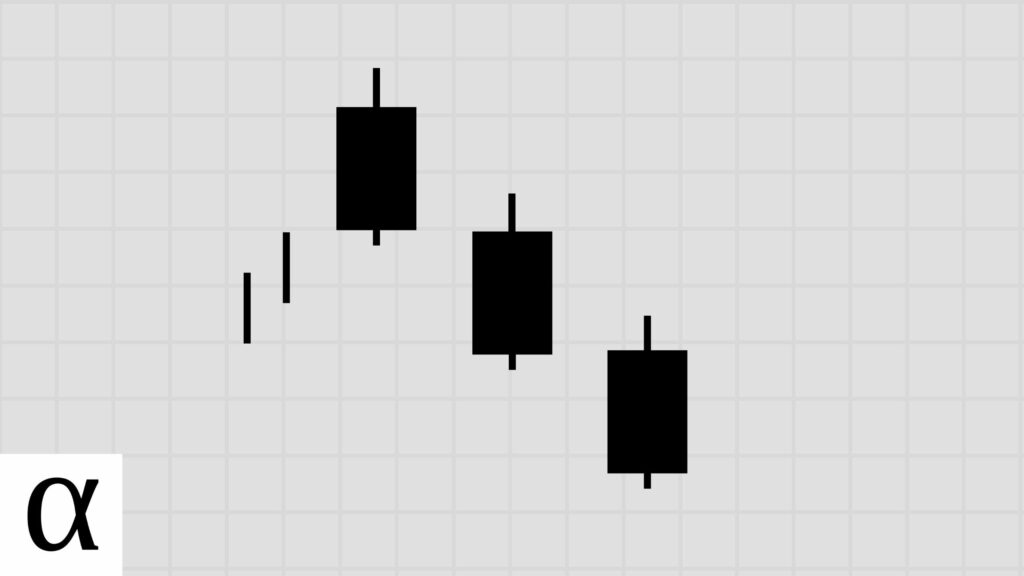
Upside Gap Two Crows Bullish Mean Reversion Trade Setup
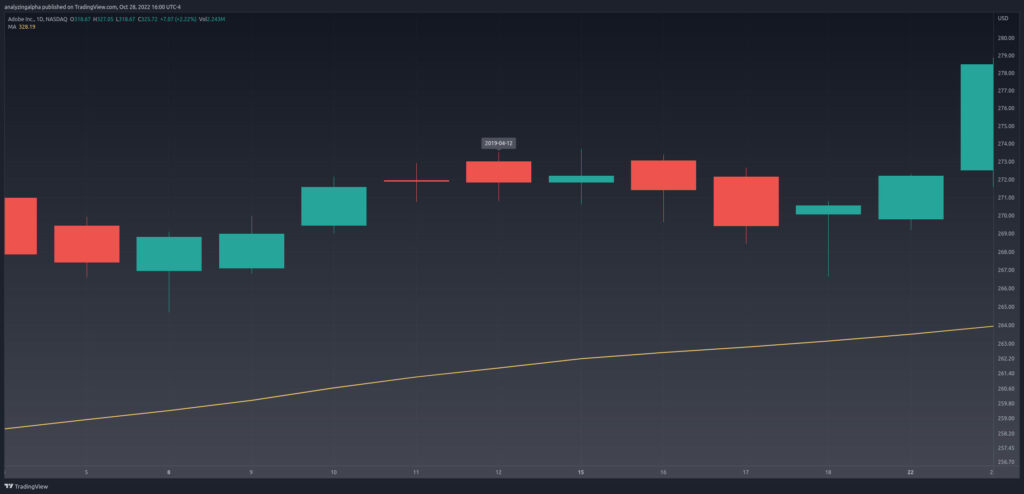
There’s a bullish uptrend; An initial bullish candle, a bearish doji gapping up, and a third bearish candle engulfing the prior doji and closing above the first candle’s close, giving us the upside gap two crows pattern.
Data-driven mean reversion traders enter long when the price moves below and above the upside gap two crow’s pattern low while setting a stop loss of one ATR.
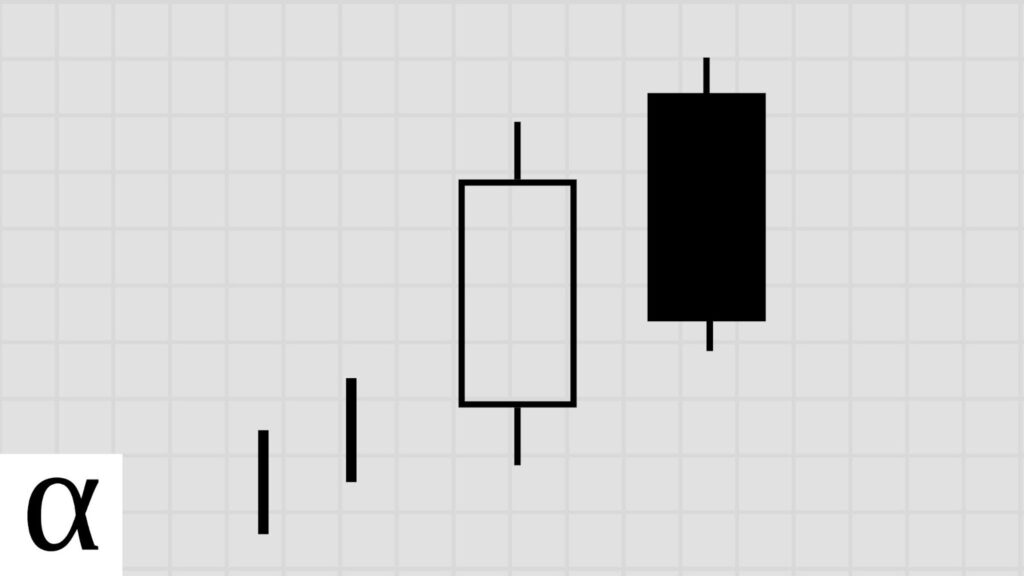
Let’s paint this picture using the Adobe daily chart on April 12th, 2019.
The upside gap two crow’s low occurs on the first candle at $269.01. The price pushes below and rises above the pattern low on the 17th, triggering a long entry. We see bullish sentiment as the price moves up and to the right in a big way.
Now that we know how to fly with the data-driven flock, what can history tell us about the best upside gap two crows trading strategy?
Does the Upside Gap Two Crows Candlestick Pattern Work? (Backtest Results)
I backtested the upside gap two crows pattern on the daily timeframe in the crypto, forex, and stock markets using the following rules:
- A close above the 50-day SMA constitutes an uptrend.
- I tested risk-reward ranges from 1 to 5.
- The optimal risk-reward ratio is selected using profit per bar.
- Entry and exits are discussed in the how-to trade section above.
- Confirmation must occur within three days of the pattern signal.
| Id | Pattern | Pattern Bars | Required Trend | Traditional Strategy | Market | Strategy | Setup | RR | Tickers | Signals | Trades | Trade Bars | Edge | Edge Per Bar | Confirm % | Win % | Cons Wins | Cons Losses | Avg. Trade Bars | Avg. Win Bars | Avg. Loss Bars | Details |
|---|---|---|---|---|---|---|---|---|---|---|---|---|---|---|---|---|---|---|---|---|---|---|
| 7,916 | upside_gap_two_crows | 3 | uptrend | bearish reversal | forex | bearish reversal | high-close | 1 | 6 | 12 | 12 | 26 | -0.337 | -0.11 | 1.00 | 0.33 | 1 | 2 | 2.17 | 1.75 | 2.38 | https://analyzingalpha.com/upside-gap-two-crows-candlestick-pattern |
| 7,917 | upside_gap_two_crows | 3 | uptrend | bearish reversal | forex | bearish reversal | high-close | 2 | 6 | 12 | 12 | 38 | -0.004 | 0.00 | 1.00 | 0.33 | 1 | 2 | 3.17 | 4.75 | 2.38 | https://analyzingalpha.com/upside-gap-two-crows-candlestick-pattern |
| 7,918 | upside_gap_two_crows | 3 | uptrend | bearish reversal | forex | bearish reversal | high-close | 3 | 6 | 12 | 12 | 50 | -0.329 | -0.11 | 1.00 | 0.17 | 1 | 2 | 4.17 | 6.00 | 3.80 | https://analyzingalpha.com/upside-gap-two-crows-candlestick-pattern |
| 7,919 | upside_gap_two_crows | 3 | uptrend | bearish reversal | forex | bearish reversal | high-close | 4 | 6 | 12 | 12 | 56 | -0.162 | -0.05 | 1.00 | 0.17 | 1 | 2 | 4.67 | 9.00 | 3.80 | https://analyzingalpha.com/upside-gap-two-crows-candlestick-pattern |
| 7,920 | upside_gap_two_crows | 3 | uptrend | bearish reversal | forex | bearish reversal | high-close | 5 | 6 | 12 | 12 | 56 | 0.005 | 0.00 | 1.00 | 0.17 | 1 | 2 | 4.67 | 9.00 | 3.80 | https://analyzingalpha.com/upside-gap-two-crows-candlestick-pattern |
| 7,921 | upside_gap_two_crows | 3 | uptrend | bearish reversal | stock | bearish reversal | high-close | 1 | 825 | 2,106 | 1,924 | 5,051 | 0.017 | 0.01 | 0.91 | 0.51 | 5 | 5 | 2.63 | 2.82 | 2.43 | https://analyzingalpha.com/upside-gap-two-crows-candlestick-pattern |
| 7,922 | upside_gap_two_crows | 3 | uptrend | bearish reversal | stock | bearish reversal | high-close | 2 | 825 | 2,105 | 1,923 | 8,997 | 0.056 | 0.02 | 0.91 | 0.35 | 3 | 6 | 4.68 | 5.64 | 4.15 | https://analyzingalpha.com/upside-gap-two-crows-candlestick-pattern |
| 7,923 | upside_gap_two_crows | 3 | uptrend | bearish reversal | stock | bearish reversal | high-close | 3 | 825 | 2,105 | 1,921 | 11,458 | 0.074 | 0.02 | 0.91 | 0.27 | 3 | 6 | 5.96 | 6.94 | 5.61 | https://analyzingalpha.com/upside-gap-two-crows-candlestick-pattern |
| 7,924 | upside_gap_two_crows | 3 | uptrend | bearish reversal | stock | bearish reversal | high-close | 4 | 825 | 2,101 | 1,917 | 14,107 | 0.050 | 0.02 | 0.91 | 0.21 | 3 | 6 | 7.36 | 9.93 | 6.68 | https://analyzingalpha.com/upside-gap-two-crows-candlestick-pattern |
| 7,925 | upside_gap_two_crows | 3 | uptrend | bearish reversal | stock | bearish reversal | high-close | 5 | 825 | 2,100 | 1,915 | 16,989 | 0.020 | 0.01 | 0.91 | 0.17 | 3 | 6 | 8.87 | 16.58 | 7.30 | https://analyzingalpha.com/upside-gap-two-crows-candlestick-pattern |
| 8,051 | upside_gap_two_crows | 3 | uptrend | bearish reversal | forex | bullish continuation | low-high | 1 | 6 | 12 | 6 | 35 | -0.663 | -0.22 | 0.50 | 0.17 | 0 | 1 | 5.83 | 1.00 | 6.80 | https://analyzingalpha.com/upside-gap-two-crows-candlestick-pattern |
| 8,052 | upside_gap_two_crows | 3 | uptrend | bearish reversal | forex | bullish continuation | low-high | 2 | 6 | 12 | 6 | 39 | -0.496 | -0.17 | 0.50 | 0.17 | 0 | 1 | 6.50 | 5.00 | 6.80 | https://analyzingalpha.com/upside-gap-two-crows-candlestick-pattern |
| 8,053 | upside_gap_two_crows | 3 | uptrend | bearish reversal | forex | bullish continuation | low-high | 3 | 6 | 12 | 6 | 56 | -0.329 | -0.11 | 0.50 | 0.17 | 0 | 1 | 9.33 | 22.00 | 6.80 | https://analyzingalpha.com/upside-gap-two-crows-candlestick-pattern |
| 8,054 | upside_gap_two_crows | 3 | uptrend | bearish reversal | forex | bullish continuation | low-high | 4 | 6 | 12 | 6 | 61 | -0.162 | -0.05 | 0.50 | 0.17 | 0 | 1 | 10.17 | 27.00 | 6.80 | https://analyzingalpha.com/upside-gap-two-crows-candlestick-pattern |
| 8,055 | upside_gap_two_crows | 3 | uptrend | bearish reversal | forex | bullish continuation | low-high | 5 | 6 | 12 | 6 | 95 | 0.005 | 0.00 | 0.50 | 0.17 | 0 | 1 | 15.83 | 61.00 | 6.80 | https://analyzingalpha.com/upside-gap-two-crows-candlestick-pattern |
| 8,056 | upside_gap_two_crows | 3 | uptrend | bearish reversal | stock | bullish continuation | low-high | 1 | 825 | 2,109 | 1,136 | 3,197 | -0.195 | -0.07 | 0.54 | 0.41 | 3 | 4 | 2.81 | 3.06 | 2.65 | https://analyzingalpha.com/upside-gap-two-crows-candlestick-pattern |
| 8,057 | upside_gap_two_crows | 3 | uptrend | bearish reversal | stock | bullish continuation | low-high | 2 | 825 | 2,108 | 1,134 | 4,745 | -0.136 | -0.05 | 0.54 | 0.29 | 3 | 4 | 4.18 | 5.71 | 3.57 | https://analyzingalpha.com/upside-gap-two-crows-candlestick-pattern |
| 8,058 | upside_gap_two_crows | 3 | uptrend | bearish reversal | stock | bullish continuation | low-high | 3 | 825 | 2,107 | 1,133 | 6,085 | -0.080 | -0.03 | 0.54 | 0.23 | 3 | 4 | 5.37 | 8.83 | 4.34 | https://analyzingalpha.com/upside-gap-two-crows-candlestick-pattern |
| 8,059 | upside_gap_two_crows | 3 | uptrend | bearish reversal | stock | bullish continuation | low-high | 4 | 825 | 2,105 | 1,132 | 7,544 | -0.042 | -0.01 | 0.54 | 0.19 | 2 | 4 | 6.66 | 12.56 | 5.27 | https://analyzingalpha.com/upside-gap-two-crows-candlestick-pattern |
| 8,060 | upside_gap_two_crows | 3 | uptrend | bearish reversal | stock | bullish continuation | low-high | 5 | 825 | 2,104 | 1,132 | 9,110 | -0.050 | -0.02 | 0.54 | 0.16 | 2 | 4 | 8.05 | 17.22 | 6.33 | https://analyzingalpha.com/upside-gap-two-crows-candlestick-pattern |
| 8,791 | upside_gap_two_crows | 3 | uptrend | bearish reversal | forex | bearish mean reversion | atr-pattern_high | 1 | 6 | 12 | 4 | 30 | 1.000 | 0.33 | 0.33 | 1.00 | 1 | 0 | 7.50 | 7.50 | https://analyzingalpha.com/upside-gap-two-crows-candlestick-pattern | |
| 8,792 | upside_gap_two_crows | 3 | uptrend | bearish reversal | forex | bearish mean reversion | atr-pattern_high | 2 | 6 | 12 | 4 | 132 | 0.500 | 0.17 | 0.33 | 0.50 | 1 | 1 | 33.00 | 37.50 | 28.50 | https://analyzingalpha.com/upside-gap-two-crows-candlestick-pattern |
| 8,793 | upside_gap_two_crows | 3 | uptrend | bearish reversal | forex | bearish mean reversion | atr-pattern_high | 3 | 6 | 11 | 4 | 297 | 0.000 | 0.00 | 0.36 | 0.25 | 1 | 1 | 74.25 | 211.00 | 28.67 | https://analyzingalpha.com/upside-gap-two-crows-candlestick-pattern |
| 8,794 | upside_gap_two_crows | 3 | uptrend | bearish reversal | forex | bearish mean reversion | atr-pattern_high | 4 | 6 | 11 | 4 | 297 | 0.250 | 0.08 | 0.36 | 0.25 | 1 | 1 | 74.25 | 211.00 | 28.67 | https://analyzingalpha.com/upside-gap-two-crows-candlestick-pattern |
| 8,795 | upside_gap_two_crows | 3 | uptrend | bearish reversal | forex | bearish mean reversion | atr-pattern_high | 5 | 6 | 11 | 4 | 298 | 0.500 | 0.17 | 0.36 | 0.25 | 1 | 1 | 74.50 | 212.00 | 28.67 | https://analyzingalpha.com/upside-gap-two-crows-candlestick-pattern |
| 8,796 | upside_gap_two_crows | 3 | uptrend | bearish reversal | stock | bearish mean reversion | atr-pattern_high | 1 | 825 | 2,107 | 821 | 2,762 | 0.138 | 0.05 | 0.39 | 0.57 | 3 | 3 | 3.36 | 3.38 | 3.35 | https://analyzingalpha.com/upside-gap-two-crows-candlestick-pattern |
| 8,797 | upside_gap_two_crows | 3 | uptrend | bearish reversal | stock | bearish mean reversion | atr-pattern_high | 2 | 825 | 2,107 | 821 | 5,245 | 0.112 | 0.04 | 0.39 | 0.37 | 3 | 3 | 6.39 | 7.62 | 5.66 | https://analyzingalpha.com/upside-gap-two-crows-candlestick-pattern |
| 8,798 | upside_gap_two_crows | 3 | uptrend | bearish reversal | stock | bearish mean reversion | atr-pattern_high | 3 | 825 | 2,106 | 820 | 7,456 | 0.055 | 0.02 | 0.39 | 0.27 | 2 | 4 | 9.09 | 13.33 | 7.57 | https://analyzingalpha.com/upside-gap-two-crows-candlestick-pattern |
| 8,799 | upside_gap_two_crows | 3 | uptrend | bearish reversal | stock | bearish mean reversion | atr-pattern_high | 4 | 825 | 2,106 | 820 | 9,446 | 0.038 | 0.01 | 0.39 | 0.21 | 2 | 4 | 11.52 | 20.77 | 9.10 | https://analyzingalpha.com/upside-gap-two-crows-candlestick-pattern |
| 8,800 | upside_gap_two_crows | 3 | uptrend | bearish reversal | stock | bearish mean reversion | atr-pattern_high | 5 | 825 | 2,104 | 819 | 11,216 | 0.025 | 0.01 | 0.39 | 0.17 | 2 | 4 | 13.69 | 26.84 | 10.98 | https://analyzingalpha.com/upside-gap-two-crows-candlestick-pattern |
| 8,991 | upside_gap_two_crows | 3 | uptrend | bearish reversal | forex | bullish continuation | low-close | 1 | 6 | 12 | 12 | 35 | -0.500 | -0.17 | 1.00 | 0.25 | 2 | 2 | 2.92 | 2.67 | 3.00 | https://analyzingalpha.com/upside-gap-two-crows-candlestick-pattern |
| 8,992 | upside_gap_two_crows | 3 | uptrend | bearish reversal | forex | bullish continuation | low-close | 2 | 6 | 12 | 12 | 42 | -0.496 | -0.17 | 1.00 | 0.17 | 2 | 2 | 3.50 | 4.50 | 3.30 | https://analyzingalpha.com/upside-gap-two-crows-candlestick-pattern |
| 8,993 | upside_gap_two_crows | 3 | uptrend | bearish reversal | forex | bullish continuation | low-close | 3 | 6 | 12 | 12 | 53 | -0.671 | -0.22 | 1.00 | 0.08 | 0 | 2 | 4.42 | 1.00 | 4.73 | https://analyzingalpha.com/upside-gap-two-crows-candlestick-pattern |
| 8,994 | upside_gap_two_crows | 3 | uptrend | bearish reversal | forex | bullish continuation | low-close | 4 | 6 | 12 | 12 | 53 | -0.588 | -0.20 | 1.00 | 0.08 | 0 | 2 | 4.42 | 1.00 | 4.73 | https://analyzingalpha.com/upside-gap-two-crows-candlestick-pattern |
| 8,995 | upside_gap_two_crows | 3 | uptrend | bearish reversal | forex | bullish continuation | low-close | 5 | 6 | 12 | 12 | 53 | -0.505 | -0.17 | 1.00 | 0.08 | 0 | 2 | 4.42 | 1.00 | 4.73 | https://analyzingalpha.com/upside-gap-two-crows-candlestick-pattern |
| 8,996 | upside_gap_two_crows | 3 | uptrend | bearish reversal | stock | bullish continuation | low-close | 1 | 825 | 2,109 | 1,926 | 2,512 | -0.298 | -0.10 | 0.91 | 0.35 | 4 | 5 | 1.30 | 1.44 | 1.23 | https://analyzingalpha.com/upside-gap-two-crows-candlestick-pattern |
| 8,997 | upside_gap_two_crows | 3 | uptrend | bearish reversal | stock | bullish continuation | low-close | 2 | 825 | 2,109 | 1,926 | 3,133 | -0.122 | -0.04 | 0.91 | 0.29 | 4 | 5 | 1.63 | 1.97 | 1.48 | https://analyzingalpha.com/upside-gap-two-crows-candlestick-pattern |
| 8,998 | upside_gap_two_crows | 3 | uptrend | bearish reversal | stock | bullish continuation | low-close | 3 | 825 | 2,109 | 1,926 | 3,727 | 0.000 | 0.00 | 0.91 | 0.25 | 3 | 6 | 1.94 | 2.65 | 1.70 | https://analyzingalpha.com/upside-gap-two-crows-candlestick-pattern |
| 8,999 | upside_gap_two_crows | 3 | uptrend | bearish reversal | stock | bullish continuation | low-close | 4 | 825 | 2,107 | 1,924 | 4,228 | 0.108 | 0.04 | 0.91 | 0.22 | 2 | 6 | 2.20 | 3.43 | 1.85 | https://analyzingalpha.com/upside-gap-two-crows-candlestick-pattern |
| 9,000 | upside_gap_two_crows | 3 | uptrend | bearish reversal | stock | bullish continuation | low-close | 5 | 825 | 2,106 | 1,922 | 4,657 | 0.190 | 0.06 | 0.91 | 0.20 | 2 | 8 | 2.42 | 4.18 | 1.99 | https://analyzingalpha.com/upside-gap-two-crows-candlestick-pattern |
| 10,076 | upside_gap_two_crows | 3 | uptrend | bearish reversal | forex | bearish reversal | high-low | 1 | 6 | 12 | 5 | 23 | -1.000 | -0.33 | 0.42 | 0.00 | 0 | 2 | 4.60 | 4.60 | https://analyzingalpha.com/upside-gap-two-crows-candlestick-pattern | |
| 10,077 | upside_gap_two_crows | 3 | uptrend | bearish reversal | forex | bearish reversal | high-low | 2 | 6 | 12 | 5 | 23 | -1.000 | -0.33 | 0.42 | 0.00 | 0 | 2 | 4.60 | 4.60 | https://analyzingalpha.com/upside-gap-two-crows-candlestick-pattern | |
| 10,078 | upside_gap_two_crows | 3 | uptrend | bearish reversal | forex | bearish reversal | high-low | 3 | 6 | 12 | 5 | 23 | -1.000 | -0.33 | 0.42 | 0.00 | 0 | 2 | 4.60 | 4.60 | https://analyzingalpha.com/upside-gap-two-crows-candlestick-pattern | |
| 10,079 | upside_gap_two_crows | 3 | uptrend | bearish reversal | forex | bearish reversal | high-low | 4 | 6 | 12 | 5 | 23 | -1.000 | -0.33 | 0.42 | 0.00 | 0 | 2 | 4.60 | 4.60 | https://analyzingalpha.com/upside-gap-two-crows-candlestick-pattern | |
| 10,080 | upside_gap_two_crows | 3 | uptrend | bearish reversal | forex | bearish reversal | high-low | 5 | 6 | 12 | 5 | 23 | -1.000 | -0.33 | 0.42 | 0.00 | 0 | 2 | 4.60 | 4.60 | https://analyzingalpha.com/upside-gap-two-crows-candlestick-pattern | |
| 10,081 | upside_gap_two_crows | 3 | uptrend | bearish reversal | stock | bearish reversal | high-low | 1 | 825 | 2,106 | 1,621 | 6,239 | -0.058 | -0.02 | 0.77 | 0.47 | 4 | 4 | 3.85 | 3.92 | 3.79 | https://analyzingalpha.com/upside-gap-two-crows-candlestick-pattern |
| 10,082 | upside_gap_two_crows | 3 | uptrend | bearish reversal | stock | bearish reversal | high-low | 2 | 825 | 2,105 | 1,620 | 10,793 | -0.048 | -0.02 | 0.77 | 0.32 | 3 | 5 | 6.66 | 8.37 | 5.87 | https://analyzingalpha.com/upside-gap-two-crows-candlestick-pattern |
| 10,083 | upside_gap_two_crows | 3 | uptrend | bearish reversal | stock | bearish reversal | high-low | 3 | 825 | 2,103 | 1,616 | 14,198 | -0.086 | -0.03 | 0.77 | 0.23 | 3 | 5 | 8.79 | 12.46 | 7.70 | https://analyzingalpha.com/upside-gap-two-crows-candlestick-pattern |
| 10,084 | upside_gap_two_crows | 3 | uptrend | bearish reversal | stock | bearish reversal | high-low | 4 | 825 | 2,101 | 1,613 | 17,923 | -0.134 | -0.04 | 0.77 | 0.17 | 3 | 5 | 11.11 | 19.53 | 9.34 | https://analyzingalpha.com/upside-gap-two-crows-candlestick-pattern |
| 10,085 | upside_gap_two_crows | 3 | uptrend | bearish reversal | stock | bearish reversal | high-low | 5 | 825 | 2,098 | 1,612 | 21,513 | -0.110 | -0.04 | 0.77 | 0.15 | 3 | 5 | 13.35 | 27.34 | 10.92 | https://analyzingalpha.com/upside-gap-two-crows-candlestick-pattern |
| 11,446 | upside_gap_two_crows | 3 | uptrend | bearish reversal | forex | bullish mean reversion | atr-pattern_low | 1 | 6 | 12 | 2 | 10 | 1.000 | 0.33 | 0.17 | 1.00 | 1 | 0 | 5.00 | 5.00 | https://analyzingalpha.com/upside-gap-two-crows-candlestick-pattern | |
| 11,447 | upside_gap_two_crows | 3 | uptrend | bearish reversal | forex | bullish mean reversion | atr-pattern_low | 2 | 6 | 12 | 2 | 71 | 2.000 | 0.67 | 0.17 | 1.00 | 1 | 0 | 35.50 | 35.50 | https://analyzingalpha.com/upside-gap-two-crows-candlestick-pattern | |
| 11,448 | upside_gap_two_crows | 3 | uptrend | bearish reversal | forex | bullish mean reversion | atr-pattern_low | 3 | 6 | 12 | 2 | 305 | 1.000 | 0.33 | 0.17 | 0.50 | 1 | 1 | 152.50 | 36.00 | 269.00 | https://analyzingalpha.com/upside-gap-two-crows-candlestick-pattern |
| 11,449 | upside_gap_two_crows | 3 | uptrend | bearish reversal | forex | bullish mean reversion | atr-pattern_low | 4 | 6 | 12 | 2 | 359 | 1.500 | 0.50 | 0.17 | 0.50 | 1 | 1 | 179.50 | 90.00 | 269.00 | https://analyzingalpha.com/upside-gap-two-crows-candlestick-pattern |
| 11,450 | upside_gap_two_crows | 3 | uptrend | bearish reversal | forex | bullish mean reversion | atr-pattern_low | 5 | 6 | 12 | 2 | 367 | 2.000 | 0.67 | 0.17 | 0.50 | 1 | 1 | 183.50 | 98.00 | 269.00 | https://analyzingalpha.com/upside-gap-two-crows-candlestick-pattern |
| 11,451 | upside_gap_two_crows | 3 | uptrend | bearish reversal | stock | bullish mean reversion | atr-pattern_low | 1 | 825 | 2,107 | 504 | 1,905 | 0.197 | 0.07 | 0.24 | 0.60 | 3 | 3 | 3.78 | 3.84 | 3.68 | https://analyzingalpha.com/upside-gap-two-crows-candlestick-pattern |
| 11,452 | upside_gap_two_crows | 3 | uptrend | bearish reversal | stock | bullish mean reversion | atr-pattern_low | 2 | 825 | 2,106 | 503 | 3,600 | 0.318 | 0.11 | 0.24 | 0.44 | 3 | 3 | 7.16 | 8.45 | 6.15 | https://analyzingalpha.com/upside-gap-two-crows-candlestick-pattern |
| 11,453 | upside_gap_two_crows | 3 | uptrend | bearish reversal | stock | bullish mean reversion | atr-pattern_low | 3 | 825 | 2,104 | 501 | 5,148 | 0.511 | 0.17 | 0.24 | 0.38 | 3 | 3 | 10.28 | 13.95 | 8.05 | https://analyzingalpha.com/upside-gap-two-crows-candlestick-pattern |
| 11,454 | upside_gap_two_crows | 3 | uptrend | bearish reversal | stock | bullish mean reversion | atr-pattern_low | 4 | 825 | 2,104 | 500 | 7,096 | 0.508 | 0.17 | 0.24 | 0.30 | 2 | 3 | 14.19 | 20.81 | 11.33 | https://analyzingalpha.com/upside-gap-two-crows-candlestick-pattern |
| 11,455 | upside_gap_two_crows | 3 | uptrend | bearish reversal | stock | bullish mean reversion | atr-pattern_low | 5 | 825 | 2,104 | 500 | 8,470 | 0.570 | 0.19 | 0.24 | 0.26 | 2 | 3 | 16.94 | 27.82 | 13.08 | https://analyzingalpha.com/upside-gap-two-crows-candlestick-pattern |
| Market | Strategy | Setup | Trades | Edge |
Pattern:
Pattern Bars:
Required Trend:
Traditional Strategy:
Market:
Strategy:
Setup:
RR:
Tickers:
Signals:
Trades:
Trade Bars:
Edge:
Edge Per Bar:
Confirm %:
Win %:
Cons Wins:
Cons Losses:
Avg. Trade Bars:
Avg. Win Bars:
Avg. Loss Bars:
Similar Candlestick Patterns
Multiple candlestick patterns are often confused with the upside gap two crows.
Two Crows vs. Upside Gap Two Crows
The two crows candlestick pattern is nearly identical to its avian companion. The third candle is the only difference between the two crows and the upside gap two crows patterns. The two crows third candle opens within the second candle’s real body and closes within the first candle’s real body, whereas the upside gap two crows third candle engulfs the second candle and closes above the first candle’s close.
And while traditional analysts believe this is a bearish reversal candlestick pattern, the data shows that they both suggest near-term volatility.
Three Black Crows vs. Upside Gap Two Crows
Three black crows candlestick pattern is a three-bar bearish reversal pattern. The reason why these patterns often are confused is easy–they both contain a crow in the name. The three black crows are a four-bar pattern with a bullish candle followed by three consecutive bearish candlesticks with little to no lower wick.
Identical Three Crows vs. Upside Gap Two Crows
The identical three crows candlestick pattern is a three-candle bearish reversal pattern. Yes, more discussion of crows. The difference between this pattern and the three crows is that the identical three crows require each bearish candle to open at or near the last candle’s close.
Dark Cloud Cover Vs. Upside Gap Two Crows
The dark cloud cover candlestick pattern is a two-candle bullish reversal pattern. There’s an initial bullish candle followed by a bearish candle that opens above the first candle’s high and closes within its real body.
The dark cloud cover and upside gap two crows get confused because they’re both reversal patterns with bearish candles. The critical thing to remember is that the upside gap two crows have two bearish candles instead of one.
The Bottom Line
The upside gap two crows is a three-candle bearish continuation pattern that’s best traded using mean reversion strategies to capture the likely volatility. Forex and crypto traders should avoid this pattern because the lack of pattern frequency prevents statistically significant results.
Data-driven professionals might want to limit their selection to the best candlestick patterns for trading.