The three inside down is a three-bar bearish reversal Japanese candlestick that historically leads to extended volatility.
Uninformed candlestick technical analysts might be shocked to learn that traditional methods lose money on this three-bar pattern.
But what if I told you that you could outsmart other traders by listening to history?
Would you be interested?
Keep reading if you want to make your profits go up instead of down, and learn the best three inside down trading strategies by listening to the data.
What Is a Three Inside Down Candlestick Pattern?
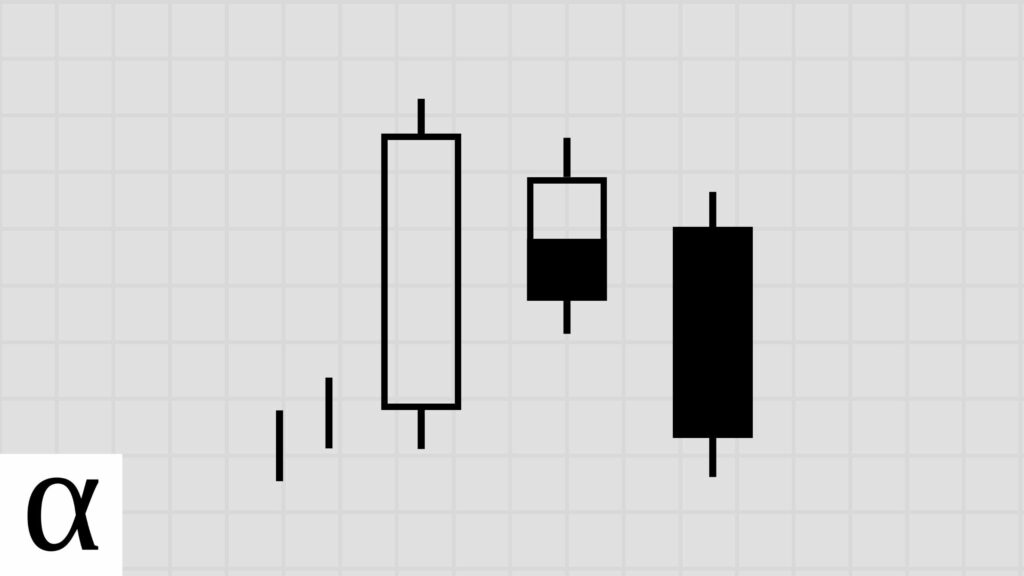
The three inside down candle pattern is a three-bar bearish reversal pattern.
The pattern gets its name from how it looks on a candlestick chart—three candles, with the second being inside the first and then the last moving down.
The pattern is supposed to indicate the potential weakness of the current uptrend, but the data shows it’s more likely a pullback in the longer-term trend.
Let’s learn how to identify this triple candlestick pattern, and then we’ll move on to the best three inside down trading strategies according to history.
How to Identify Three Inside Down Candlestick Patterns

The following are the requirements for a valid three inside down pattern:
- The first candle is bullish with a relatively long real body.
- The second candlestick must have a small body engulfed by the first candle.
- The third bearish candle closes lower than the first candle’s opening price.
- The three inside down must occur during an uptrend.
The three inside down candlestick pattern is visible on the Alphabet (GOOG) daily chart on September 17th. 2021.
The price is in an uptrend as it’s above the fifty-day moving average. The first candle is large and bullish. The second has a small real body and is engulfed by the previous, and the last candle closes lower than the first candle’s opening price, fulfilling the three inside down pattern requirements.
Now that we’ve got pattern identification down, let’s learn how to trade this three-bar pattern optimally.
How to Trade the Three Inside Down Candlestick Pattern
The three inside down candlestick pattern should be traded using a bullish mean reversion strategy in the stock and crypto markets and a bearish strategy in the forex market.
Let’s first understand how traditional traders are pulling their profits down, and then we’ll learn the best three inside down trading strategies.
Three Inside Down Bearish Reversal Trade Setup

The above Apple daily chart on November 18th, 2021, clearly shows the bearish reversal trade setup.
We see that the pattern’s last close price is above the fifty-day simple moving average, which we’re using to determine the uptrend algorithmically.
The first candle closed in the same direction as the current trend. The second candle is a bearish doji whose real body is engulfed by the first candle. The third candle closes below the first candle’s opening, completing the pattern.
With the three inside down pattern identified, it’s time for an entry.
Traders traditionally enter short when the price falls below the last candle’s low and set a stop loss above the first candle’s high.
In our Apple example, this break occurs the day after pattern identification. Successful identification of this pattern and the subsequent short trade would have resulted in profits as the price continued to move to the downside.
But this is not typically the case.
Let’s look at the data-driven alternative.
Three Inside Down Bullish Mean Reversion Trade Setup

We’ve got the uptrend, a first bullish candle, a second candle engulfed by the first, and a third bearish candle closing below the first candle’s open, completing the pattern.
Savvy stock and crypto traders enter long when the price breaks below and comes back above the pattern’s low, setting a stop loss of one ATR and expecting a longer-term move.
Let’s use Bitcoin’s (BTCUSD) June 30th, 2019, daily chart to decrypt this.
The pattern low occurs on the last candle at $10,650.06. The price moves up and below the low the next day, alerting traders to be ready for entry. The price moves back above the low the following day, triggering an entry with data-driven traders likely exiting on the 8th with significantly more satoshis.
Data-driven forex traders need to do the same thing in the opposite direction while expecting a shorter move.
Three Inside Down Bearish Mean Reversion Trade Setup

We see a large bullish candle, an engulfed bearish candle, and a final bearish candle that closes below the first candle’s open in a bullish trend as the price is above the fifty-day simple moving average.
Data-driven forex traders wait for the price to move above the pattern high and then enter short when the price moves back below that high, setting a stop loss of one ATR.
Let’s use the CAD/GBP daily chart on October 7th, 2015, to clarify this currency trade.
The pattern high is on the second candle at 50.44. The price moves above and back below this level on October 9th, triggering an entry. Professional forex traders exited the trade on the 12th with exceptional risk-reward dynamics.
With rewards in mind, what does history tell us about the best three inside down trading strategies?
Does the Three Inside Down Candlestick Pattern Work? (Backtest Results)
I backtested the three inside down candlestick pattern on the daily timeframe in the crypto, forex, and stock markets using the following rules:
- A close above the 50-day SMA constitutes an uptrend.
- I tested risk-reward ranges from 1 to 5.
- The optimal risk-reward ratio is selected using profit per bar.
- Entry and exits are discussed in the how-to trade section above.
- Confirmation must occur within three days of the pattern signal.
| Id | Pattern | Pattern Bars | Required Trend | Traditional Strategy | Market | Strategy | Setup | RR | Tickers | Signals | Trades | Trade Bars | Edge | Edge Per Bar | Confirm % | Win % | Cons Wins | Cons Losses | Avg. Trade Bars | Avg. Win Bars | Avg. Loss Bars | Details |
|---|---|---|---|---|---|---|---|---|---|---|---|---|---|---|---|---|---|---|---|---|---|---|
| 9,926 | three_inside_down | 3 | uptrend | bearish reversal | crypto | bearish mean reversion | atr-pattern_high | 1 | 66 | 200 | 28 | 65 | 0.000 | 0.00 | 0.14 | 0.50 | 1 | 2 | 2.32 | 2.50 | 2.14 | https://analyzingalpha.com/three-inside-down-candlestick-pattern |
| 9,927 | three_inside_down | 3 | uptrend | bearish reversal | crypto | bearish mean reversion | atr-pattern_high | 2 | 66 | 200 | 28 | 165 | 0.074 | 0.02 | 0.14 | 0.36 | 1 | 2 | 5.89 | 7.70 | 4.89 | https://analyzingalpha.com/three-inside-down-candlestick-pattern |
| 9,928 | three_inside_down | 3 | uptrend | bearish reversal | crypto | bearish mean reversion | atr-pattern_high | 3 | 66 | 199 | 28 | 276 | 0.148 | 0.05 | 0.14 | 0.29 | 1 | 2 | 9.86 | 18.38 | 6.45 | https://analyzingalpha.com/three-inside-down-candlestick-pattern |
| 9,929 | three_inside_down | 3 | uptrend | bearish reversal | crypto | bearish mean reversion | atr-pattern_high | 4 | 66 | 199 | 28 | 385 | -0.288 | -0.10 | 0.14 | 0.14 | 1 | 2 | 13.75 | 12.75 | 13.92 | https://analyzingalpha.com/three-inside-down-candlestick-pattern |
| 9,930 | three_inside_down | 3 | uptrend | bearish reversal | crypto | bearish mean reversion | atr-pattern_high | 5 | 66 | 199 | 28 | 414 | -0.575 | -0.19 | 0.14 | 0.07 | 1 | 2 | 14.79 | 17.00 | 14.62 | https://analyzingalpha.com/three-inside-down-candlestick-pattern |
| 9,931 | three_inside_down | 3 | uptrend | bearish reversal | forex | bearish mean reversion | atr-pattern_high | 1 | 498 | 2,121 | 270 | 1,019 | 0.260 | 0.09 | 0.13 | 0.63 | 3 | 2 | 3.77 | 3.60 | 4.07 | https://analyzingalpha.com/three-inside-down-candlestick-pattern |
| 9,932 | three_inside_down | 3 | uptrend | bearish reversal | forex | bearish mean reversion | atr-pattern_high | 2 | 498 | 2,115 | 267 | 2,430 | 0.234 | 0.08 | 0.13 | 0.41 | 3 | 3 | 9.10 | 10.37 | 8.21 | https://analyzingalpha.com/three-inside-down-candlestick-pattern |
| 9,933 | three_inside_down | 3 | uptrend | bearish reversal | forex | bearish mean reversion | atr-pattern_high | 3 | 498 | 2,113 | 267 | 4,179 | 0.265 | 0.09 | 0.13 | 0.32 | 2 | 3 | 15.65 | 27.49 | 10.22 | https://analyzingalpha.com/three-inside-down-candlestick-pattern |
| 9,934 | three_inside_down | 3 | uptrend | bearish reversal | forex | bearish mean reversion | atr-pattern_high | 4 | 498 | 2,112 | 267 | 6,566 | 0.280 | 0.09 | 0.13 | 0.26 | 2 | 3 | 24.59 | 58.59 | 12.97 | https://analyzingalpha.com/three-inside-down-candlestick-pattern |
| 9,935 | three_inside_down | 3 | uptrend | bearish reversal | forex | bearish mean reversion | atr-pattern_high | 5 | 498 | 2,109 | 266 | 7,164 | 0.175 | 0.06 | 0.13 | 0.20 | 2 | 3 | 26.93 | 67.06 | 17.18 | https://analyzingalpha.com/three-inside-down-candlestick-pattern |
| 9,936 | three_inside_down | 3 | uptrend | bearish reversal | stock | bearish mean reversion | atr-pattern_high | 1 | 3,832 | 39,253 | 8,096 | 26,949 | 0.143 | 0.05 | 0.21 | 0.57 | 12 | 7 | 3.33 | 3.13 | 3.60 | https://analyzingalpha.com/three-inside-down-candlestick-pattern |
| 9,937 | three_inside_down | 3 | uptrend | bearish reversal | stock | bearish mean reversion | atr-pattern_high | 2 | 3,832 | 39,040 | 8,047 | 51,681 | 0.136 | 0.05 | 0.21 | 0.38 | 6 | 7 | 6.42 | 7.48 | 5.78 | https://analyzingalpha.com/three-inside-down-candlestick-pattern |
| 9,938 | three_inside_down | 3 | uptrend | bearish reversal | stock | bearish mean reversion | atr-pattern_high | 3 | 3,832 | 38,943 | 8,028 | 76,666 | 0.080 | 0.03 | 0.21 | 0.27 | 6 | 11 | 9.55 | 13.01 | 8.27 | https://analyzingalpha.com/three-inside-down-candlestick-pattern |
| 9,939 | three_inside_down | 3 | uptrend | bearish reversal | stock | bearish mean reversion | atr-pattern_high | 4 | 3,832 | 38,907 | 8,013 | 99,840 | 0.038 | 0.01 | 0.21 | 0.21 | 4 | 11 | 12.46 | 20.18 | 10.44 | https://analyzingalpha.com/three-inside-down-candlestick-pattern |
| 9,940 | three_inside_down | 3 | uptrend | bearish reversal | stock | bearish mean reversion | atr-pattern_high | 5 | 3,832 | 38,885 | 8,001 | 120,149 | 0.015 | 0.01 | 0.21 | 0.17 | 4 | 11 | 15.02 | 28.29 | 12.31 | https://analyzingalpha.com/three-inside-down-candlestick-pattern |
| 11,206 | three_inside_down | 3 | uptrend | bearish reversal | crypto | bullish continuation | low-close | 1 | 66 | 202 | 198 | 253 | -0.739 | -0.25 | 0.98 | 0.13 | 3 | 9 | 1.28 | 1.42 | 1.26 | https://analyzingalpha.com/three-inside-down-candlestick-pattern |
| 11,207 | three_inside_down | 3 | uptrend | bearish reversal | crypto | bullish continuation | low-close | 2 | 66 | 202 | 198 | 268 | -0.678 | -0.23 | 0.98 | 0.11 | 3 | 9 | 1.35 | 1.86 | 1.29 | https://analyzingalpha.com/three-inside-down-candlestick-pattern |
| 11,208 | three_inside_down | 3 | uptrend | bearish reversal | crypto | bullish continuation | low-close | 3 | 66 | 202 | 198 | 287 | -0.597 | -0.20 | 0.98 | 0.10 | 3 | 9 | 1.45 | 2.60 | 1.32 | https://analyzingalpha.com/three-inside-down-candlestick-pattern |
| 11,209 | three_inside_down | 3 | uptrend | bearish reversal | crypto | bullish continuation | low-close | 4 | 66 | 202 | 198 | 302 | -0.596 | -0.20 | 0.98 | 0.08 | 2 | 9 | 1.53 | 3.31 | 1.37 | https://analyzingalpha.com/three-inside-down-candlestick-pattern |
| 11,210 | three_inside_down | 3 | uptrend | bearish reversal | crypto | bullish continuation | low-close | 5 | 66 | 202 | 198 | 325 | -0.635 | -0.21 | 0.98 | 0.06 | 1 | 9 | 1.64 | 4.42 | 1.46 | https://analyzingalpha.com/three-inside-down-candlestick-pattern |
| 11,211 | three_inside_down | 3 | uptrend | bearish reversal | forex | bullish continuation | low-close | 1 | 498 | 2,116 | 2,080 | 2,787 | -0.778 | -0.26 | 0.98 | 0.11 | 2 | 10 | 1.34 | 1.94 | 1.26 | https://analyzingalpha.com/three-inside-down-candlestick-pattern |
| 11,212 | three_inside_down | 3 | uptrend | bearish reversal | forex | bullish continuation | low-close | 2 | 498 | 2,116 | 2,080 | 3,243 | -0.738 | -0.25 | 0.98 | 0.09 | 2 | 10 | 1.56 | 2.70 | 1.45 | https://analyzingalpha.com/three-inside-down-candlestick-pattern |
| 11,213 | three_inside_down | 3 | uptrend | bearish reversal | forex | bullish continuation | low-close | 3 | 498 | 2,116 | 2,079 | 3,422 | -0.726 | -0.24 | 0.98 | 0.07 | 2 | 10 | 1.65 | 3.20 | 1.53 | https://analyzingalpha.com/three-inside-down-candlestick-pattern |
| 11,214 | three_inside_down | 3 | uptrend | bearish reversal | forex | bullish continuation | low-close | 4 | 498 | 2,116 | 2,079 | 3,777 | -0.700 | -0.23 | 0.98 | 0.06 | 2 | 10 | 1.82 | 4.14 | 1.67 | https://analyzingalpha.com/three-inside-down-candlestick-pattern |
| 11,215 | three_inside_down | 3 | uptrend | bearish reversal | forex | bullish continuation | low-close | 5 | 498 | 2,115 | 2,078 | 4,013 | -0.715 | -0.24 | 0.98 | 0.05 | 2 | 12 | 1.93 | 4.84 | 1.79 | https://analyzingalpha.com/three-inside-down-candlestick-pattern |
| 11,216 | three_inside_down | 3 | uptrend | bearish reversal | stock | bullish continuation | low-close | 1 | 3,832 | 39,582 | 36,380 | 39,768 | -0.739 | -0.25 | 0.92 | 0.13 | 4 | 26 | 1.09 | 1.33 | 1.06 | https://analyzingalpha.com/three-inside-down-candlestick-pattern |
| 11,217 | three_inside_down | 3 | uptrend | bearish reversal | stock | bullish continuation | low-close | 2 | 3,832 | 39,573 | 36,371 | 43,411 | -0.650 | -0.22 | 0.92 | 0.12 | 3 | 26 | 1.19 | 1.76 | 1.12 | https://analyzingalpha.com/three-inside-down-candlestick-pattern |
| 11,218 | three_inside_down | 3 | uptrend | bearish reversal | stock | bullish continuation | low-close | 3 | 3,832 | 39,563 | 36,361 | 46,859 | -0.591 | -0.20 | 0.92 | 0.10 | 3 | 26 | 1.29 | 2.27 | 1.18 | https://analyzingalpha.com/three-inside-down-candlestick-pattern |
| 11,219 | three_inside_down | 3 | uptrend | bearish reversal | stock | bullish continuation | low-close | 4 | 3,832 | 39,542 | 36,341 | 50,359 | -0.534 | -0.18 | 0.92 | 0.09 | 3 | 26 | 1.39 | 2.85 | 1.23 | https://analyzingalpha.com/three-inside-down-candlestick-pattern |
| 11,220 | three_inside_down | 3 | uptrend | bearish reversal | stock | bullish continuation | low-close | 5 | 3,832 | 39,524 | 36,327 | 54,165 | -0.480 | -0.16 | 0.92 | 0.09 | 3 | 27 | 1.49 | 3.32 | 1.32 | https://analyzingalpha.com/three-inside-down-candlestick-pattern |
| 11,486 | three_inside_down | 3 | uptrend | bearish reversal | crypto | bearish reversal | high-low | 1 | 66 | 197 | 134 | 1,278 | -0.145 | -0.05 | 0.68 | 0.43 | 5 | 3 | 9.54 | 6.53 | 11.77 | https://analyzingalpha.com/three-inside-down-candlestick-pattern |
| 11,487 | three_inside_down | 3 | uptrend | bearish reversal | crypto | bearish reversal | high-low | 2 | 66 | 196 | 132 | 2,756 | -0.290 | -0.10 | 0.67 | 0.24 | 3 | 9 | 20.88 | 34.81 | 16.60 | https://analyzingalpha.com/three-inside-down-candlestick-pattern |
| 11,488 | three_inside_down | 3 | uptrend | bearish reversal | crypto | bearish reversal | high-low | 3 | 66 | 190 | 126 | 3,829 | -0.489 | -0.16 | 0.66 | 0.13 | 2 | 9 | 30.39 | 23.69 | 31.36 | https://analyzingalpha.com/three-inside-down-candlestick-pattern |
| 11,489 | three_inside_down | 3 | uptrend | bearish reversal | crypto | bearish reversal | high-low | 4 | 66 | 190 | 126 | 4,197 | -0.446 | -0.15 | 0.66 | 0.11 | 2 | 9 | 33.31 | 27.21 | 34.07 | https://analyzingalpha.com/three-inside-down-candlestick-pattern |
| 11,490 | three_inside_down | 3 | uptrend | bearish reversal | crypto | bearish reversal | high-low | 5 | 66 | 189 | 125 | 4,717 | -0.520 | -0.17 | 0.66 | 0.08 | 2 | 9 | 37.74 | 57.20 | 36.04 | https://analyzingalpha.com/three-inside-down-candlestick-pattern |
| 11,491 | three_inside_down | 3 | uptrend | bearish reversal | forex | bearish reversal | high-low | 1 | 498 | 2,107 | 1,524 | 14,283 | -0.056 | -0.02 | 0.72 | 0.47 | 7 | 9 | 9.37 | 10.14 | 8.68 | https://analyzingalpha.com/three-inside-down-candlestick-pattern |
| 11,492 | three_inside_down | 3 | uptrend | bearish reversal | forex | bearish reversal | high-low | 2 | 498 | 2,083 | 1,506 | 31,512 | -0.108 | -0.04 | 0.72 | 0.30 | 5 | 9 | 20.92 | 29.91 | 17.14 | https://analyzingalpha.com/three-inside-down-candlestick-pattern |
| 11,493 | three_inside_down | 3 | uptrend | bearish reversal | forex | bearish reversal | high-low | 3 | 498 | 2,070 | 1,491 | 46,782 | -0.154 | -0.05 | 0.72 | 0.21 | 3 | 9 | 31.38 | 53.17 | 25.51 | https://analyzingalpha.com/three-inside-down-candlestick-pattern |
| 11,494 | three_inside_down | 3 | uptrend | bearish reversal | forex | bearish reversal | high-low | 4 | 498 | 2,060 | 1,479 | 56,720 | -0.158 | -0.05 | 0.72 | 0.17 | 3 | 9 | 38.35 | 77.51 | 30.46 | https://analyzingalpha.com/three-inside-down-candlestick-pattern |
| 11,495 | three_inside_down | 3 | uptrend | bearish reversal | forex | bearish reversal | high-low | 5 | 498 | 2,055 | 1,468 | 66,002 | -0.175 | -0.06 | 0.71 | 0.14 | 3 | 9 | 44.96 | 104.60 | 35.50 | https://analyzingalpha.com/three-inside-down-candlestick-pattern |
| 11,496 | three_inside_down | 3 | uptrend | bearish reversal | stock | bearish reversal | high-low | 1 | 3,832 | 38,710 | 29,986 | 257,095 | -0.044 | -0.01 | 0.77 | 0.48 | 18 | 9 | 8.57 | 8.12 | 8.99 | https://analyzingalpha.com/three-inside-down-candlestick-pattern |
| 11,497 | three_inside_down | 3 | uptrend | bearish reversal | stock | bearish reversal | high-low | 2 | 3,832 | 38,272 | 29,575 | 464,097 | -0.106 | -0.04 | 0.77 | 0.30 | 11 | 19 | 15.69 | 18.90 | 14.33 | https://analyzingalpha.com/three-inside-down-candlestick-pattern |
| 11,498 | three_inside_down | 3 | uptrend | bearish reversal | stock | bearish reversal | high-low | 3 | 3,832 | 37,954 | 29,247 | 644,193 | -0.157 | -0.05 | 0.77 | 0.21 | 9 | 22 | 22.03 | 33.86 | 18.86 | https://analyzingalpha.com/three-inside-down-candlestick-pattern |
| 11,499 | three_inside_down | 3 | uptrend | bearish reversal | stock | bearish reversal | high-low | 4 | 3,832 | 37,540 | 28,866 | 822,234 | -0.196 | -0.07 | 0.77 | 0.16 | 8 | 23 | 28.48 | 52.82 | 23.83 | https://analyzingalpha.com/three-inside-down-candlestick-pattern |
| 11,500 | three_inside_down | 3 | uptrend | bearish reversal | stock | bearish reversal | high-low | 5 | 3,832 | 37,067 | 28,431 | 988,409 | -0.230 | -0.08 | 0.77 | 0.13 | 7 | 24 | 34.77 | 78.63 | 28.34 | https://analyzingalpha.com/three-inside-down-candlestick-pattern |
| 12,031 | three_inside_down | 3 | uptrend | bearish reversal | crypto | bullish mean reversion | atr-pattern_low | 1 | 66 | 200 | 114 | 618 | 0.243 | 0.08 | 0.57 | 0.62 | 3 | 4 | 5.42 | 6.00 | 4.47 | https://analyzingalpha.com/three-inside-down-candlestick-pattern |
| 12,032 | three_inside_down | 3 | uptrend | bearish reversal | crypto | bullish mean reversion | atr-pattern_low | 2 | 66 | 199 | 113 | 1,186 | 0.436 | 0.15 | 0.57 | 0.48 | 3 | 4 | 10.50 | 11.52 | 9.56 | https://analyzingalpha.com/three-inside-down-candlestick-pattern |
| 12,033 | three_inside_down | 3 | uptrend | bearish reversal | crypto | bullish mean reversion | atr-pattern_low | 3 | 66 | 195 | 113 | 1,678 | 0.766 | 0.26 | 0.58 | 0.44 | 3 | 4 | 14.85 | 20.58 | 10.30 | https://analyzingalpha.com/three-inside-down-candlestick-pattern |
| 12,034 | three_inside_down | 3 | uptrend | bearish reversal | crypto | bullish mean reversion | atr-pattern_low | 4 | 66 | 193 | 113 | 2,091 | 0.946 | 0.32 | 0.59 | 0.39 | 3 | 4 | 18.50 | 27.18 | 12.97 | https://analyzingalpha.com/three-inside-down-candlestick-pattern |
| 12,035 | three_inside_down | 3 | uptrend | bearish reversal | crypto | bullish mean reversion | atr-pattern_low | 5 | 66 | 193 | 113 | 2,376 | 1.020 | 0.34 | 0.59 | 0.34 | 3 | 4 | 21.03 | 34.29 | 14.31 | https://analyzingalpha.com/three-inside-down-candlestick-pattern |
| 12,036 | three_inside_down | 3 | uptrend | bearish reversal | forex | bullish mean reversion | atr-pattern_low | 1 | 498 | 2,119 | 1,248 | 5,624 | 0.241 | 0.08 | 0.59 | 0.62 | 9 | 4 | 4.51 | 4.01 | 5.32 | https://analyzingalpha.com/three-inside-down-candlestick-pattern |
| 12,037 | three_inside_down | 3 | uptrend | bearish reversal | forex | bullish mean reversion | atr-pattern_low | 2 | 498 | 2,104 | 1,234 | 13,039 | 0.166 | 0.06 | 0.59 | 0.39 | 8 | 5 | 10.57 | 12.41 | 9.39 | https://analyzingalpha.com/three-inside-down-candlestick-pattern |
| 12,038 | three_inside_down | 3 | uptrend | bearish reversal | forex | bullish mean reversion | atr-pattern_low | 3 | 498 | 2,087 | 1,218 | 19,693 | 0.151 | 0.05 | 0.58 | 0.29 | 7 | 6 | 16.17 | 23.92 | 13.04 | https://analyzingalpha.com/three-inside-down-candlestick-pattern |
| 12,039 | three_inside_down | 3 | uptrend | bearish reversal | forex | bullish mean reversion | atr-pattern_low | 4 | 498 | 2,077 | 1,210 | 24,930 | 0.150 | 0.05 | 0.58 | 0.23 | 7 | 7 | 20.60 | 37.75 | 15.49 | https://analyzingalpha.com/three-inside-down-candlestick-pattern |
| 12,040 | three_inside_down | 3 | uptrend | bearish reversal | forex | bullish mean reversion | atr-pattern_low | 5 | 498 | 2,072 | 1,204 | 30,607 | 0.135 | 0.05 | 0.58 | 0.19 | 3 | 7 | 25.42 | 53.25 | 18.92 | https://analyzingalpha.com/three-inside-down-candlestick-pattern |
| 12,041 | three_inside_down | 3 | uptrend | bearish reversal | stock | bullish mean reversion | atr-pattern_low | 1 | 3,832 | 39,172 | 24,828 | 99,105 | 0.201 | 0.07 | 0.63 | 0.60 | 13 | 9 | 3.99 | 3.77 | 4.33 | https://analyzingalpha.com/three-inside-down-candlestick-pattern |
| 12,042 | three_inside_down | 3 | uptrend | bearish reversal | stock | bullish mean reversion | atr-pattern_low | 2 | 3,832 | 38,699 | 24,491 | 190,956 | 0.260 | 0.09 | 0.63 | 0.42 | 8 | 11 | 7.80 | 9.09 | 6.86 | https://analyzingalpha.com/three-inside-down-candlestick-pattern |
| 12,043 | three_inside_down | 3 | uptrend | bearish reversal | stock | bullish mean reversion | atr-pattern_low | 3 | 3,832 | 38,255 | 24,182 | 270,144 | 0.323 | 0.11 | 0.63 | 0.33 | 6 | 16 | 11.17 | 15.54 | 9.01 | https://analyzingalpha.com/three-inside-down-candlestick-pattern |
| 12,044 | three_inside_down | 3 | uptrend | bearish reversal | stock | bullish mean reversion | atr-pattern_low | 4 | 3,832 | 37,895 | 23,956 | 347,664 | 0.388 | 0.13 | 0.63 | 0.28 | 5 | 16 | 14.51 | 23.82 | 10.95 | https://analyzingalpha.com/three-inside-down-candlestick-pattern |
| 12,045 | three_inside_down | 3 | uptrend | bearish reversal | stock | bullish mean reversion | atr-pattern_low | 5 | 3,832 | 37,529 | 23,705 | 424,254 | 0.450 | 0.15 | 0.63 | 0.24 | 5 | 16 | 17.90 | 33.58 | 12.90 | https://analyzingalpha.com/three-inside-down-candlestick-pattern |
| 12,166 | three_inside_down | 3 | uptrend | bearish reversal | crypto | bearish reversal | high-close | 1 | 66 | 198 | 190 | 1,369 | -0.118 | -0.04 | 0.96 | 0.44 | 6 | 4 | 7.21 | 5.81 | 8.31 | https://analyzingalpha.com/three-inside-down-candlestick-pattern |
| 12,167 | three_inside_down | 3 | uptrend | bearish reversal | crypto | bearish reversal | high-close | 2 | 66 | 196 | 188 | 2,461 | -0.136 | -0.05 | 0.96 | 0.29 | 4 | 7 | 13.09 | 18.56 | 10.89 | https://analyzingalpha.com/three-inside-down-candlestick-pattern |
| 12,168 | three_inside_down | 3 | uptrend | bearish reversal | crypto | bearish reversal | high-close | 3 | 66 | 192 | 181 | 3,263 | -0.332 | -0.11 | 0.94 | 0.17 | 2 | 9 | 18.03 | 24.43 | 16.75 | https://analyzingalpha.com/three-inside-down-candlestick-pattern |
| 12,169 | three_inside_down | 3 | uptrend | bearish reversal | crypto | bearish reversal | high-close | 4 | 66 | 188 | 176 | 3,644 | -0.434 | -0.14 | 0.94 | 0.11 | 2 | 9 | 20.70 | 34.95 | 18.88 | https://analyzingalpha.com/three-inside-down-candlestick-pattern |
| 12,170 | three_inside_down | 3 | uptrend | bearish reversal | crypto | bearish reversal | high-close | 5 | 66 | 186 | 174 | 5,016 | -0.545 | -0.18 | 0.94 | 0.08 | 2 | 9 | 28.83 | 19.62 | 29.57 | https://analyzingalpha.com/three-inside-down-candlestick-pattern |
| 12,171 | three_inside_down | 3 | uptrend | bearish reversal | forex | bearish reversal | high-close | 1 | 498 | 2,104 | 2,049 | 13,159 | -0.002 | 0.00 | 0.97 | 0.50 | 8 | 6 | 6.42 | 6.23 | 6.61 | https://analyzingalpha.com/three-inside-down-candlestick-pattern |
| 12,172 | three_inside_down | 3 | uptrend | bearish reversal | forex | bearish reversal | high-close | 2 | 498 | 2,086 | 2,030 | 27,322 | -0.018 | -0.01 | 0.97 | 0.33 | 7 | 12 | 13.46 | 18.17 | 11.18 | https://analyzingalpha.com/three-inside-down-candlestick-pattern |
| 12,173 | three_inside_down | 3 | uptrend | bearish reversal | forex | bearish reversal | high-close | 3 | 498 | 2,071 | 2,011 | 44,618 | -0.037 | -0.01 | 0.97 | 0.24 | 5 | 12 | 22.19 | 34.21 | 18.37 | https://analyzingalpha.com/three-inside-down-candlestick-pattern |
| 12,174 | three_inside_down | 3 | uptrend | bearish reversal | forex | bearish reversal | high-close | 4 | 498 | 2,062 | 1,998 | 55,936 | -0.054 | -0.02 | 0.97 | 0.19 | 4 | 12 | 28.00 | 53.25 | 22.12 | https://analyzingalpha.com/three-inside-down-candlestick-pattern |
| 12,175 | three_inside_down | 3 | uptrend | bearish reversal | forex | bearish reversal | high-close | 5 | 498 | 2,055 | 1,988 | 66,381 | -0.100 | -0.03 | 0.97 | 0.15 | 4 | 12 | 33.39 | 73.85 | 26.23 | https://analyzingalpha.com/three-inside-down-candlestick-pattern |
| 12,176 | three_inside_down | 3 | uptrend | bearish reversal | stock | bearish reversal | high-close | 1 | 3,832 | 38,815 | 35,050 | 241,857 | -0.016 | -0.01 | 0.90 | 0.49 | 20 | 10 | 6.90 | 6.61 | 7.18 | https://analyzingalpha.com/three-inside-down-candlestick-pattern |
| 12,177 | three_inside_down | 3 | uptrend | bearish reversal | stock | bearish reversal | high-close | 2 | 3,832 | 38,357 | 34,554 | 439,421 | -0.050 | -0.02 | 0.90 | 0.32 | 13 | 14 | 12.72 | 15.29 | 11.53 | https://analyzingalpha.com/three-inside-down-candlestick-pattern |
| 12,178 | three_inside_down | 3 | uptrend | bearish reversal | stock | bearish reversal | high-close | 3 | 3,832 | 38,030 | 34,185 | 614,191 | -0.092 | -0.03 | 0.90 | 0.23 | 10 | 21 | 17.97 | 26.26 | 15.55 | https://analyzingalpha.com/three-inside-down-candlestick-pattern |
| 12,179 | three_inside_down | 3 | uptrend | bearish reversal | stock | bearish reversal | high-close | 4 | 3,832 | 37,681 | 33,801 | 781,086 | -0.134 | -0.04 | 0.90 | 0.17 | 9 | 25 | 23.11 | 39.71 | 19.62 | https://analyzingalpha.com/three-inside-down-candlestick-pattern |
| 12,180 | three_inside_down | 3 | uptrend | bearish reversal | stock | bearish reversal | high-close | 5 | 3,832 | 37,283 | 33,388 | 939,179 | -0.165 | -0.06 | 0.90 | 0.14 | 9 | 26 | 28.13 | 57.24 | 23.43 | https://analyzingalpha.com/three-inside-down-candlestick-pattern |
| 13,441 | three_inside_down | 3 | uptrend | bearish reversal | crypto | bullish continuation | low-high | 1 | 66 | 200 | 73 | 129 | -0.561 | -0.19 | 0.36 | 0.22 | 2 | 3 | 1.77 | 3.56 | 1.26 | https://analyzingalpha.com/three-inside-down-candlestick-pattern |
| 13,442 | three_inside_down | 3 | uptrend | bearish reversal | crypto | bullish continuation | low-high | 2 | 66 | 200 | 73 | 208 | -0.464 | -0.15 | 0.36 | 0.18 | 2 | 3 | 2.85 | 5.00 | 2.38 | https://analyzingalpha.com/three-inside-down-candlestick-pattern |
| 13,443 | three_inside_down | 3 | uptrend | bearish reversal | crypto | bullish continuation | low-high | 3 | 66 | 200 | 73 | 234 | -0.449 | -0.15 | 0.36 | 0.14 | 2 | 3 | 3.21 | 6.80 | 2.63 | https://analyzingalpha.com/three-inside-down-candlestick-pattern |
| 13,444 | three_inside_down | 3 | uptrend | bearish reversal | crypto | bullish continuation | low-high | 4 | 66 | 199 | 72 | 274 | -0.446 | -0.15 | 0.36 | 0.11 | 2 | 3 | 3.81 | 8.88 | 3.17 | https://analyzingalpha.com/three-inside-down-candlestick-pattern |
| 13,445 | three_inside_down | 3 | uptrend | bearish reversal | crypto | bullish continuation | low-high | 5 | 66 | 199 | 72 | 287 | -0.335 | -0.11 | 0.36 | 0.11 | 2 | 3 | 3.99 | 10.50 | 3.17 | https://analyzingalpha.com/three-inside-down-candlestick-pattern |
| 13,446 | three_inside_down | 3 | uptrend | bearish reversal | forex | bullish continuation | low-high | 1 | 498 | 2,119 | 626 | 1,564 | -0.677 | -0.23 | 0.30 | 0.16 | 2 | 6 | 2.50 | 4.72 | 2.07 | https://analyzingalpha.com/three-inside-down-candlestick-pattern |
| 13,447 | three_inside_down | 3 | uptrend | bearish reversal | forex | bullish continuation | low-high | 2 | 498 | 2,116 | 624 | 2,400 | -0.708 | -0.24 | 0.29 | 0.10 | 2 | 6 | 3.85 | 13.13 | 2.86 | https://analyzingalpha.com/three-inside-down-candlestick-pattern |
| 13,448 | three_inside_down | 3 | uptrend | bearish reversal | forex | bullish continuation | low-high | 3 | 498 | 2,115 | 622 | 2,699 | -0.692 | -0.23 | 0.29 | 0.08 | 2 | 6 | 4.34 | 19.43 | 3.11 | https://analyzingalpha.com/three-inside-down-candlestick-pattern |
| 13,449 | three_inside_down | 3 | uptrend | bearish reversal | forex | bullish continuation | low-high | 4 | 498 | 2,111 | 622 | 3,234 | -0.704 | -0.23 | 0.29 | 0.06 | 2 | 6 | 5.20 | 25.57 | 3.91 | https://analyzingalpha.com/three-inside-down-candlestick-pattern |
| 13,450 | three_inside_down | 3 | uptrend | bearish reversal | forex | bullish continuation | low-high | 5 | 498 | 2,111 | 622 | 3,820 | -0.710 | -0.24 | 0.29 | 0.05 | 1 | 6 | 6.14 | 39.77 | 4.44 | https://analyzingalpha.com/three-inside-down-candlestick-pattern |
| 13,451 | three_inside_down | 3 | uptrend | bearish reversal | stock | bullish continuation | low-high | 1 | 3,832 | 39,429 | 18,514 | 34,891 | -0.503 | -0.17 | 0.47 | 0.25 | 5 | 13 | 1.88 | 2.74 | 1.60 | https://analyzingalpha.com/three-inside-down-candlestick-pattern |
| 13,452 | three_inside_down | 3 | uptrend | bearish reversal | stock | bullish continuation | low-high | 2 | 3,832 | 39,355 | 18,483 | 50,073 | -0.454 | -0.15 | 0.47 | 0.18 | 4 | 15 | 2.71 | 5.19 | 2.15 | https://analyzingalpha.com/three-inside-down-candlestick-pattern |
| 13,453 | three_inside_down | 3 | uptrend | bearish reversal | stock | bullish continuation | low-high | 3 | 3,832 | 39,265 | 18,435 | 64,120 | -0.409 | -0.14 | 0.47 | 0.15 | 4 | 21 | 3.48 | 8.36 | 2.64 | https://analyzingalpha.com/three-inside-down-candlestick-pattern |
| 13,454 | three_inside_down | 3 | uptrend | bearish reversal | stock | bullish continuation | low-high | 4 | 3,832 | 39,186 | 18,401 | 77,860 | -0.388 | -0.13 | 0.47 | 0.12 | 3 | 21 | 4.23 | 12.30 | 3.10 | https://analyzingalpha.com/three-inside-down-candlestick-pattern |
| 13,455 | three_inside_down | 3 | uptrend | bearish reversal | stock | bullish continuation | low-high | 5 | 3,832 | 39,115 | 18,369 | 90,999 | -0.360 | -0.12 | 0.47 | 0.11 | 3 | 21 | 4.95 | 16.75 | 3.56 | https://analyzingalpha.com/three-inside-down-candlestick-pattern |
| Market | Strategy | Setup | Trades | Edge |
Pattern:
Pattern Bars:
Required Trend:
Traditional Strategy:
Market:
Strategy:
Setup:
RR:
Tickers:
Signals:
Trades:
Trade Bars:
Edge:
Edge Per Bar:
Confirm %:
Win %:
Cons Wins:
Cons Losses:
Avg. Trade Bars:
Avg. Win Bars:
Avg. Loss Bars:
Similar Candlestick Patterns
Traders confuse the three inside down patterns with other candlestick patterns.
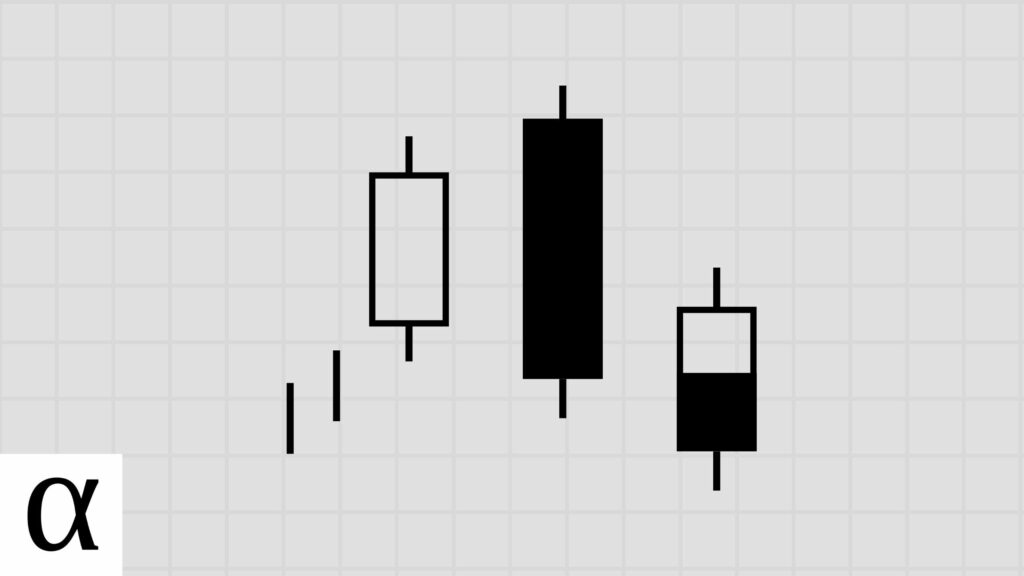
Three Inside Up vs. Three Inside Down

The three inside up candlestick pattern is a three-bar bullish reversal pattern opposite its bearish brother. The three inside up have a bearish candle, followed by a short engulfed candle, and a third candle that is bullish and closes above the first candle’s open.
Both of these patterns lead to short-term volatility before a trend continuation.
Three Outside Down vs. Three Inside Down
The three outside down candlestick pattern in a three-bar bearish reversal pattern that’s similar to the three inside down. The pattern consists of a bearish candle, a bullish candle engulfing the first, and a third candle closing higher than the previous.
This is easy to remember: the key differentiator is in the name.
Bearish Harami vs. Three Inside Down

The bearish harami is a two-bar bearish reversal candlestick pattern that shares a lot with the three inside down. A three inside down contains a bearish harami. The only difference between the bearish harami and the three inside down is that the three inside down have a bearish confirmation candle that closes below the first candle’s open.
Interestingly, the confirmation candle appears to reduce profits due to later entries.
The Bottom Line
The three inside down candlestick pattern supposedly signals a possible trend reversal. Still, the backtest suggests that more volatility is on the way. Traders should trade the pattern using a mean reversion system or wait until volatility contracts and trade in the direction of the range break.
Or you can skip this pattern and trade even better uptrend candlestick patterns.