The three inside up is a three-bar bullish reversal Japanese candlestick that’s best traded using bullish mean reversion strategies in the crypto, forex, and stock markets, according to decades of backtest data.
Uninformed candlestick technical analysts might be surprised to learn traditional trading methods lose money on this supposed bullish reversal pattern.
But what if I told you that you could make this inside up pattern profitable?
Would you be interested?
Keep reading to learn the best three inside up trading strategies by listening to the data.
What Is a Three Inside Up Candlestick Pattern?

The three inside up candle pattern is a three-bar bullish reversal pattern.
The pattern gets its name from its appearance on a candlestick chart—three candles, the second being inside the first and the last moving up.
The pattern is supposed to predict a trend reversal, but the data shows that volatility typically comes first.
But before we learn the best three inside up candlestick patterns, let’s understand how to identify this three-bar pattern on our candlestick charts.
How to Identify Three Inside Up Candlestick Patterns

The following are the requirements for a valid three inside up pattern:
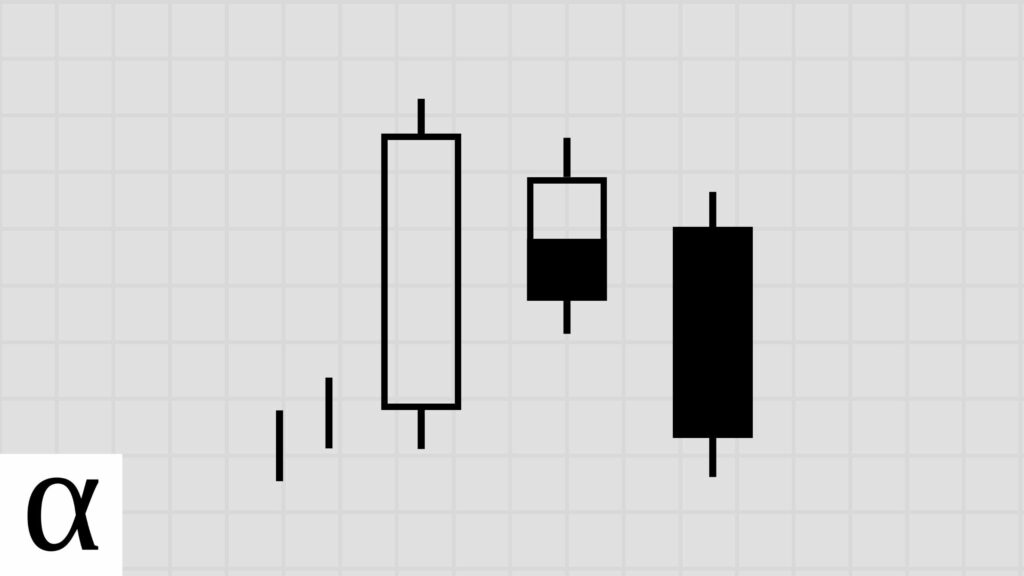
- The first candlestick is bearish and long.
- The second candle must have a small body engulfed by the first candle.
- The third bearish candle closes lower than the first candle’s opening price.
- The three inside up must occur during a downtrend.
Let’s decrypt this using the Ethereum (ETHUSD) daily chart on September 23rd, 2017.
The price is in an uptrend as it’s above the fifty-day moving average. The first candle is large and bullish. The second has a small real body and is engulfed by the previous, and the last candle closes lower than the first candle’s opening price, fulfilling the three inside up pattern requirements.
Now that we’ve got pattern identification down, let’s learn how to trade this three-bar pattern optimally.
How to Trade the Three Inside Up Candlestick Pattern
The best three inside up candlestick pattern trading strategy is a bullish mean reversion strategy expecting a longer-term move in the stock markets and a shorter bounce in the forex market.
Data-driven crypto traders may want to avoid this pattern due to a lack of pattern trading data.
Let’s first understand how traditional traders make their profits go down, and then we’ll learn the best three inside trading strategies to make our fortunes go up.
Three Inside Up Bullish Reversal Trade Setup
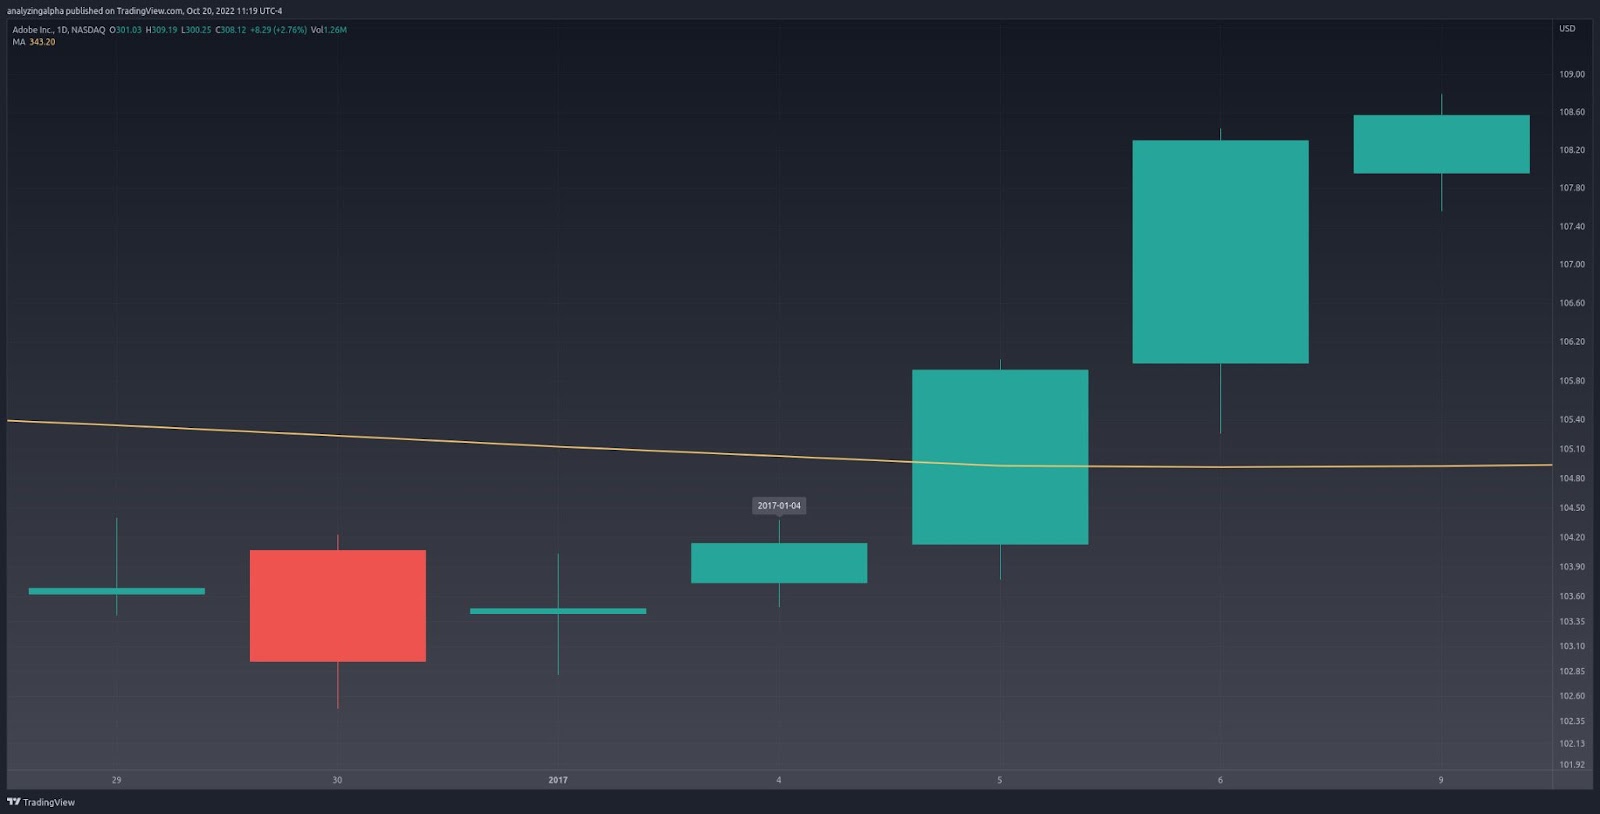
The pattern’s last close is below the fifty-day moving average, which we’re using to determine a bearish trend.
The first candle is a significant bearish candle, the second is small-bodied and engulfed, and the third candle is bullish and closes above the first candle’s open, fulfilling the three inside up pattern requirements.
With these three candlesticks configured in just the right order, traders traditionally enter long when the price moves above the third candle’s high and set a stop loss below the first candle’s low.
This paints a nice picture for traders executing this strategy on the Adobe (ADBE) daily candlestick chart on January 4th, 2017, but the data tells us the results aren’t so rosy.
Let’s learn the best three inside up trading strategies instead of going against history.
Three Inside Up Bullish Mean Reversion Trade Setup
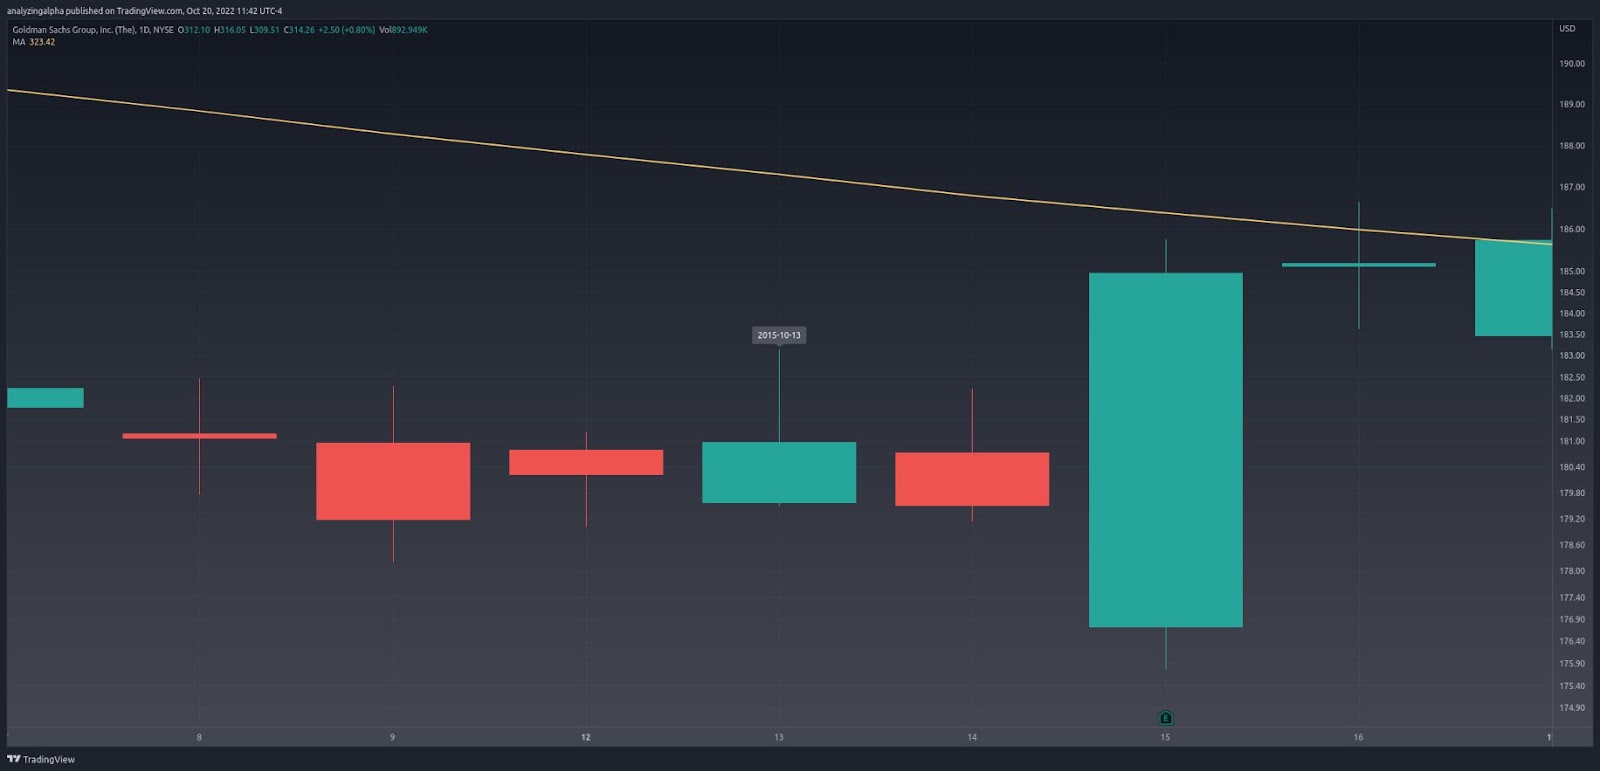
There’s a downtrend, a long red bearish candle, a second small-bodied candle engulfed by the previous, and a third green bullish candle closing above the first bearish candle’s open, completing the three inside up pattern.
Data-driven, professional traders enter long when the price moves below and back above the pattern’s low, setting a stop loss of one ATR.
Let’s use the Goldman Sachs (GS) October 13th, 2015, daily chart to learn how to make bank.
The pattern low occurs on the first candle at $178.21. The price moves below and then back above this low two days later, trigging an entry and serious profits.
The data shows that stock and crypto traders should expect a more extended move while forex traders should capture a quick gain.
While this example shows you how to capitalize on this pattern’s mean reverting tendencies, stock traders should avoid candlestick charting techniques in and around earning announcements.
Back to banking profits, what can history tell us about the best inside up trading strategy?
Does the Three Inside Up Candlestick Pattern Work? (Backtest Results)
Using the following rules, I backtested the three inside up candlestick pattern on the daily timeframe in the crypto, forex, and stock markets.
- A close above the 50-day SMA constitutes an uptrend.
- I tested risk-reward ranges from 1 to 5.
- The optimal risk-reward ratio is selected using profit per bar.
- Entry and exits are discussed in the how-to trade section above.
- Confirmation must occur within three days of the pattern signal.
Similar Candlestick Patterns
Traders confuse the three inside up patterns with other candlestick patterns. You must identify these unique differences to up-level your portfolio value.
Three Inside Down vs. Three Inside Up
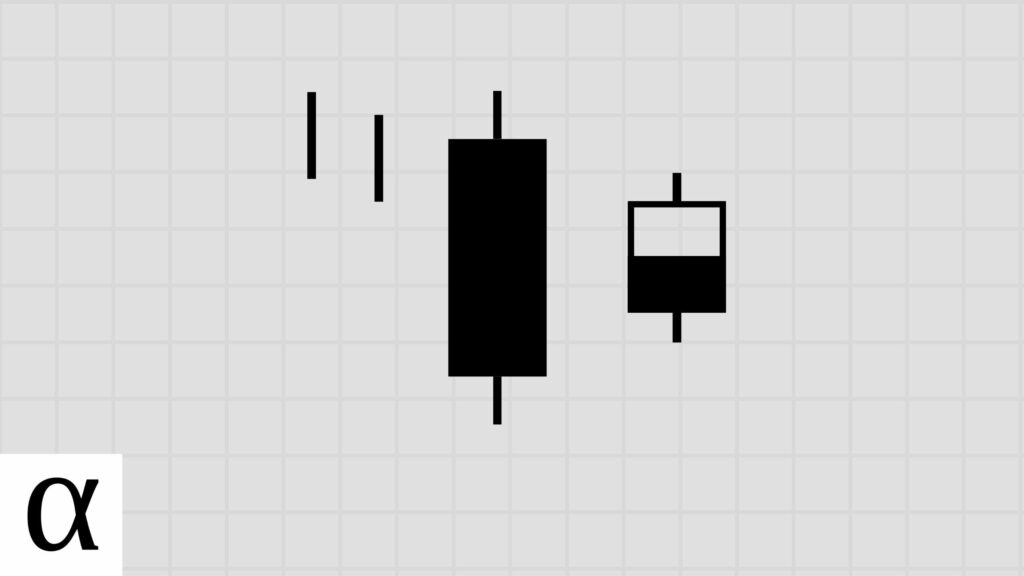
The three inside down candlestick pattern is a three-bar bearish reversal pattern and is the opposite of its bullish brethren. There’s a large bearish candle, a small-bodied engulf candle, and a third candle that is bearish and closes below the first candle’s open–precisely the opposite of what we just learned.
Both of these three candle patterns lead to volatility before a trend continuation.
Three Outside Up vs. Three Inside Up
The three outside up candlestick pattern in a three-bar bullish reversal pattern that’s related to the three inside up. The pattern consists of a bullish candle, a bearish candle engulfing the first, and a third candle closing lower than the prior.
The key differentiator is in the name, making this one easy to remember.
Bullish Harami vs. Three Inside Up
The bullish harami is a two-bar bullish reversal candlestick pattern often confused with the three inside up. The reason is that a three inside up contains a bullish harami, a bullish candle followed by a small-bodied engulfed candle.
The only difference between the bullish harami and the three inside up is that the three inside up patterns have a bullish confirmation candle that closes above the first candle’s open.
Interestingly, the three inside up’s confirmation candle appears to reduce potential profits.
The Bottom Line
The three inside up candlestick pattern is a rare, three-bar bullish reversal pattern. Still, the data suggest volatility is the likely outcome. Traders should trade the three inside up patterns using a mean reversion system, varying their risk-reward based on the market. Or better yet, data-driven traders should look for more frequent daily candlestick patterns.