The three outside down is a three-bar bearish reversal Japanese candlestick that’s best traded using bullish mean reversion strategies in the crypto and stock markets and short-term bearish mean reversion strategies in forex.
Uninformed three outside down candlestick chartists might be surprised to learn traditional trading methods lose money on this supposed bearish trend reversal.
But what if I told you that you could make these patterns profitable by thinking outside the box?
Would you be interested?
Keep reading if you want to learn history’s best three outside down trading strategies.
What Is a Three Outside Down Candlestick Pattern?
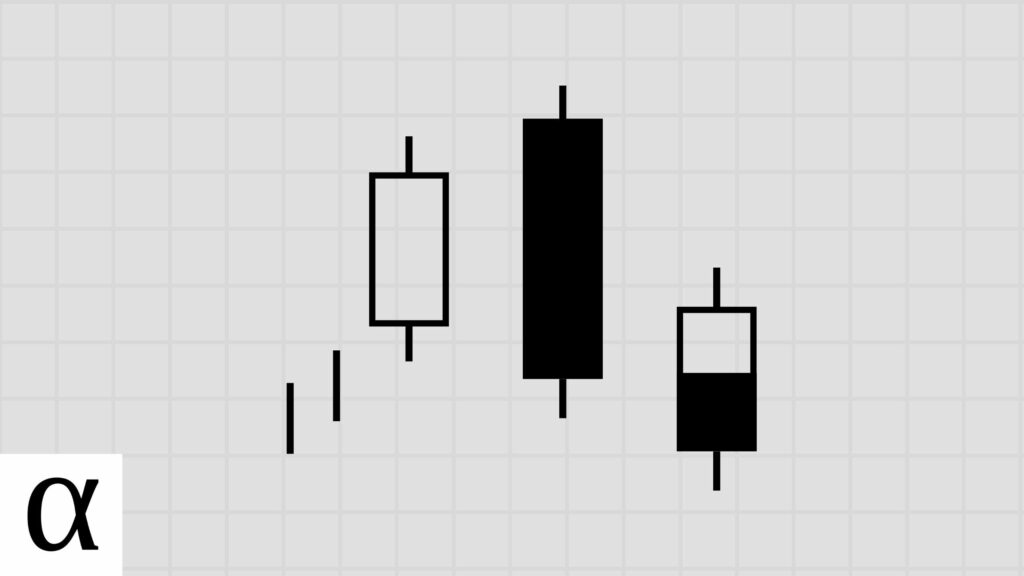
The three outside down candle pattern is a three-bar bearish reversal pattern.
The pattern gets its name from its appearance on a candlestick chart—three candles, with the second being outside the first and the last moving down.
Traders consider the pattern a bearish trend reversal, but history shows that volatility usually comes first.
But before we learn the best three outside down candlestick patterns, let’s learn to identify this three-bar pattern on our candlestick charts.
How to Identify Three Outside Down Candlestick Patterns
The following are the requirements for a valid three outside down pattern:
- The first candlestick is bullish.
- The second candle is bearish and engulfs the first.
- The third candle is bearish and closes lower than the first candle’s open.
- The three outside down must occur during an uptrend.
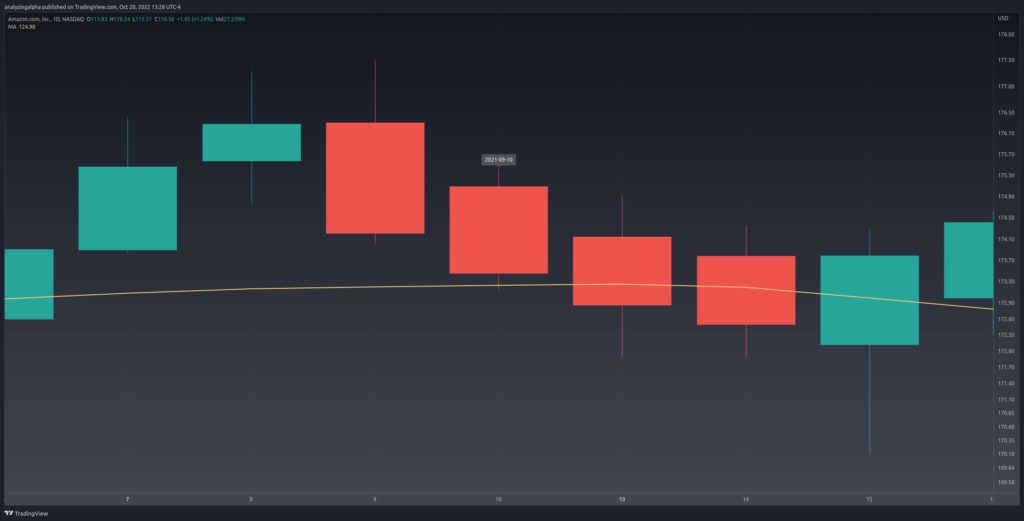
The three outside down candlestick pattern is visible on the Amazon (AMZN) daily chart on September 10th, 2021.
The price is in an uptrend as the final candle’s close is above the fifty-day moving average. The first candle is green and bullish. The second is bearish and engulfs the first, and the last candle closes lower than the first candle’s opening, fulfilling the three outside down pattern requirements.
Now that we can identify these three candlesticks, let’s learn how to trade them to optimize our portfolio profits.
How to Trade the Three Outside Down Candlestick Pattern
The best three outside down candlestick pattern trading strategy is a bullish mean reversion strategy in the crypto and stock markets and a bearish mean reversion strategy in the forex market.
Let’s first understand how traditional traders lose money, and then we’ll learn from history the best three outside down trading strategies.
Three Outside Down Bearish Reversal Trade Setup
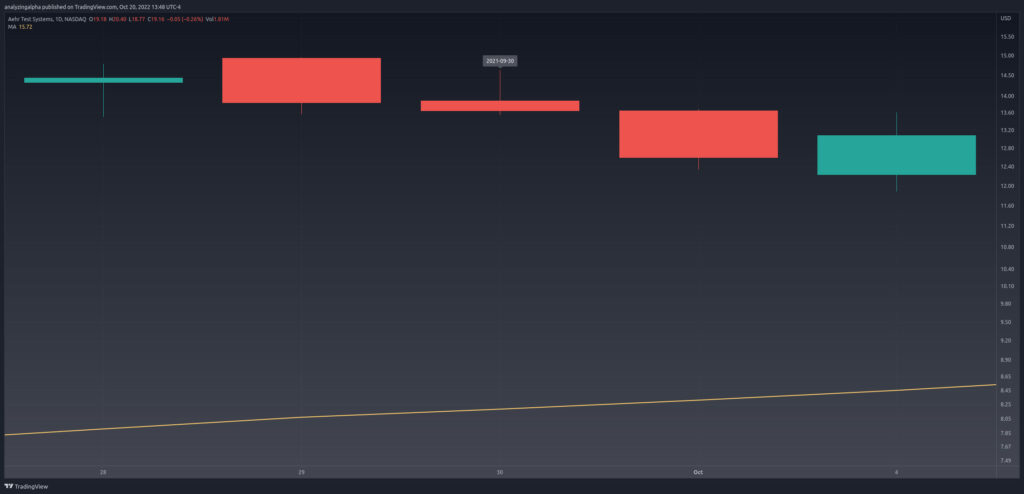
The pattern’s significantly above the fifty-day moving average, giving us a strong bullish trend.
The first candle is bullish, the second is a large red candle that engulfs the first, and the third is bearish and closes below the first candle’s open, fulfilling the three outside down pattern requirements.
With a bullish candle followed by two bearish candles configured just the way we need them, typical traders enter short when the price moves below the third candle’s low and set a stop loss above the second candle’s high.
Traders using traditional trade methods on the Aehr Test System’s (AEHR) daily candlestick chart on September 30th, 2021, luckily made money.
Professional stock and crypto traders that rely on history rhyming instead of luck go in the opposite direction.
Three Outside Down Bullish Mean Reversion Trade Setup
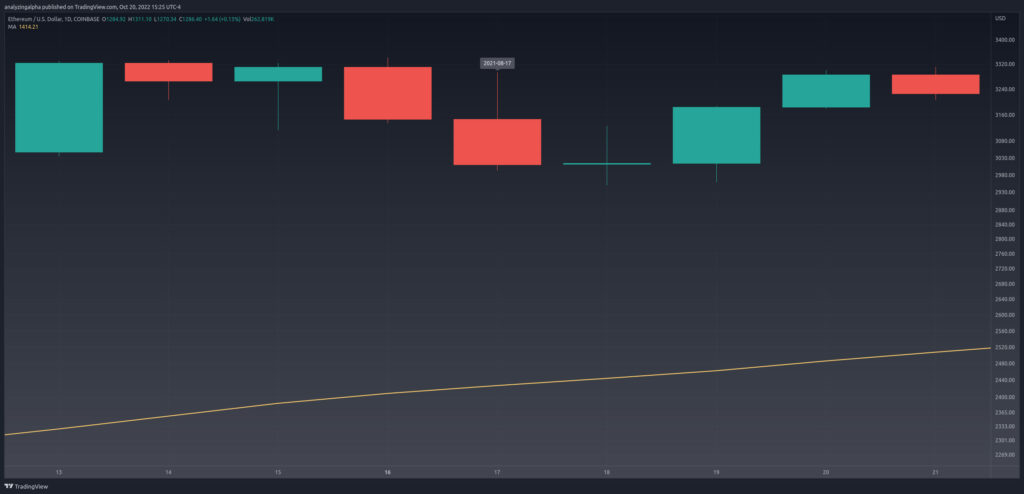
There’s an uptrend, a bullish candle, a second large-bodied bearish candling engulfing the prior, and a third red bearish candle closing below the first candle’s open, completing the three outside down pattern.
Informed traders enter long when the price moves below and pushes above the pattern’s low, setting a stop loss of one ATR.
We’ll use the Ethereum (ETHUSD) daily chart on August 17th, 2021, to clarify.
The pattern low is on the third candle at $2,992.15. The price moves below and then back above this price on the 18th, trigging an entry and with profit taking occurring two days later.
The data shows that stock and crypto traders should expect an extended move to take their profits to the ether, while forex traders should capture a quick gain in the other direction.
Three Outside Down Bearish Mean Reversion Trade Setup
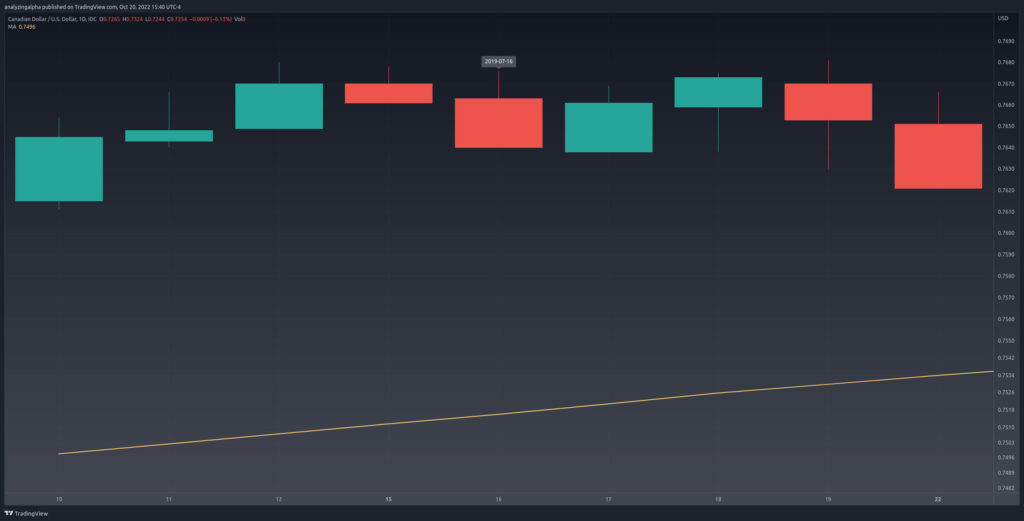
Data-driven forex traders enter short when the price moves up and then below the three outside down’s pattern high.
We’ll use the Canadian Dollar (CADUSD) chart on July 16th, 2019, to make this lucid.
The pattern’s high occurs on the first candle at 0.7681. The price moved above and back below this price on the 19th, and significant currency gains followed.
Speaking of gains, what does history tell us about the best three outside down trading strategies?
Does the Three Outside Down Candlestick Pattern Work? (Backtest Results)
I backtested the three outside down candlestick pattern on the daily timeframe in the crypto, forex, and stock markets using the following rules:
- A close above the 50-day SMA constitutes an uptrend.
- I tested risk-reward ranges from 1 to 5.
- The optimal risk-reward ratio is selected using profit per bar.
- Entry and exits are discussed in the how-to trade section above.
- Confirmation must occur within three days of the pattern signal.
| Id | Pattern | Pattern Bars | Required Trend | Traditional Strategy | Market | Strategy | Setup | RR | Tickers | Signals | Trades | Trade Bars | Edge | Edge Per Bar | Confirm % | Win % | Cons Wins | Cons Losses | Avg. Trade Bars | Avg. Win Bars | Avg. Loss Bars | Details |
|---|---|---|---|---|---|---|---|---|---|---|---|---|---|---|---|---|---|---|---|---|---|---|
| 8,221 | three_outside_down | 3 | uptrend | bearish reversal | crypto | bearish reversal | high-low | 1 | 142 | 884 | 594 | 6,126 | -0.064 | -0.02 | 0.67 | 0.47 | 7 | 5 | 10.31 | 8.65 | 11.76 | https://analyzingalpha.com/three-outside-down-candlestick-pattern |
| 8,222 | three_outside_down | 3 | uptrend | bearish reversal | crypto | bearish reversal | high-low | 2 | 142 | 841 | 555 | 11,266 | -0.168 | -0.06 | 0.66 | 0.28 | 6 | 7 | 20.30 | 25.46 | 18.34 | https://analyzingalpha.com/three-outside-down-candlestick-pattern |
| 8,223 | three_outside_down | 3 | uptrend | bearish reversal | crypto | bearish reversal | high-low | 3 | 142 | 798 | 522 | 15,520 | -0.314 | -0.10 | 0.65 | 0.17 | 5 | 9 | 29.73 | 39.22 | 27.75 | https://analyzingalpha.com/three-outside-down-candlestick-pattern |
| 8,224 | three_outside_down | 3 | uptrend | bearish reversal | crypto | bearish reversal | high-low | 4 | 142 | 762 | 496 | 17,952 | -0.396 | -0.13 | 0.65 | 0.12 | 3 | 9 | 36.19 | 46.63 | 34.76 | https://analyzingalpha.com/three-outside-down-candlestick-pattern |
| 8,225 | three_outside_down | 3 | uptrend | bearish reversal | crypto | bearish reversal | high-low | 5 | 142 | 747 | 482 | 19,430 | -0.455 | -0.15 | 0.65 | 0.09 | 3 | 9 | 40.31 | 77.93 | 36.53 | https://analyzingalpha.com/three-outside-down-candlestick-pattern |
| 8,226 | three_outside_down | 3 | uptrend | bearish reversal | forex | bearish reversal | high-low | 1 | 691 | 9,856 | 7,110 | 86,612 | -0.043 | -0.01 | 0.72 | 0.48 | 16 | 12 | 12.18 | 12.75 | 11.66 | https://analyzingalpha.com/three-outside-down-candlestick-pattern |
| 8,227 | three_outside_down | 3 | uptrend | bearish reversal | forex | bearish reversal | high-low | 2 | 691 | 9,646 | 6,929 | 158,684 | -0.096 | -0.03 | 0.72 | 0.30 | 11 | 13 | 22.90 | 31.32 | 19.25 | https://analyzingalpha.com/three-outside-down-candlestick-pattern |
| 8,228 | three_outside_down | 3 | uptrend | bearish reversal | forex | bearish reversal | high-low | 3 | 691 | 9,372 | 6,692 | 226,156 | -0.123 | -0.04 | 0.71 | 0.22 | 11 | 17 | 33.79 | 55.19 | 27.78 | https://analyzingalpha.com/three-outside-down-candlestick-pattern |
| 8,229 | three_outside_down | 3 | uptrend | bearish reversal | forex | bearish reversal | high-low | 4 | 691 | 9,137 | 6,499 | 280,585 | -0.150 | -0.05 | 0.71 | 0.17 | 10 | 20 | 43.17 | 87.62 | 34.05 | https://analyzingalpha.com/three-outside-down-candlestick-pattern |
| 8,230 | three_outside_down | 3 | uptrend | bearish reversal | forex | bearish reversal | high-low | 5 | 691 | 8,878 | 6,276 | 323,976 | -0.165 | -0.06 | 0.71 | 0.14 | 8 | 21 | 51.62 | 125.13 | 39.74 | https://analyzingalpha.com/three-outside-down-candlestick-pattern |
| 8,231 | three_outside_down | 3 | uptrend | bearish reversal | stock | bearish reversal | high-low | 1 | 4,709 | 107,189 | 77,648 | 718,732 | -0.043 | -0.01 | 0.72 | 0.48 | 27 | 12 | 9.26 | 9.18 | 9.33 | https://analyzingalpha.com/three-outside-down-candlestick-pattern |
| 8,232 | three_outside_down | 3 | uptrend | bearish reversal | stock | bearish reversal | high-low | 2 | 4,709 | 103,947 | 75,037 | 1,314,280 | -0.078 | -0.03 | 0.72 | 0.31 | 21 | 26 | 17.52 | 22.61 | 15.27 | https://analyzingalpha.com/three-outside-down-candlestick-pattern |
| 8,233 | three_outside_down | 3 | uptrend | bearish reversal | stock | bearish reversal | high-low | 3 | 4,709 | 100,735 | 72,391 | 1,847,693 | -0.123 | -0.04 | 0.72 | 0.22 | 16 | 29 | 25.52 | 40.74 | 21.25 | https://analyzingalpha.com/three-outside-down-candlestick-pattern |
| 8,234 | three_outside_down | 3 | uptrend | bearish reversal | stock | bearish reversal | high-low | 4 | 4,709 | 97,265 | 69,519 | 2,278,696 | -0.166 | -0.06 | 0.71 | 0.17 | 13 | 31 | 32.78 | 60.57 | 27.23 | https://analyzingalpha.com/three-outside-down-candlestick-pattern |
| 8,235 | three_outside_down | 3 | uptrend | bearish reversal | stock | bearish reversal | high-low | 5 | 4,709 | 94,203 | 67,046 | 2,653,815 | -0.215 | -0.07 | 0.71 | 0.13 | 11 | 41 | 39.58 | 82.83 | 33.06 | https://analyzingalpha.com/three-outside-down-candlestick-pattern |
| 8,276 | three_outside_down | 3 | uptrend | bearish reversal | crypto | bullish mean reversion | atr-pattern_low | 1 | 142 | 905 | 504 | 2,349 | 0.122 | 0.04 | 0.56 | 0.56 | 6 | 3 | 4.66 | 4.42 | 4.97 | https://analyzingalpha.com/three-outside-down-candlestick-pattern |
| 8,277 | three_outside_down | 3 | uptrend | bearish reversal | crypto | bullish mean reversion | atr-pattern_low | 2 | 142 | 875 | 481 | 4,349 | 0.190 | 0.06 | 0.55 | 0.40 | 6 | 6 | 9.04 | 10.88 | 7.84 | https://analyzingalpha.com/three-outside-down-candlestick-pattern |
| 8,278 | three_outside_down | 3 | uptrend | bearish reversal | crypto | bullish mean reversion | atr-pattern_low | 3 | 142 | 857 | 467 | 5,539 | 0.277 | 0.09 | 0.54 | 0.32 | 2 | 6 | 11.86 | 15.63 | 10.09 | https://analyzingalpha.com/three-outside-down-candlestick-pattern |
| 8,279 | three_outside_down | 3 | uptrend | bearish reversal | crypto | bullish mean reversion | atr-pattern_low | 4 | 142 | 845 | 459 | 6,357 | 0.296 | 0.10 | 0.54 | 0.26 | 2 | 7 | 13.85 | 18.82 | 12.11 | https://analyzingalpha.com/three-outside-down-candlestick-pattern |
| 8,280 | three_outside_down | 3 | uptrend | bearish reversal | crypto | bullish mean reversion | atr-pattern_low | 5 | 142 | 841 | 455 | 7,045 | 0.330 | 0.11 | 0.54 | 0.22 | 2 | 7 | 15.48 | 20.44 | 14.07 | https://analyzingalpha.com/three-outside-down-candlestick-pattern |
| 8,281 | three_outside_down | 3 | uptrend | bearish reversal | forex | bullish mean reversion | atr-pattern_low | 1 | 691 | 10,113 | 6,036 | 26,532 | 0.220 | 0.07 | 0.60 | 0.61 | 12 | 7 | 4.40 | 4.08 | 4.90 | https://analyzingalpha.com/three-outside-down-candlestick-pattern |
| 8,282 | three_outside_down | 3 | uptrend | bearish reversal | forex | bullish mean reversion | atr-pattern_low | 2 | 691 | 9,931 | 5,927 | 57,009 | 0.174 | 0.06 | 0.60 | 0.39 | 7 | 12 | 9.62 | 11.27 | 8.55 | https://analyzingalpha.com/three-outside-down-candlestick-pattern |
| 8,283 | three_outside_down | 3 | uptrend | bearish reversal | forex | bullish mean reversion | atr-pattern_low | 3 | 691 | 9,691 | 5,773 | 84,684 | 0.154 | 0.05 | 0.60 | 0.29 | 6 | 13 | 14.67 | 21.48 | 11.91 | https://analyzingalpha.com/three-outside-down-candlestick-pattern |
| 8,284 | three_outside_down | 3 | uptrend | bearish reversal | forex | bullish mean reversion | atr-pattern_low | 4 | 691 | 9,505 | 5,647 | 107,089 | 0.142 | 0.05 | 0.59 | 0.23 | 4 | 13 | 18.96 | 31.53 | 15.24 | https://analyzingalpha.com/three-outside-down-candlestick-pattern |
| 8,285 | three_outside_down | 3 | uptrend | bearish reversal | forex | bullish mean reversion | atr-pattern_low | 5 | 691 | 9,341 | 5,531 | 128,158 | 0.140 | 0.05 | 0.59 | 0.19 | 4 | 15 | 23.17 | 46.35 | 17.75 | https://analyzingalpha.com/three-outside-down-candlestick-pattern |
| 8,286 | three_outside_down | 3 | uptrend | bearish reversal | stock | bullish mean reversion | atr-pattern_low | 1 | 4,709 | 110,360 | 66,424 | 256,293 | 0.199 | 0.07 | 0.60 | 0.60 | 15 | 7 | 3.86 | 3.63 | 4.20 | https://analyzingalpha.com/three-outside-down-candlestick-pattern |
| 8,287 | three_outside_down | 3 | uptrend | bearish reversal | stock | bullish mean reversion | atr-pattern_low | 2 | 4,709 | 107,751 | 64,764 | 475,994 | 0.250 | 0.08 | 0.60 | 0.42 | 11 | 17 | 7.35 | 8.48 | 6.55 | https://analyzingalpha.com/three-outside-down-candlestick-pattern |
| 8,288 | three_outside_down | 3 | uptrend | bearish reversal | stock | bullish mean reversion | atr-pattern_low | 3 | 4,709 | 105,330 | 63,196 | 659,063 | 0.295 | 0.10 | 0.60 | 0.33 | 7 | 17 | 10.43 | 14.31 | 8.56 | https://analyzingalpha.com/three-outside-down-candlestick-pattern |
| 8,289 | three_outside_down | 3 | uptrend | bearish reversal | stock | bullish mean reversion | atr-pattern_low | 4 | 4,709 | 103,145 | 61,813 | 828,167 | 0.350 | 0.12 | 0.60 | 0.27 | 7 | 22 | 13.40 | 21.40 | 10.44 | https://analyzingalpha.com/three-outside-down-candlestick-pattern |
| 8,290 | three_outside_down | 3 | uptrend | bearish reversal | stock | bullish mean reversion | atr-pattern_low | 5 | 4,709 | 101,187 | 60,577 | 979,791 | 0.400 | 0.13 | 0.60 | 0.23 | 7 | 22 | 16.17 | 29.48 | 12.12 | https://analyzingalpha.com/three-outside-down-candlestick-pattern |
| 9,581 | three_outside_down | 3 | uptrend | bearish reversal | crypto | bullish continuation | low-high | 1 | 142 | 939 | 500 | 858 | -0.702 | -0.23 | 0.53 | 0.15 | 2 | 13 | 1.72 | 2.74 | 1.54 | https://analyzingalpha.com/three-outside-down-candlestick-pattern |
| 9,582 | three_outside_down | 3 | uptrend | bearish reversal | crypto | bullish continuation | low-high | 2 | 142 | 938 | 499 | 1,071 | -0.692 | -0.23 | 0.53 | 0.10 | 2 | 13 | 2.15 | 4.83 | 1.83 | https://analyzingalpha.com/three-outside-down-candlestick-pattern |
| 9,583 | three_outside_down | 3 | uptrend | bearish reversal | crypto | bullish continuation | low-high | 3 | 142 | 937 | 498 | 1,165 | -0.634 | -0.21 | 0.53 | 0.09 | 2 | 13 | 2.34 | 6.85 | 1.88 | https://analyzingalpha.com/three-outside-down-candlestick-pattern |
| 9,584 | three_outside_down | 3 | uptrend | bearish reversal | crypto | bullish continuation | low-high | 4 | 142 | 935 | 496 | 1,233 | -0.554 | -0.18 | 0.53 | 0.09 | 2 | 13 | 2.49 | 7.86 | 1.96 | https://analyzingalpha.com/three-outside-down-candlestick-pattern |
| 9,585 | three_outside_down | 3 | uptrend | bearish reversal | crypto | bullish continuation | low-high | 5 | 142 | 933 | 495 | 1,300 | -0.515 | -0.17 | 0.53 | 0.08 | 2 | 13 | 2.63 | 9.65 | 2.01 | https://analyzingalpha.com/three-outside-down-candlestick-pattern |
| 9,586 | three_outside_down | 3 | uptrend | bearish reversal | forex | bullish continuation | low-high | 1 | 691 | 10,173 | 4,526 | 9,638 | -0.697 | -0.23 | 0.44 | 0.15 | 4 | 18 | 2.13 | 4.59 | 1.69 | https://analyzingalpha.com/three-outside-down-candlestick-pattern |
| 9,587 | three_outside_down | 3 | uptrend | bearish reversal | forex | bullish continuation | low-high | 2 | 691 | 10,140 | 4,511 | 13,532 | -0.698 | -0.23 | 0.44 | 0.10 | 3 | 18 | 3.00 | 9.62 | 2.26 | https://analyzingalpha.com/three-outside-down-candlestick-pattern |
| 9,588 | three_outside_down | 3 | uptrend | bearish reversal | forex | bullish continuation | low-high | 3 | 691 | 10,110 | 4,495 | 17,749 | -0.692 | -0.23 | 0.44 | 0.08 | 3 | 18 | 3.95 | 13.87 | 3.13 | https://analyzingalpha.com/three-outside-down-candlestick-pattern |
| 9,589 | three_outside_down | 3 | uptrend | bearish reversal | forex | bullish continuation | low-high | 4 | 691 | 10,072 | 4,474 | 20,347 | -0.704 | -0.23 | 0.44 | 0.06 | 3 | 18 | 4.55 | 20.19 | 3.56 | https://analyzingalpha.com/three-outside-down-candlestick-pattern |
| 9,590 | three_outside_down | 3 | uptrend | bearish reversal | forex | bullish continuation | low-high | 5 | 691 | 10,052 | 4,464 | 22,921 | -0.690 | -0.23 | 0.44 | 0.05 | 3 | 18 | 5.13 | 28.44 | 3.85 | https://analyzingalpha.com/three-outside-down-candlestick-pattern |
| 9,591 | three_outside_down | 3 | uptrend | bearish reversal | stock | bullish continuation | low-high | 1 | 4,709 | 112,093 | 64,957 | 96,760 | -0.599 | -0.20 | 0.58 | 0.20 | 6 | 31 | 1.49 | 2.18 | 1.32 | https://analyzingalpha.com/three-outside-down-candlestick-pattern |
| 9,592 | three_outside_down | 3 | uptrend | bearish reversal | stock | bullish continuation | low-high | 2 | 4,709 | 111,779 | 64,788 | 126,394 | -0.546 | -0.18 | 0.58 | 0.15 | 4 | 31 | 1.95 | 3.83 | 1.61 | https://analyzingalpha.com/three-outside-down-candlestick-pattern |
| 9,593 | three_outside_down | 3 | uptrend | bearish reversal | stock | bullish continuation | low-high | 3 | 4,709 | 111,389 | 64,563 | 154,383 | -0.508 | -0.17 | 0.58 | 0.12 | 4 | 34 | 2.39 | 5.94 | 1.89 | https://analyzingalpha.com/three-outside-down-candlestick-pattern |
| 9,594 | three_outside_down | 3 | uptrend | bearish reversal | stock | bullish continuation | low-high | 4 | 4,709 | 111,031 | 64,351 | 180,944 | -0.480 | -0.16 | 0.58 | 0.11 | 4 | 36 | 2.81 | 8.56 | 2.13 | https://analyzingalpha.com/three-outside-down-candlestick-pattern |
| 9,595 | three_outside_down | 3 | uptrend | bearish reversal | stock | bullish continuation | low-high | 5 | 4,709 | 110,728 | 64,174 | 205,101 | -0.445 | -0.15 | 0.58 | 0.09 | 4 | 41 | 3.20 | 11.24 | 2.37 | https://analyzingalpha.com/three-outside-down-candlestick-pattern |
| 10,621 | three_outside_down | 3 | uptrend | bearish reversal | crypto | bullish continuation | low-close | 1 | 142 | 948 | 931 | 1,338 | -0.738 | -0.25 | 0.98 | 0.13 | 2 | 17 | 1.44 | 2.84 | 1.22 | https://analyzingalpha.com/three-outside-down-candlestick-pattern |
| 10,622 | three_outside_down | 3 | uptrend | bearish reversal | crypto | bullish continuation | low-close | 2 | 142 | 945 | 928 | 1,565 | -0.694 | -0.23 | 0.98 | 0.10 | 1 | 17 | 1.69 | 4.92 | 1.31 | https://analyzingalpha.com/three-outside-down-candlestick-pattern |
| 10,623 | three_outside_down | 3 | uptrend | bearish reversal | crypto | bullish continuation | low-close | 3 | 142 | 944 | 926 | 1,622 | -0.665 | -0.22 | 0.98 | 0.09 | 1 | 17 | 1.75 | 5.87 | 1.37 | https://analyzingalpha.com/three-outside-down-candlestick-pattern |
| 10,624 | three_outside_down | 3 | uptrend | bearish reversal | crypto | bullish continuation | low-close | 4 | 142 | 941 | 922 | 1,686 | -0.680 | -0.23 | 0.98 | 0.07 | 1 | 19 | 1.83 | 6.62 | 1.50 | https://analyzingalpha.com/three-outside-down-candlestick-pattern |
| 10,625 | three_outside_down | 3 | uptrend | bearish reversal | crypto | bullish continuation | low-close | 5 | 142 | 937 | 918 | 1,821 | -0.655 | -0.22 | 0.98 | 0.06 | 1 | 19 | 1.98 | 8.94 | 1.57 | https://analyzingalpha.com/three-outside-down-candlestick-pattern |
| 10,626 | three_outside_down | 3 | uptrend | bearish reversal | forex | bullish continuation | low-close | 1 | 691 | 10,219 | 10,131 | 12,807 | -0.778 | -0.26 | 0.99 | 0.11 | 2 | 31 | 1.26 | 2.12 | 1.16 | https://analyzingalpha.com/three-outside-down-candlestick-pattern |
| 10,627 | three_outside_down | 3 | uptrend | bearish reversal | forex | bullish continuation | low-close | 2 | 691 | 10,199 | 10,109 | 15,481 | -0.736 | -0.25 | 0.99 | 0.09 | 2 | 36 | 1.53 | 3.31 | 1.36 | https://analyzingalpha.com/three-outside-down-candlestick-pattern |
| 10,628 | three_outside_down | 3 | uptrend | bearish reversal | forex | bullish continuation | low-close | 3 | 691 | 10,184 | 10,093 | 17,555 | -0.717 | -0.24 | 0.99 | 0.07 | 2 | 36 | 1.74 | 4.33 | 1.54 | https://analyzingalpha.com/three-outside-down-candlestick-pattern |
| 10,629 | three_outside_down | 3 | uptrend | bearish reversal | forex | bullish continuation | low-close | 4 | 691 | 10,169 | 10,077 | 18,958 | -0.704 | -0.23 | 0.99 | 0.06 | 2 | 36 | 1.88 | 5.84 | 1.63 | https://analyzingalpha.com/three-outside-down-candlestick-pattern |
| 10,630 | three_outside_down | 3 | uptrend | bearish reversal | forex | bullish continuation | low-close | 5 | 691 | 10,161 | 10,069 | 20,201 | -0.695 | -0.23 | 0.99 | 0.05 | 2 | 36 | 2.01 | 7.54 | 1.71 | https://analyzingalpha.com/three-outside-down-candlestick-pattern |
| 10,631 | three_outside_down | 3 | uptrend | bearish reversal | stock | bullish continuation | low-close | 1 | 4,709 | 113,185 | 105,563 | 117,002 | -0.740 | -0.25 | 0.93 | 0.13 | 4 | 49 | 1.11 | 1.42 | 1.06 | https://analyzingalpha.com/three-outside-down-candlestick-pattern |
| 10,632 | three_outside_down | 3 | uptrend | bearish reversal | stock | bullish continuation | low-close | 2 | 4,709 | 113,094 | 105,476 | 128,657 | -0.662 | -0.22 | 0.93 | 0.11 | 4 | 49 | 1.22 | 1.88 | 1.14 | https://analyzingalpha.com/three-outside-down-candlestick-pattern |
| 10,633 | three_outside_down | 3 | uptrend | bearish reversal | stock | bullish continuation | low-close | 3 | 4,709 | 113,004 | 105,391 | 139,063 | -0.594 | -0.20 | 0.93 | 0.10 | 4 | 51 | 1.32 | 2.41 | 1.20 | https://analyzingalpha.com/three-outside-down-candlestick-pattern |
| 10,634 | three_outside_down | 3 | uptrend | bearish reversal | stock | bullish continuation | low-close | 4 | 4,709 | 112,912 | 105,302 | 149,394 | -0.538 | -0.18 | 0.93 | 0.09 | 3 | 55 | 1.42 | 2.99 | 1.26 | https://analyzingalpha.com/three-outside-down-candlestick-pattern |
| 10,635 | three_outside_down | 3 | uptrend | bearish reversal | stock | bullish continuation | low-close | 5 | 4,709 | 112,813 | 105,208 | 159,265 | -0.495 | -0.17 | 0.93 | 0.09 | 3 | 55 | 1.51 | 3.63 | 1.32 | https://analyzingalpha.com/three-outside-down-candlestick-pattern |
| 11,361 | three_outside_down | 3 | uptrend | bearish reversal | crypto | bearish reversal | high-close | 1 | 142 | 892 | 879 | 7,710 | -0.058 | -0.02 | 0.99 | 0.47 | 12 | 6 | 8.77 | 7.13 | 10.24 | https://analyzingalpha.com/three-outside-down-candlestick-pattern |
| 11,362 | three_outside_down | 3 | uptrend | bearish reversal | crypto | bearish reversal | high-close | 2 | 142 | 847 | 822 | 12,286 | -0.064 | -0.02 | 0.97 | 0.31 | 9 | 12 | 14.95 | 15.83 | 14.55 | https://analyzingalpha.com/three-outside-down-candlestick-pattern |
| 11,363 | three_outside_down | 3 | uptrend | bearish reversal | crypto | bearish reversal | high-close | 3 | 142 | 812 | 774 | 16,267 | -0.157 | -0.05 | 0.95 | 0.21 | 7 | 12 | 21.02 | 26.71 | 19.50 | https://analyzingalpha.com/three-outside-down-candlestick-pattern |
| 11,364 | three_outside_down | 3 | uptrend | bearish reversal | crypto | bearish reversal | high-close | 4 | 142 | 766 | 717 | 19,924 | -0.312 | -0.10 | 0.94 | 0.14 | 5 | 12 | 27.79 | 48.19 | 24.56 | https://analyzingalpha.com/three-outside-down-candlestick-pattern |
| 11,365 | three_outside_down | 3 | uptrend | bearish reversal | crypto | bearish reversal | high-close | 5 | 142 | 725 | 673 | 23,383 | -0.415 | -0.14 | 0.93 | 0.10 | 3 | 12 | 34.74 | 56.68 | 32.40 | https://analyzingalpha.com/three-outside-down-candlestick-pattern |
| 11,366 | three_outside_down | 3 | uptrend | bearish reversal | forex | bearish reversal | high-close | 1 | 691 | 9,851 | 9,636 | 81,673 | 0.035 | 0.01 | 0.98 | 0.52 | 23 | 13 | 8.48 | 8.66 | 8.28 | https://analyzingalpha.com/three-outside-down-candlestick-pattern |
| 11,367 | three_outside_down | 3 | uptrend | bearish reversal | forex | bearish reversal | high-close | 2 | 691 | 9,589 | 9,346 | 155,386 | 0.010 | 0.00 | 0.97 | 0.34 | 15 | 16 | 16.63 | 20.88 | 14.49 | https://analyzingalpha.com/three-outside-down-candlestick-pattern |
| 11,368 | three_outside_down | 3 | uptrend | bearish reversal | forex | bearish reversal | high-close | 3 | 691 | 9,356 | 9,070 | 227,338 | -0.006 | 0.00 | 0.97 | 0.25 | 12 | 19 | 25.06 | 39.00 | 20.47 | https://analyzingalpha.com/three-outside-down-candlestick-pattern |
| 11,369 | three_outside_down | 3 | uptrend | bearish reversal | forex | bearish reversal | high-close | 4 | 691 | 9,105 | 8,805 | 283,616 | -0.038 | -0.01 | 0.97 | 0.19 | 10 | 19 | 32.21 | 58.67 | 25.88 | https://analyzingalpha.com/three-outside-down-candlestick-pattern |
| 11,370 | three_outside_down | 3 | uptrend | bearish reversal | forex | bearish reversal | high-close | 5 | 691 | 8,893 | 8,554 | 328,063 | -0.050 | -0.02 | 0.96 | 0.16 | 9 | 22 | 38.35 | 84.23 | 29.76 | https://analyzingalpha.com/three-outside-down-candlestick-pattern |
| 11,371 | three_outside_down | 3 | uptrend | bearish reversal | stock | bearish reversal | high-close | 1 | 4,709 | 107,829 | 97,313 | 699,543 | -0.016 | -0.01 | 0.90 | 0.49 | 33 | 14 | 7.19 | 6.92 | 7.45 | https://analyzingalpha.com/three-outside-down-candlestick-pattern |
| 11,372 | three_outside_down | 3 | uptrend | bearish reversal | stock | bearish reversal | high-close | 2 | 4,709 | 104,079 | 93,703 | 1,275,617 | -0.034 | -0.01 | 0.90 | 0.32 | 23 | 19 | 13.61 | 16.84 | 12.08 | https://analyzingalpha.com/three-outside-down-candlestick-pattern |
| 11,373 | three_outside_down | 3 | uptrend | bearish reversal | stock | bearish reversal | high-close | 3 | 4,709 | 101,129 | 90,687 | 1,776,965 | -0.068 | -0.02 | 0.90 | 0.23 | 19 | 33 | 19.59 | 29.75 | 16.49 | https://analyzingalpha.com/three-outside-down-candlestick-pattern |
| 11,374 | three_outside_down | 3 | uptrend | bearish reversal | stock | bearish reversal | high-close | 4 | 4,709 | 98,062 | 87,582 | 2,221,414 | -0.096 | -0.03 | 0.89 | 0.18 | 17 | 34 | 25.36 | 45.48 | 20.93 | https://analyzingalpha.com/three-outside-down-candlestick-pattern |
| 11,375 | three_outside_down | 3 | uptrend | bearish reversal | stock | bearish reversal | high-close | 5 | 4,709 | 94,950 | 84,512 | 2,609,257 | -0.140 | -0.05 | 0.89 | 0.14 | 14 | 47 | 30.87 | 62.36 | 25.57 | https://analyzingalpha.com/three-outside-down-candlestick-pattern |
| 12,086 | three_outside_down | 3 | uptrend | bearish reversal | crypto | bearish mean reversion | atr-pattern_high | 1 | 142 | 936 | 171 | 461 | -0.019 | -0.01 | 0.18 | 0.49 | 3 | 3 | 2.70 | 2.92 | 2.48 | https://analyzingalpha.com/three-outside-down-candlestick-pattern |
| 12,087 | three_outside_down | 3 | uptrend | bearish reversal | crypto | bearish mean reversion | atr-pattern_high | 2 | 142 | 924 | 167 | 953 | 0.056 | 0.02 | 0.18 | 0.35 | 3 | 4 | 5.71 | 7.42 | 4.77 | https://analyzingalpha.com/three-outside-down-candlestick-pattern |
| 12,088 | three_outside_down | 3 | uptrend | bearish reversal | crypto | bearish mean reversion | atr-pattern_high | 3 | 142 | 920 | 163 | 1,406 | -0.071 | -0.02 | 0.18 | 0.23 | 2 | 4 | 8.63 | 11.58 | 7.73 | https://analyzingalpha.com/three-outside-down-candlestick-pattern |
| 12,089 | three_outside_down | 3 | uptrend | bearish reversal | crypto | bearish mean reversion | atr-pattern_high | 4 | 142 | 911 | 161 | 2,539 | -0.158 | -0.05 | 0.18 | 0.17 | 2 | 4 | 15.77 | 26.48 | 13.61 | https://analyzingalpha.com/three-outside-down-candlestick-pattern |
| 12,090 | three_outside_down | 3 | uptrend | bearish reversal | crypto | bearish mean reversion | atr-pattern_high | 5 | 142 | 910 | 160 | 3,118 | -0.285 | -0.10 | 0.18 | 0.12 | 2 | 4 | 19.49 | 52.11 | 15.09 | https://analyzingalpha.com/three-outside-down-candlestick-pattern |
| 12,091 | three_outside_down | 3 | uptrend | bearish reversal | forex | bearish mean reversion | atr-pattern_high | 1 | 691 | 10,173 | 1,570 | 5,624 | 0.199 | 0.07 | 0.15 | 0.60 | 6 | 5 | 3.58 | 3.42 | 3.82 | https://analyzingalpha.com/three-outside-down-candlestick-pattern |
| 12,092 | three_outside_down | 3 | uptrend | bearish reversal | forex | bearish mean reversion | atr-pattern_high | 2 | 691 | 10,104 | 1,560 | 11,580 | 0.222 | 0.07 | 0.15 | 0.41 | 6 | 7 | 7.42 | 8.36 | 6.78 | https://analyzingalpha.com/three-outside-down-candlestick-pattern |
| 12,093 | three_outside_down | 3 | uptrend | bearish reversal | forex | bearish mean reversion | atr-pattern_high | 3 | 691 | 10,066 | 1,554 | 18,002 | 0.203 | 0.07 | 0.15 | 0.30 | 4 | 8 | 11.58 | 17.59 | 9.00 | https://analyzingalpha.com/three-outside-down-candlestick-pattern |
| 12,094 | three_outside_down | 3 | uptrend | bearish reversal | forex | bearish mean reversion | atr-pattern_high | 4 | 691 | 10,049 | 1,546 | 24,039 | 0.192 | 0.06 | 0.15 | 0.24 | 4 | 8 | 15.55 | 28.46 | 11.52 | https://analyzingalpha.com/three-outside-down-candlestick-pattern |
| 12,095 | three_outside_down | 3 | uptrend | bearish reversal | forex | bearish mean reversion | atr-pattern_high | 5 | 691 | 10,035 | 1,541 | 31,054 | 0.195 | 0.07 | 0.15 | 0.20 | 4 | 8 | 20.15 | 44.64 | 14.06 | https://analyzingalpha.com/three-outside-down-candlestick-pattern |
| 12,096 | three_outside_down | 3 | uptrend | bearish reversal | stock | bearish mean reversion | atr-pattern_high | 1 | 4,709 | 110,917 | 22,564 | 70,444 | 0.140 | 0.05 | 0.20 | 0.57 | 15 | 7 | 3.12 | 2.95 | 3.35 | https://analyzingalpha.com/three-outside-down-candlestick-pattern |
| 12,097 | three_outside_down | 3 | uptrend | bearish reversal | stock | bearish mean reversion | atr-pattern_high | 2 | 4,709 | 109,851 | 22,334 | 129,827 | 0.142 | 0.05 | 0.20 | 0.38 | 12 | 11 | 5.81 | 6.66 | 5.29 | https://analyzingalpha.com/three-outside-down-candlestick-pattern |
| 12,098 | three_outside_down | 3 | uptrend | bearish reversal | stock | bearish mean reversion | atr-pattern_high | 3 | 4,709 | 109,158 | 22,175 | 190,664 | 0.117 | 0.04 | 0.20 | 0.28 | 8 | 15 | 8.60 | 12.01 | 7.28 | https://analyzingalpha.com/three-outside-down-candlestick-pattern |
| 12,099 | three_outside_down | 3 | uptrend | bearish reversal | stock | bearish mean reversion | atr-pattern_high | 4 | 4,709 | 108,818 | 22,088 | 247,678 | 0.084 | 0.03 | 0.20 | 0.22 | 8 | 17 | 11.21 | 18.69 | 9.16 | https://analyzingalpha.com/three-outside-down-candlestick-pattern |
| 12,100 | three_outside_down | 3 | uptrend | bearish reversal | stock | bearish mean reversion | atr-pattern_high | 5 | 4,709 | 108,605 | 22,015 | 308,336 | 0.055 | 0.02 | 0.20 | 0.18 | 6 | 19 | 14.01 | 27.24 | 11.20 | https://analyzingalpha.com/three-outside-down-candlestick-pattern |
| Market | Strategy | Setup | Trades | Edge |
Pattern:
Pattern Bars:
Required Trend:
Traditional Strategy:
Market:
Strategy:
Setup:
RR:
Tickers:
Signals:
Trades:
Trade Bars:
Edge:
Edge Per Bar:
Confirm %:
Win %:
Cons Wins:
Cons Losses:
Avg. Trade Bars:
Avg. Win Bars:
Avg. Loss Bars:
Similar Candlestick Patterns
Traders confuse the three outside down patterns with other candlestick patterns.
Three Outside Up vs. Three Outside Down
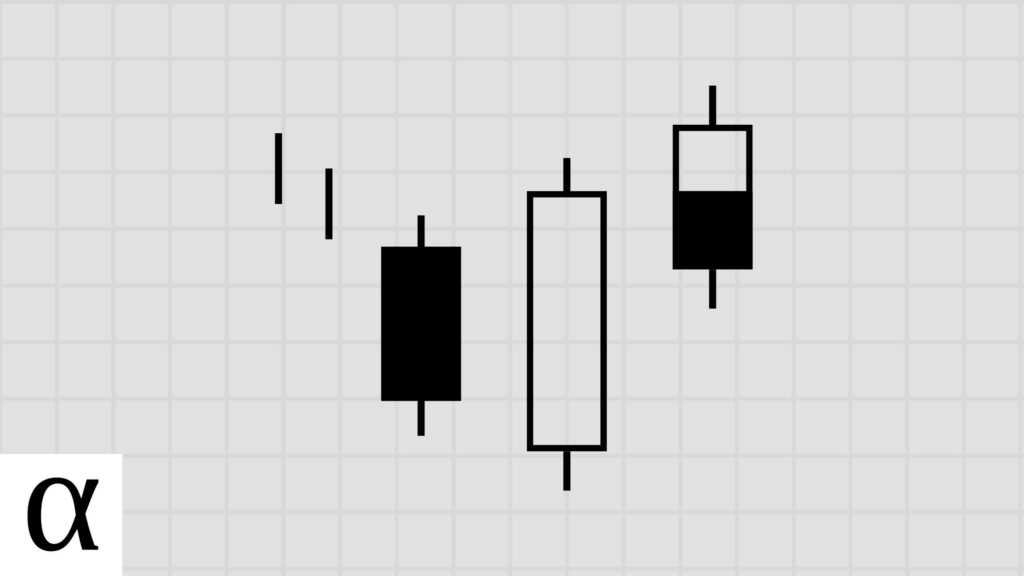
The three outside up candlestick pattern is a three-bar bullish reversal pattern opposite its bearish sibling. There’s a bearish candle, a large-bodied engulfing bullish candle, and a third bullish candle that closes above the previous candle’s close. In contrast, the three outside down has a bullish candle, a large bearish engulfing, followed by a bearish candle closing lower than the prior candle.
Volatility is typically a result of these patterns, followed by a trend continuation.
Three Inside Down vs. Three Outside Down
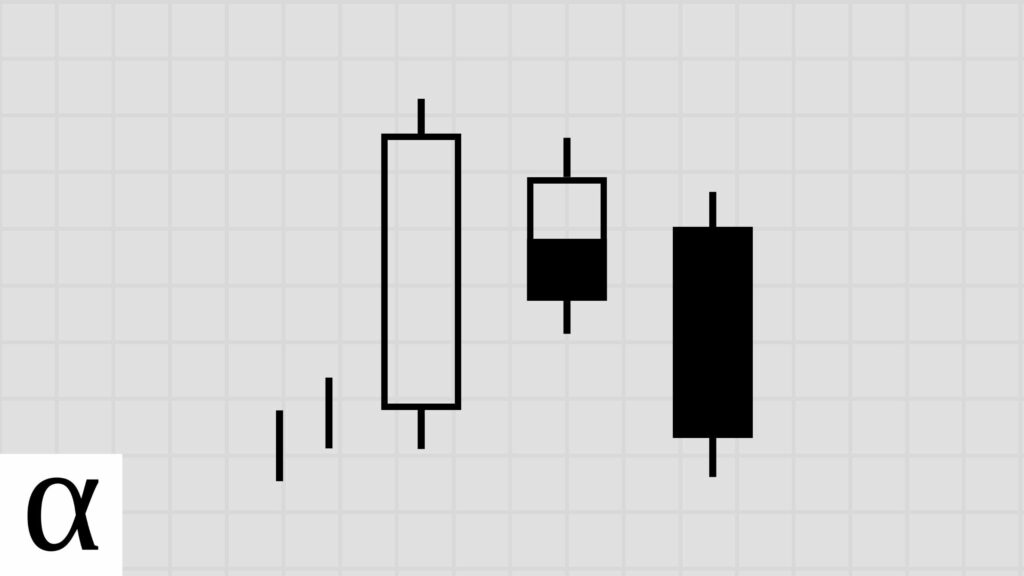
The three inside down candlestick pattern in a three-bar bearish reversal pattern that’s almost identical to the three outside down. The pattern consists of a large bullish candle, a small candle engulfed by the first, and a third candle closing lower than the first candle’s open.
The primary differentiator is the middle candle–it’s engulfed in the inside down and is engulfing the prior in the outside down.
The Bottom Line
The three outside down candlestick pattern is a three-bar bearish reversal pattern where volatility is likely to follow. The data shows that stock and crypto traders should capture this volatility to the upside, and forex traders should capture it in the other direction. Each market has a natural tendency that is clear when looking at the data and candlestick graph patterns.