The falling three methods candlestick pattern is a rare bearish continuation Japanese candlestick pattern with at least four bars that is likely best traded using mean reversion strategies in the crypto, stock, and forex markets according to extensive multiple market backtesting spanning decades.
I said likely, as data-driven traders should avoid this pattern in the crypto and stock markets due to a lack of data to determine the best trading strategy with any statistical significance.
Keep reading if you’re a candlestick technical analyst in the forex market or interested in understanding the best falling three methods candlestick pattern according to historical data.
What Is a Falling Three Methods Candlestick Pattern?

The falling three methods is an ultra-rare multiple-bar candle pattern that supposedly signals a bearish continuation.
The falling three methods’ name comes from the distinct short middle candles that supposedly represent a short-term retracement in a longer-term downtrend.
And while the name may help you identify the pattern, it certainly does not assist you in trading it. But before we learn how to trade this multiple-bar pattern potentially, let’s cover how to identify it.
How to Identify the Falling Three Methods Candlestick Pattern
The following are the requirements for a valid falling three methods candlestick pattern:
- The first candle must be bearish and long.
- A group of two or more rising small-bodied candlesticks that hold within the first candle’s range.
- A final bearish candle that opens below the previous small candle’s close and closes below the first candle’s close.
- The falling three methods must occur during a downtrend.
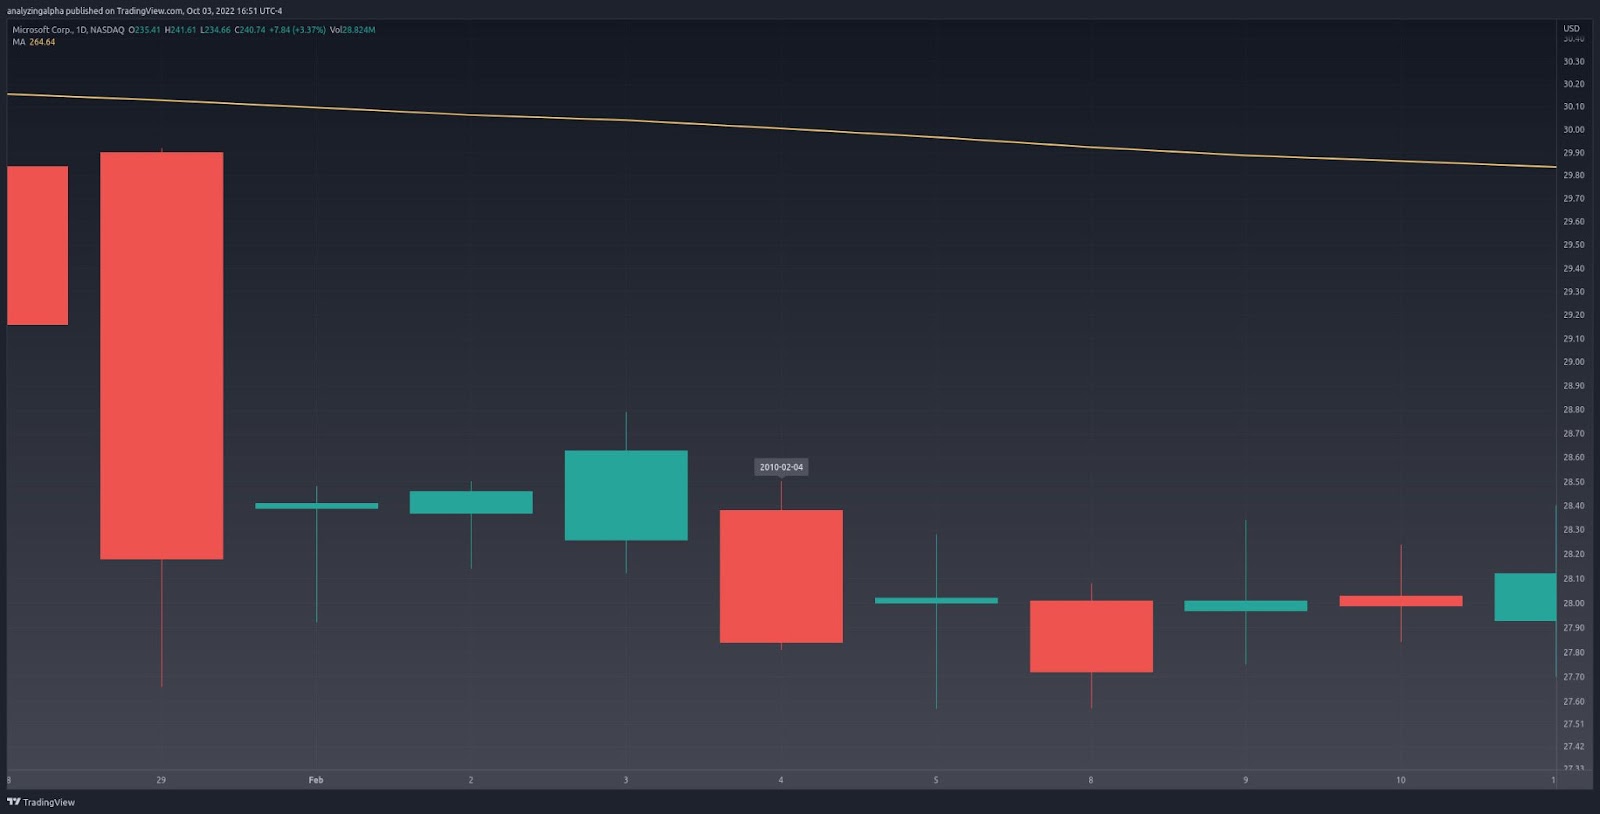
We see the falling three methods pattern on the Microsoft (MSFT) February 4th, 2010 daily chart.
Price is in a bearish trend as it’s below the fifty-day moving average. The first candlestick is long and bearish. The next three candlesticks are small, rising, bullish candles. The fifth candle opens below the previous candle’s close and closes below the first candle’s close, fulfilling our falling three methods pattern requirements.
Now that we know how to identify this rare formation, how do we profit from this supposed trend continuation pattern?
How to Trade the Falling Three Methods Candlestick Pattern
The falling three methods candlestick pattern should be traded using a bullish mean reversion strategy in the forex market. Stock and crypto traders should avoid trading this pattern due to a lack of data to determine the best falling three methods trading strategy with any statistical significance.
But before we learn the best forex falling three methods trading strategy, let’s learn how conventional traders lose money on this pattern.
Falling Three Methods Bearish Continuation Trade Setup
Let’s practice identifying the multiple-bar falling three methods pattern.
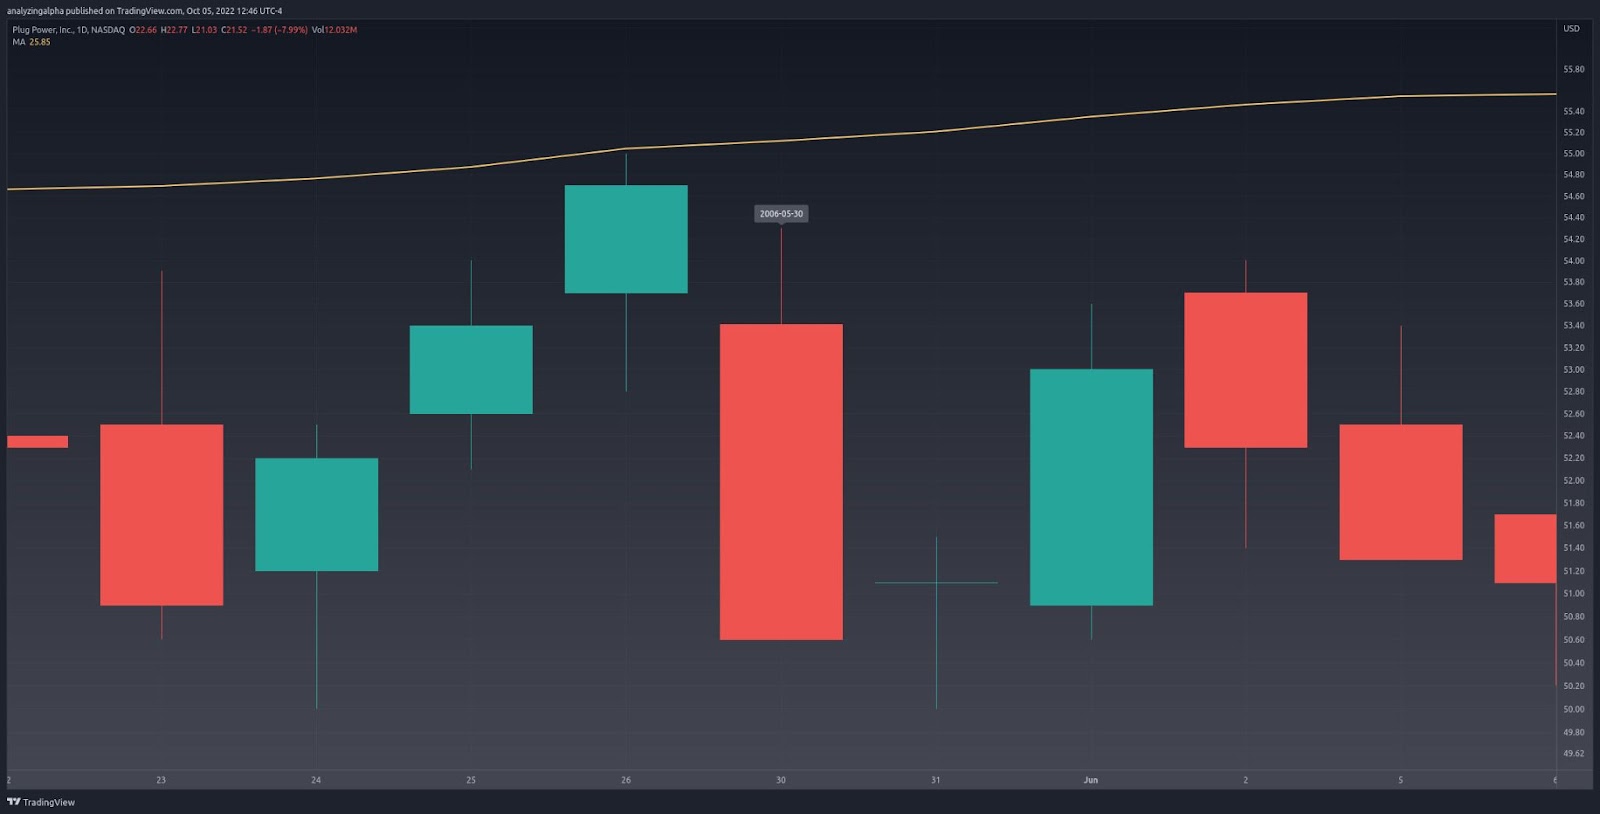
The pattern’s last candle is below the fifty-day moving average, which we consider a downward price trend. We have a large red candle, three consecutive rising green candles, and a large bearish red closing marubozu candle opening below the previous candle’s close and closing below the first candle’s close, fulfilling the pattern requirements.
With the falling three methods identified, traditional traders short at a break of the final candle’s low and set a stop loss above the first candle’s high.
While you can’t see it on the Power Plug (PLUG) May 30th, 2006 chart, the trade was profitable on June 28th, 2006, using a 1:1 risk-reward ratio.
This trade got lucky, according to historical data. Instead, let’s be data-driven and take advantage of the three methods’ inherent volatility.
Falling Three Methods Bullish Mean Reversion Trade Setup

With the pattern identified, data-driven forex traders wait for the price to cross below the pattern’s low and enter long when the price moves back above that low, setting a stop loss of one ATR.
Let’s use the Ascendis Pharma (ASND) October 7th, 2019, daily chart to make this lucid.
The pattern low occurs on the second candle at $91.74. The price crosses below and back above that price the day after the pattern identification, causing a long entry. Savvy forex traders likely took a profit three to five days later.
Regarding profits, what does history tell us about the falling three methods candlestick trading strategies?
Does the Falling Three Methods Candlestick Pattern Work? (Backtest Results)
Using the following rules, I backtested the falling three methods candlestick pattern on the daily timeframe in the crypto, forex, and stock markets.
- A close above the 50-day SMA constitutes an uptrend.
- I tested risk-reward ranges from 1 to 5.
- The optimal risk-reward ratio is selected using profit per bar.
- Entry and exits are discussed in the how-to trade section above.
- Confirmation must occur within three days of the pattern signal.
| Id | Pattern | Pattern Bars | Required Trend | Traditional Strategy | Market | Strategy | Setup | RR | Tickers | Signals | Trades | Trade Bars | Edge | Edge Per Bar | Confirm % | Win % | Cons Wins | Cons Losses | Avg. Trade Bars | Avg. Win Bars | Avg. Loss Bars | Details |
|---|---|---|---|---|---|---|---|---|---|---|---|---|---|---|---|---|---|---|---|---|---|---|
| 8,111 | falling_three_methods | 5 | downtrend | bearish continuation | crypto | bearish continuation | high-close | 1 | 4 | 8 | 8 | 253 | -0.245 | -0.05 | 1.00 | 0.38 | 1 | 2 | 31.62 | 6.00 | 47.00 | https://analyzingalpha.com/falling-three-methods-candlestick-pattern |
| 8,112 | falling_three_methods | 5 | downtrend | bearish continuation | crypto | bearish continuation | high-close | 2 | 4 | 8 | 8 | 268 | -0.630 | -0.13 | 1.00 | 0.13 | 1 | 2 | 33.50 | 8.00 | 37.14 | https://analyzingalpha.com/falling-three-methods-candlestick-pattern |
| 8,113 | falling_three_methods | 5 | downtrend | bearish continuation | crypto | bearish continuation | high-close | 3 | 4 | 8 | 7 | 260 | -1.000 | -0.20 | 0.88 | 0.00 | 0 | 2 | 37.14 | 37.14 | https://analyzingalpha.com/falling-three-methods-candlestick-pattern | |
| 8,114 | falling_three_methods | 5 | downtrend | bearish continuation | crypto | bearish continuation | high-close | 4 | 4 | 8 | 7 | 260 | -1.000 | -0.20 | 0.88 | 0.00 | 0 | 2 | 37.14 | 37.14 | https://analyzingalpha.com/falling-three-methods-candlestick-pattern | |
| 8,115 | falling_three_methods | 5 | downtrend | bearish continuation | crypto | bearish continuation | high-close | 5 | 4 | 8 | 7 | 260 | -1.000 | -0.20 | 0.88 | 0.00 | 0 | 2 | 37.14 | 37.14 | https://analyzingalpha.com/falling-three-methods-candlestick-pattern | |
| 8,116 | falling_three_methods | 5 | downtrend | bearish continuation | forex | bearish continuation | high-close | 1 | 83 | 183 | 182 | 1,796 | -0.005 | 0.00 | 0.99 | 0.50 | 3 | 3 | 9.87 | 10.22 | 9.52 | https://analyzingalpha.com/falling-three-methods-candlestick-pattern |
| 8,117 | falling_three_methods | 5 | downtrend | bearish continuation | forex | bearish continuation | high-close | 2 | 83 | 181 | 180 | 3,403 | -0.122 | -0.02 | 0.99 | 0.29 | 3 | 3 | 18.91 | 26.57 | 15.71 | https://analyzingalpha.com/falling-three-methods-candlestick-pattern |
| 8,118 | falling_three_methods | 5 | downtrend | bearish continuation | forex | bearish continuation | high-close | 3 | 83 | 180 | 179 | 4,759 | -0.169 | -0.03 | 0.99 | 0.21 | 2 | 4 | 26.59 | 45.81 | 21.58 | https://analyzingalpha.com/falling-three-methods-candlestick-pattern |
| 8,119 | falling_three_methods | 5 | downtrend | bearish continuation | forex | bearish continuation | high-close | 4 | 83 | 180 | 179 | 5,971 | -0.216 | -0.04 | 0.99 | 0.16 | 2 | 4 | 33.36 | 63.82 | 27.71 | https://analyzingalpha.com/falling-three-methods-candlestick-pattern |
| 8,120 | falling_three_methods | 5 | downtrend | bearish continuation | forex | bearish continuation | high-close | 5 | 83 | 180 | 178 | 6,893 | -0.260 | -0.05 | 0.99 | 0.12 | 2 | 4 | 38.72 | 87.00 | 31.92 | https://analyzingalpha.com/falling-three-methods-candlestick-pattern |
| 8,121 | falling_three_methods | 5 | downtrend | bearish continuation | stock | bearish continuation | high-close | 1 | 103 | 219 | 195 | 2,479 | -0.119 | -0.02 | 0.89 | 0.44 | 2 | 3 | 12.71 | 10.47 | 14.49 | https://analyzingalpha.com/falling-three-methods-candlestick-pattern |
| 8,122 | falling_three_methods | 5 | downtrend | bearish continuation | stock | bearish continuation | high-close | 2 | 103 | 219 | 193 | 4,088 | -0.110 | -0.02 | 0.88 | 0.30 | 2 | 3 | 21.18 | 22.33 | 20.70 | https://analyzingalpha.com/falling-three-methods-candlestick-pattern |
| 8,123 | falling_three_methods | 5 | downtrend | bearish continuation | stock | bearish continuation | high-close | 3 | 103 | 219 | 191 | 4,867 | -0.052 | -0.01 | 0.87 | 0.24 | 2 | 3 | 25.48 | 35.20 | 22.49 | https://analyzingalpha.com/falling-three-methods-candlestick-pattern |
| 8,124 | falling_three_methods | 5 | downtrend | bearish continuation | stock | bearish continuation | high-close | 4 | 103 | 219 | 190 | 7,509 | -0.134 | -0.03 | 0.87 | 0.17 | 2 | 3 | 39.52 | 47.06 | 37.94 | https://analyzingalpha.com/falling-three-methods-candlestick-pattern |
| 8,125 | falling_three_methods | 5 | downtrend | bearish continuation | stock | bearish continuation | high-close | 5 | 103 | 219 | 190 | 8,129 | -0.150 | -0.03 | 0.87 | 0.14 | 2 | 4 | 42.78 | 60.41 | 39.87 | https://analyzingalpha.com/falling-three-methods-candlestick-pattern |
| 8,186 | falling_three_methods | 5 | downtrend | bearish continuation | crypto | bullish reversal | low-high | 1 | 4 | 8 | 2 | 2 | -1.000 | -0.20 | 0.25 | 0.00 | 0 | 1 | 1.00 | 1.00 | https://analyzingalpha.com/falling-three-methods-candlestick-pattern | |
| 8,187 | falling_three_methods | 5 | downtrend | bearish continuation | crypto | bullish reversal | low-high | 2 | 4 | 8 | 2 | 2 | -1.000 | -0.20 | 0.25 | 0.00 | 0 | 1 | 1.00 | 1.00 | https://analyzingalpha.com/falling-three-methods-candlestick-pattern | |
| 8,188 | falling_three_methods | 5 | downtrend | bearish continuation | crypto | bullish reversal | low-high | 3 | 4 | 8 | 2 | 2 | -1.000 | -0.20 | 0.25 | 0.00 | 0 | 1 | 1.00 | 1.00 | https://analyzingalpha.com/falling-three-methods-candlestick-pattern | |
| 8,189 | falling_three_methods | 5 | downtrend | bearish continuation | crypto | bullish reversal | low-high | 4 | 4 | 8 | 2 | 2 | -1.000 | -0.20 | 0.25 | 0.00 | 0 | 1 | 1.00 | 1.00 | https://analyzingalpha.com/falling-three-methods-candlestick-pattern | |
| 8,190 | falling_three_methods | 5 | downtrend | bearish continuation | crypto | bullish reversal | low-high | 5 | 4 | 8 | 2 | 2 | -1.000 | -0.20 | 0.25 | 0.00 | 0 | 1 | 1.00 | 1.00 | https://analyzingalpha.com/falling-three-methods-candlestick-pattern | |
| 8,191 | falling_three_methods | 5 | downtrend | bearish continuation | forex | bullish reversal | low-high | 1 | 83 | 184 | 72 | 141 | -0.755 | -0.15 | 0.39 | 0.13 | 1 | 2 | 1.96 | 2.89 | 1.83 | https://analyzingalpha.com/falling-three-methods-candlestick-pattern |
| 8,192 | falling_three_methods | 5 | downtrend | bearish continuation | forex | bullish reversal | low-high | 2 | 83 | 184 | 72 | 171 | -0.668 | -0.13 | 0.39 | 0.11 | 1 | 3 | 2.38 | 6.38 | 1.88 | https://analyzingalpha.com/falling-three-methods-candlestick-pattern |
| 8,193 | falling_three_methods | 5 | downtrend | bearish continuation | forex | bullish reversal | low-high | 3 | 83 | 184 | 72 | 240 | -0.772 | -0.15 | 0.39 | 0.06 | 1 | 3 | 3.33 | 7.25 | 3.10 | https://analyzingalpha.com/falling-three-methods-candlestick-pattern |
| 8,194 | falling_three_methods | 5 | downtrend | bearish continuation | forex | bullish reversal | low-high | 4 | 83 | 184 | 72 | 305 | -0.792 | -0.16 | 0.39 | 0.04 | 1 | 3 | 4.24 | 17.67 | 3.65 | https://analyzingalpha.com/falling-three-methods-candlestick-pattern |
| 8,195 | falling_three_methods | 5 | downtrend | bearish continuation | forex | bullish reversal | low-high | 5 | 83 | 184 | 72 | 327 | -0.750 | -0.15 | 0.39 | 0.04 | 1 | 3 | 4.54 | 25.00 | 3.65 | https://analyzingalpha.com/falling-three-methods-candlestick-pattern |
| 8,196 | falling_three_methods | 5 | downtrend | bearish continuation | stock | bullish reversal | low-high | 1 | 103 | 221 | 74 | 165 | -0.483 | -0.10 | 0.33 | 0.26 | 2 | 2 | 2.23 | 2.53 | 2.13 | https://analyzingalpha.com/falling-three-methods-candlestick-pattern |
| 8,197 | falling_three_methods | 5 | downtrend | bearish continuation | stock | bullish reversal | low-high | 2 | 103 | 221 | 74 | 230 | -0.348 | -0.07 | 0.33 | 0.22 | 2 | 2 | 3.11 | 5.69 | 2.40 | https://analyzingalpha.com/falling-three-methods-candlestick-pattern |
| 8,198 | falling_three_methods | 5 | downtrend | bearish continuation | stock | bullish reversal | low-high | 3 | 103 | 221 | 74 | 350 | -0.292 | -0.06 | 0.33 | 0.18 | 2 | 2 | 4.73 | 13.62 | 2.84 | https://analyzingalpha.com/falling-three-methods-candlestick-pattern |
| 8,199 | falling_three_methods | 5 | downtrend | bearish continuation | stock | bullish reversal | low-high | 4 | 103 | 221 | 74 | 419 | -0.192 | -0.04 | 0.33 | 0.16 | 2 | 2 | 5.66 | 19.67 | 2.95 | https://analyzingalpha.com/falling-three-methods-candlestick-pattern |
| 8,200 | falling_three_methods | 5 | downtrend | bearish continuation | stock | bullish reversal | low-high | 5 | 103 | 221 | 74 | 519 | -0.030 | -0.01 | 0.33 | 0.16 | 2 | 2 | 7.01 | 28.00 | 2.95 | https://analyzingalpha.com/falling-three-methods-candlestick-pattern |
| 9,406 | falling_three_methods | 5 | downtrend | bearish continuation | crypto | bullish mean reversion | atr-pattern_low | 1 | 4 | 8 | 3 | 13 | -0.337 | -0.07 | 0.38 | 0.33 | 1 | 1 | 4.33 | 1.00 | 6.00 | https://analyzingalpha.com/falling-three-methods-candlestick-pattern |
| 9,407 | falling_three_methods | 5 | downtrend | bearish continuation | crypto | bullish mean reversion | atr-pattern_low | 2 | 4 | 8 | 3 | 37 | -0.004 | 0.00 | 0.38 | 0.33 | 1 | 1 | 12.33 | 25.00 | 6.00 | https://analyzingalpha.com/falling-three-methods-candlestick-pattern |
| 9,408 | falling_three_methods | 5 | downtrend | bearish continuation | crypto | bullish mean reversion | atr-pattern_low | 3 | 4 | 8 | 3 | 154 | 0.329 | 0.07 | 0.38 | 0.33 | 1 | 1 | 51.33 | 142.00 | 6.00 | https://analyzingalpha.com/falling-three-methods-candlestick-pattern |
| 9,409 | falling_three_methods | 5 | downtrend | bearish continuation | crypto | bullish mean reversion | atr-pattern_low | 4 | 4 | 8 | 3 | 168 | 0.662 | 0.13 | 0.38 | 0.33 | 1 | 1 | 56.00 | 156.00 | 6.00 | https://analyzingalpha.com/falling-three-methods-candlestick-pattern |
| 9,410 | falling_three_methods | 5 | downtrend | bearish continuation | crypto | bullish mean reversion | atr-pattern_low | 5 | 4 | 8 | 3 | 346 | 0.995 | 0.20 | 0.38 | 0.33 | 1 | 1 | 115.33 | 334.00 | 6.00 | https://analyzingalpha.com/falling-three-methods-candlestick-pattern |
| 9,411 | falling_three_methods | 5 | downtrend | bearish continuation | forex | bullish mean reversion | atr-pattern_low | 1 | 83 | 184 | 130 | 496 | 0.182 | 0.04 | 0.71 | 0.59 | 3 | 3 | 3.82 | 4.25 | 3.19 | https://analyzingalpha.com/falling-three-methods-candlestick-pattern |
| 9,412 | falling_three_methods | 5 | downtrend | bearish continuation | forex | bullish mean reversion | atr-pattern_low | 2 | 83 | 184 | 130 | 858 | 0.316 | 0.06 | 0.71 | 0.44 | 2 | 3 | 6.60 | 8.82 | 4.86 | https://analyzingalpha.com/falling-three-methods-candlestick-pattern |
| 9,413 | falling_three_methods | 5 | downtrend | bearish continuation | forex | bullish mean reversion | atr-pattern_low | 3 | 83 | 184 | 130 | 1,322 | 0.511 | 0.10 | 0.71 | 0.38 | 2 | 4 | 10.17 | 16.80 | 6.16 | https://analyzingalpha.com/falling-three-methods-candlestick-pattern |
| 9,414 | falling_three_methods | 5 | downtrend | bearish continuation | forex | bullish mean reversion | atr-pattern_low | 4 | 83 | 182 | 128 | 1,661 | 0.488 | 0.10 | 0.70 | 0.30 | 2 | 4 | 12.98 | 21.47 | 9.39 | https://analyzingalpha.com/falling-three-methods-candlestick-pattern |
| 9,415 | falling_three_methods | 5 | downtrend | bearish continuation | forex | bullish mean reversion | atr-pattern_low | 5 | 83 | 182 | 127 | 2,572 | 0.420 | 0.08 | 0.70 | 0.24 | 2 | 4 | 20.25 | 36.40 | 15.26 | https://analyzingalpha.com/falling-three-methods-candlestick-pattern |
| 9,416 | falling_three_methods | 5 | downtrend | bearish continuation | stock | bullish mean reversion | atr-pattern_low | 1 | 103 | 221 | 123 | 607 | 0.300 | 0.06 | 0.56 | 0.65 | 2 | 2 | 4.93 | 4.78 | 5.23 | https://analyzingalpha.com/falling-three-methods-candlestick-pattern |
| 9,417 | falling_three_methods | 5 | downtrend | bearish continuation | stock | bullish mean reversion | atr-pattern_low | 2 | 103 | 220 | 122 | 1,195 | 0.298 | 0.06 | 0.55 | 0.43 | 2 | 2 | 9.80 | 12.25 | 7.91 | https://analyzingalpha.com/falling-three-methods-candlestick-pattern |
| 9,418 | falling_three_methods | 5 | downtrend | bearish continuation | stock | bullish mean reversion | atr-pattern_low | 3 | 103 | 220 | 122 | 1,707 | 0.511 | 0.10 | 0.55 | 0.38 | 2 | 2 | 13.99 | 21.39 | 9.51 | https://analyzingalpha.com/falling-three-methods-candlestick-pattern |
| 9,419 | falling_three_methods | 5 | downtrend | bearish continuation | stock | bullish mean reversion | atr-pattern_low | 4 | 103 | 220 | 122 | 2,121 | 0.554 | 0.11 | 0.55 | 0.31 | 2 | 2 | 17.39 | 29.26 | 12.01 | https://analyzingalpha.com/falling-three-methods-candlestick-pattern |
| 9,420 | falling_three_methods | 5 | downtrend | bearish continuation | stock | bullish mean reversion | atr-pattern_low | 5 | 103 | 220 | 122 | 2,785 | 0.570 | 0.11 | 0.55 | 0.26 | 2 | 2 | 22.83 | 43.09 | 15.62 | https://analyzingalpha.com/falling-three-methods-candlestick-pattern |
| 10,266 | falling_three_methods | 5 | downtrend | bearish continuation | crypto | bullish reversal | low-close | 1 | 4 | 8 | 8 | 12 | -0.755 | -0.15 | 1.00 | 0.13 | 0 | 2 | 1.50 | 5.00 | 1.00 | https://analyzingalpha.com/falling-three-methods-candlestick-pattern |
| 10,267 | falling_three_methods | 5 | downtrend | bearish continuation | crypto | bullish reversal | low-close | 2 | 4 | 8 | 8 | 13 | -0.630 | -0.13 | 1.00 | 0.13 | 0 | 2 | 1.62 | 6.00 | 1.00 | https://analyzingalpha.com/falling-three-methods-candlestick-pattern |
| 10,268 | falling_three_methods | 5 | downtrend | bearish continuation | crypto | bullish reversal | low-close | 3 | 4 | 8 | 8 | 14 | -0.505 | -0.10 | 1.00 | 0.13 | 0 | 2 | 1.75 | 7.00 | 1.00 | https://analyzingalpha.com/falling-three-methods-candlestick-pattern |
| 10,269 | falling_three_methods | 5 | downtrend | bearish continuation | crypto | bullish reversal | low-close | 4 | 4 | 8 | 8 | 14 | -0.380 | -0.08 | 1.00 | 0.13 | 0 | 2 | 1.75 | 7.00 | 1.00 | https://analyzingalpha.com/falling-three-methods-candlestick-pattern |
| 10,270 | falling_three_methods | 5 | downtrend | bearish continuation | crypto | bullish reversal | low-close | 5 | 4 | 8 | 8 | 16 | -0.255 | -0.05 | 1.00 | 0.13 | 0 | 2 | 2.00 | 9.00 | 1.00 | https://analyzingalpha.com/falling-three-methods-candlestick-pattern |
| 10,271 | falling_three_methods | 5 | downtrend | bearish continuation | forex | bullish reversal | low-close | 1 | 83 | 184 | 183 | 191 | -0.885 | -0.18 | 0.99 | 0.06 | 1 | 4 | 1.04 | 1.10 | 1.04 | https://analyzingalpha.com/falling-three-methods-candlestick-pattern |
| 10,272 | falling_three_methods | 5 | downtrend | bearish continuation | forex | bullish reversal | low-close | 2 | 83 | 184 | 183 | 195 | -0.852 | -0.17 | 0.99 | 0.05 | 1 | 4 | 1.07 | 1.44 | 1.05 | https://analyzingalpha.com/falling-three-methods-candlestick-pattern |
| 10,273 | falling_three_methods | 5 | downtrend | bearish continuation | forex | bullish reversal | low-close | 3 | 83 | 184 | 183 | 204 | -0.871 | -0.17 | 0.99 | 0.03 | 1 | 4 | 1.11 | 1.50 | 1.10 | https://analyzingalpha.com/falling-three-methods-candlestick-pattern |
| 10,274 | falling_three_methods | 5 | downtrend | bearish continuation | forex | bullish reversal | low-close | 4 | 83 | 184 | 183 | 206 | -0.838 | -0.17 | 0.99 | 0.03 | 1 | 4 | 1.13 | 1.83 | 1.10 | https://analyzingalpha.com/falling-three-methods-candlestick-pattern |
| 10,275 | falling_three_methods | 5 | downtrend | bearish continuation | forex | bullish reversal | low-close | 5 | 83 | 184 | 183 | 211 | -0.805 | -0.16 | 0.99 | 0.03 | 1 | 4 | 1.15 | 2.67 | 1.10 | https://analyzingalpha.com/falling-three-methods-candlestick-pattern |
| 10,276 | falling_three_methods | 5 | downtrend | bearish continuation | stock | bullish reversal | low-close | 1 | 103 | 221 | 205 | 226 | -0.802 | -0.16 | 0.93 | 0.10 | 2 | 4 | 1.10 | 1.15 | 1.10 | https://analyzingalpha.com/falling-three-methods-candlestick-pattern |
| 10,277 | falling_three_methods | 5 | downtrend | bearish continuation | stock | bullish reversal | low-close | 2 | 103 | 221 | 205 | 232 | -0.734 | -0.15 | 0.93 | 0.09 | 2 | 4 | 1.13 | 1.17 | 1.13 | https://analyzingalpha.com/falling-three-methods-candlestick-pattern |
| 10,278 | falling_three_methods | 5 | downtrend | bearish continuation | stock | bullish reversal | low-close | 3 | 103 | 221 | 205 | 253 | -0.686 | -0.14 | 0.93 | 0.08 | 2 | 4 | 1.23 | 1.50 | 1.21 | https://analyzingalpha.com/falling-three-methods-candlestick-pattern |
| 10,279 | falling_three_methods | 5 | downtrend | bearish continuation | stock | bullish reversal | low-close | 4 | 103 | 221 | 205 | 254 | -0.608 | -0.12 | 0.93 | 0.08 | 2 | 4 | 1.24 | 1.56 | 1.21 | https://analyzingalpha.com/falling-three-methods-candlestick-pattern |
| 10,280 | falling_three_methods | 5 | downtrend | bearish continuation | stock | bullish reversal | low-close | 5 | 103 | 221 | 205 | 262 | -0.565 | -0.11 | 0.93 | 0.07 | 2 | 4 | 1.28 | 1.93 | 1.23 | https://analyzingalpha.com/falling-three-methods-candlestick-pattern |
| 10,296 | falling_three_methods | 5 | downtrend | bearish continuation | crypto | bearish mean reversion | atr-pattern_high | 1 | 4 | 8 | 0 | 0 | 0.00 | 0 | 0 | https://analyzingalpha.com/falling-three-methods-candlestick-pattern | ||||||
| 10,297 | falling_three_methods | 5 | downtrend | bearish continuation | crypto | bearish mean reversion | atr-pattern_high | 2 | 4 | 8 | 0 | 0 | 0.00 | 0 | 0 | https://analyzingalpha.com/falling-three-methods-candlestick-pattern | ||||||
| 10,298 | falling_three_methods | 5 | downtrend | bearish continuation | crypto | bearish mean reversion | atr-pattern_high | 3 | 4 | 8 | 0 | 0 | 0.00 | 0 | 0 | https://analyzingalpha.com/falling-three-methods-candlestick-pattern | ||||||
| 10,299 | falling_three_methods | 5 | downtrend | bearish continuation | crypto | bearish mean reversion | atr-pattern_high | 4 | 4 | 8 | 0 | 0 | 0.00 | 0 | 0 | https://analyzingalpha.com/falling-three-methods-candlestick-pattern | ||||||
| 10,300 | falling_three_methods | 5 | downtrend | bearish continuation | crypto | bearish mean reversion | atr-pattern_high | 5 | 4 | 8 | 0 | 0 | 0.00 | 0 | 0 | https://analyzingalpha.com/falling-three-methods-candlestick-pattern | ||||||
| 10,301 | falling_three_methods | 5 | downtrend | bearish continuation | forex | bearish mean reversion | atr-pattern_high | 1 | 83 | 184 | 30 | 88 | 0.400 | 0.08 | 0.16 | 0.70 | 2 | 1 | 2.93 | 2.57 | 3.78 | https://analyzingalpha.com/falling-three-methods-candlestick-pattern |
| 10,302 | falling_three_methods | 5 | downtrend | bearish continuation | forex | bearish mean reversion | atr-pattern_high | 2 | 83 | 184 | 30 | 177 | -0.100 | -0.02 | 0.16 | 0.30 | 2 | 2 | 5.90 | 6.33 | 5.71 | https://analyzingalpha.com/falling-three-methods-candlestick-pattern |
| 10,303 | falling_three_methods | 5 | downtrend | bearish continuation | forex | bearish mean reversion | atr-pattern_high | 3 | 83 | 184 | 30 | 209 | -0.071 | -0.01 | 0.16 | 0.23 | 2 | 2 | 6.97 | 7.86 | 6.70 | https://analyzingalpha.com/falling-three-methods-candlestick-pattern |
| 10,304 | falling_three_methods | 5 | downtrend | bearish continuation | forex | bearish mean reversion | atr-pattern_high | 4 | 83 | 184 | 30 | 250 | 0.000 | 0.00 | 0.16 | 0.20 | 1 | 2 | 8.33 | 12.50 | 7.29 | https://analyzingalpha.com/falling-three-methods-candlestick-pattern |
| 10,305 | falling_three_methods | 5 | downtrend | bearish continuation | forex | bearish mean reversion | atr-pattern_high | 5 | 83 | 184 | 30 | 269 | 0.200 | 0.04 | 0.16 | 0.20 | 1 | 2 | 8.97 | 15.67 | 7.29 | https://analyzingalpha.com/falling-three-methods-candlestick-pattern |
| 10,306 | falling_three_methods | 5 | downtrend | bearish continuation | stock | bearish mean reversion | atr-pattern_high | 1 | 103 | 221 | 23 | 92 | 0.125 | 0.03 | 0.10 | 0.57 | 2 | 2 | 4.00 | 5.00 | 2.70 | https://analyzingalpha.com/falling-three-methods-candlestick-pattern |
| 10,307 | falling_three_methods | 5 | downtrend | bearish continuation | stock | bearish mean reversion | atr-pattern_high | 2 | 103 | 221 | 23 | 195 | 0.046 | 0.01 | 0.10 | 0.35 | 1 | 2 | 8.48 | 12.62 | 6.27 | https://analyzingalpha.com/falling-three-methods-candlestick-pattern |
| 10,308 | falling_three_methods | 5 | downtrend | bearish continuation | stock | bearish mean reversion | atr-pattern_high | 3 | 103 | 221 | 23 | 223 | 0.212 | 0.04 | 0.10 | 0.30 | 1 | 2 | 9.70 | 16.57 | 6.69 | https://analyzingalpha.com/falling-three-methods-candlestick-pattern |
| 10,309 | falling_three_methods | 5 | downtrend | bearish continuation | stock | bearish mean reversion | atr-pattern_high | 4 | 103 | 221 | 23 | 266 | 0.516 | 0.10 | 0.10 | 0.30 | 1 | 2 | 11.57 | 22.71 | 6.69 | https://analyzingalpha.com/falling-three-methods-candlestick-pattern |
| 10,310 | falling_three_methods | 5 | downtrend | bearish continuation | stock | bearish mean reversion | atr-pattern_high | 5 | 103 | 220 | 22 | 396 | 0.635 | 0.13 | 0.10 | 0.27 | 1 | 2 | 18.00 | 24.67 | 15.50 | https://analyzingalpha.com/falling-three-methods-candlestick-pattern |
| 10,311 | falling_three_methods | 5 | downtrend | bearish continuation | crypto | bearish continuation | high-low | 1 | 4 | 8 | 5 | 237 | -0.600 | -0.12 | 0.62 | 0.20 | 1 | 2 | 47.40 | 8.00 | 57.25 | https://analyzingalpha.com/falling-three-methods-candlestick-pattern |
| 10,312 | falling_three_methods | 5 | downtrend | bearish continuation | crypto | bearish continuation | high-low | 2 | 4 | 8 | 5 | 240 | -1.000 | -0.20 | 0.62 | 0.00 | 0 | 2 | 48.00 | 48.00 | https://analyzingalpha.com/falling-three-methods-candlestick-pattern | |
| 10,313 | falling_three_methods | 5 | downtrend | bearish continuation | crypto | bearish continuation | high-low | 3 | 4 | 8 | 5 | 240 | -1.000 | -0.20 | 0.62 | 0.00 | 0 | 2 | 48.00 | 48.00 | https://analyzingalpha.com/falling-three-methods-candlestick-pattern | |
| 10,314 | falling_three_methods | 5 | downtrend | bearish continuation | crypto | bearish continuation | high-low | 4 | 4 | 8 | 5 | 240 | -1.000 | -0.20 | 0.62 | 0.00 | 0 | 2 | 48.00 | 48.00 | https://analyzingalpha.com/falling-three-methods-candlestick-pattern | |
| 10,315 | falling_three_methods | 5 | downtrend | bearish continuation | crypto | bearish continuation | high-low | 5 | 4 | 8 | 5 | 240 | -1.000 | -0.20 | 0.62 | 0.00 | 0 | 2 | 48.00 | 48.00 | https://analyzingalpha.com/falling-three-methods-candlestick-pattern | |
| 10,316 | falling_three_methods | 5 | downtrend | bearish continuation | forex | bearish continuation | high-low | 1 | 83 | 183 | 150 | 1,804 | 0.017 | 0.00 | 0.82 | 0.51 | 3 | 3 | 12.03 | 14.09 | 9.91 | https://analyzingalpha.com/falling-three-methods-candlestick-pattern |
| 10,317 | falling_three_methods | 5 | downtrend | bearish continuation | forex | bearish continuation | high-low | 2 | 83 | 181 | 148 | 3,418 | -0.106 | -0.02 | 0.82 | 0.30 | 2 | 3 | 23.09 | 30.45 | 19.98 | https://analyzingalpha.com/falling-three-methods-candlestick-pattern |
| 10,318 | falling_three_methods | 5 | downtrend | bearish continuation | forex | bearish continuation | high-low | 3 | 83 | 180 | 146 | 4,900 | -0.286 | -0.06 | 0.81 | 0.18 | 2 | 3 | 33.56 | 47.08 | 30.63 | https://analyzingalpha.com/falling-three-methods-candlestick-pattern |
| 10,319 | falling_three_methods | 5 | downtrend | bearish continuation | forex | bearish continuation | high-low | 4 | 83 | 180 | 146 | 5,916 | -0.246 | -0.05 | 0.81 | 0.15 | 2 | 3 | 40.52 | 78.05 | 33.86 | https://analyzingalpha.com/falling-three-methods-candlestick-pattern |
| 10,320 | falling_three_methods | 5 | downtrend | bearish continuation | forex | bearish continuation | high-low | 5 | 83 | 179 | 143 | 7,116 | -0.330 | -0.07 | 0.80 | 0.11 | 2 | 3 | 49.76 | 115.19 | 41.52 | https://analyzingalpha.com/falling-three-methods-candlestick-pattern |
| 10,321 | falling_three_methods | 5 | downtrend | bearish continuation | stock | bearish continuation | high-low | 1 | 103 | 219 | 163 | 2,486 | -0.080 | -0.02 | 0.74 | 0.46 | 2 | 2 | 15.25 | 10.67 | 19.16 | https://analyzingalpha.com/falling-three-methods-candlestick-pattern |
| 10,322 | falling_three_methods | 5 | downtrend | bearish continuation | stock | bearish continuation | high-low | 2 | 103 | 219 | 162 | 3,901 | -0.072 | -0.01 | 0.74 | 0.31 | 2 | 3 | 24.08 | 25.26 | 23.55 | https://analyzingalpha.com/falling-three-methods-candlestick-pattern |
| 10,323 | falling_three_methods | 5 | downtrend | bearish continuation | stock | bearish continuation | high-low | 3 | 103 | 219 | 160 | 5,228 | -0.046 | -0.01 | 0.73 | 0.24 | 2 | 3 | 32.67 | 36.68 | 31.43 | https://analyzingalpha.com/falling-three-methods-candlestick-pattern |
| 10,324 | falling_three_methods | 5 | downtrend | bearish continuation | stock | bearish continuation | high-low | 4 | 103 | 219 | 159 | 7,182 | -0.116 | -0.02 | 0.73 | 0.18 | 2 | 3 | 45.17 | 59.14 | 42.18 | https://analyzingalpha.com/falling-three-methods-candlestick-pattern |
| 10,325 | falling_three_methods | 5 | downtrend | bearish continuation | stock | bearish continuation | high-low | 5 | 103 | 219 | 159 | 8,797 | -0.055 | -0.01 | 0.73 | 0.16 | 2 | 4 | 55.33 | 117.16 | 43.79 | https://analyzingalpha.com/falling-three-methods-candlestick-pattern |
| Market | Strategy | Setup | Trades |
Pattern:
Pattern Bars:
Required Trend:
Traditional Strategy:
Market:
Strategy:
Setup:
RR:
Tickers:
Signals:
Trades:
Trade Bars:
Edge:
Edge Per Bar:
Confirm %:
Win %:
Cons Wins:
Cons Losses:
Avg. Trade Bars:
Avg. Win Bars:
Avg. Loss Bars:
Similar Candlestick Patterns
Multiple candlestick patterns are often confused with the falling three methods pattern. It’s essential to understand the differences when using candlestick pattern technical analysis.
Rising Three Methods vs. Falling Three Methods

The rising three methods candlestick pattern is the mirror opposite of its falling friend. The rising three methods occur in an uptrend, the first candle is long and white, the next few candles are short and hold within the first candle’s range, and the final candle is bullish and closes above the prior candle’s close and closes above the first candle’s close.
And while these patterns may be exactly opposite of each other when it comes to identification, history shows us that they both lead to future volatility.
Downside Gap Three Methods vs. Falling Three Methods

The downside gap three methods candlestick pattern is a three-bar bearish continuation pattern. The pattern has a long bearish candle, followed by a gap down into another bearish candle, followed by a third white candle that opens within the prior real body and closes within the first candle’s real body.
On the other hand, the falling three methods have at least four candles and do not require a gap.
The Bottom Line
The falling three methods is an ultra-rare three-bar bearish continuation pattern that’s best traded using a mean reversion strategy in the forex market according to a 21-year backtest.
Traditional traders believe this pattern continues the bearish price trend, but data-driven traders understand the pattern represents volatility. If you’re looking to go with the trend, I’ve ranked all of the best continuation candlestick patterns.