The bearish abandoned baby is an extremely rare Japanese candlestick pattern that suggests near-term volatility is ahead, according to a multiple-decade backtest.
This pattern occurred only a few times in the stock market and did not occur in the crypto and forex markets. In other words, this is one of the rarest candlestick patterns, and it’s hard to determine the best trading strategy due to the lack of sample size.
But if you’re still interested, the data suggests that this bearish reversal pattern works as intended and portends a further move to the downside.
With that out of the way, let’s learn more about these abandoned baby patterns.
What Is a Bearish Abandoned Baby Candlestick Pattern?

The bearish abandoned baby is a three-candle pattern considered a bearish reversal.
I say “considered” since I don’t have enough data to state otherwise confidently.
With this in mind, how do we identify this bearish abandoned baby pattern?
How to Identify the Bearish Abandoned Baby Candlestick Pattern

The following are the requirements for a valid bearish abandoned baby candlestick pattern:
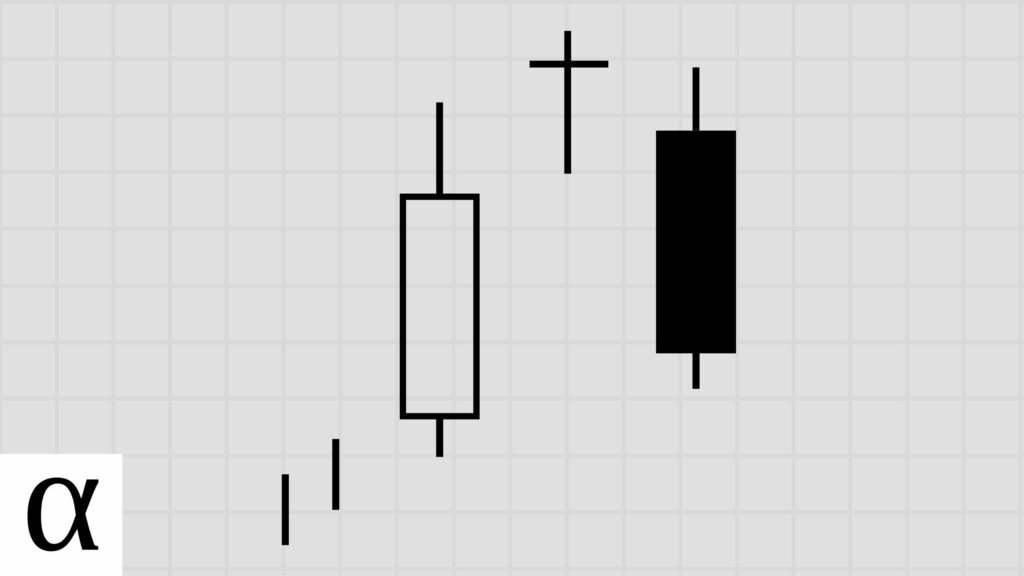
- The first candlestick must have a long bullish real body.
- The second candlestick must be a doji.
- There must be an upside gap where the wicks of the first and second candlesticks don’t touch.
- The third candle must be bearish with a real body that moves well within the first candle’s body.
- There must be a downside gap where the wicks of the second and third candlesticks don’t touch.
- The bearish abandoned baby must occur in an uptrend.
We can see a bearish abandoned baby example on the AstraZeneca (AZN) daily chart on August 19th, 2015.
The price at the time of pattern completion is above the fifty-day moving average, constituting a bullish trend. We see the first green candle with a relatively long bullish body. Day two prints a red doji candle. And we see on day three that the third candlestick is a large down candle that moves well within the first bullish candle.
With an understanding of how to identify this pattern on our candlestick charts, let’s cover the trading strategy designed to extract profits from these chart patterns.
How to Trade the Bearish Abandoned Baby Candlestick Pattern

Let’s review identifying this pattern one more time.
The bearish abandoned baby pattern is a bearish reversal pattern. This pattern formed again on the Budwiser (BUD) daily chart on December 13th, 2012.
The first candle is a strong advancing candle, the second candle gaps up, and the third candle is a significant bearish candle that moves well within the first candle’s real body.
With the last candle identified, a trader will go short at the break of the final candle’s low with a stop loss above the high of the middle candle, assuming the primary trend reverses.
In the Budwiser example, the price trends sideways before it moves downward. Experienced traders would likely have stopped out as the price did move above the high of the abandoned baby top, but if you gave your stop target some wiggle room, you might have profited from the downward reversal trend.
And while this setup works, the optimal setup – again with only 54 trades over 21 years, is to enter short when the price moves below the close with a stop loss above the second candle’s high.
Does the Bearish Abandoned Baby Candlestick Pattern Work? (Backtest Results)
I backtested the bearish abandoned baby candlestick pattern on the daily timeframe in the crypto, forex, and stock markets using the following rules:
- A close above the 50-day SMA constitutes an uptrend.
- I tested risk-reward ranges from 1 to 5.
- The optimal risk-reward ratio is selected using profit per bar.
- Entry and exits are discussed in the how-to trade section above.
- Confirmation must occur within three days of the pattern signal.
Similar Patterns
Many candlestick patterns get confused with the bearish abandoned baby patterns. Understanding these related patterns and their differences is vital when using candlestick pattern technical analysis.
Bullish Abandoned Baby vs. Bearish Abandoned Baby

The bullish abandoned baby candlestick pattern and bearish abandoned baby are three bar reversal candlestick patterns. Still, they are opposites – the only difference is one is bullish, and the other is bearish.
The bullish abandoned baby pattern occurs in a downtrend, while, as mentioned earlier, the bearish abandoned baby occurs in an uptrend. The first candle of the bullish abandoned baby is bearish instead of bullish. The second candlestick is a gapped-down doji instead of an abandoned doji in the opposite direction. The third candlestick of the bullish abandoned baby pattern is bullish that moves well within the first candle’s real body.
Evening Doji Star vs. Bearish Abandoned Baby
The evening doji star candlestick pattern, which is different than the evening star pattern, is almost identical to the bearish abandoned baby. The difference is that the evening star is a two-bar pattern, whereas the abandoned baby is a three-bar pattern.
Bearish Harami vs. Bearish Abandoned Baby

The bearish harami candlestick pattern often gets confused with the bearish abandoned baby due to similar naming. The harami name means “pregnant” in Japanese, as one could say that the second candle is the unborn baby of the first candle. So while the names are similar, the identification is not.
The bearish harami has a sizeable bullish candle followed by a second candle engulfed by the first, whereas the abandoned baby has a second candle entirely above the first.
The Bottom Line
The bearish abandoned baby is a rare three-bar pattern. The data hints that the pattern signals a bearish reversal, but unfortunately, it occurs so rarely that it’s tough to state the best trading strategy with any statistical confidence.
But don’t worry, I’ve backtested all of the candlestick patterns allowing you to only focus on the best candlestick trading strategies.