The bullish abandoned baby is an extremely rare three-candle bearish reversal Japanese candlestick pattern that suggests a future bullish move.
This pattern is rarer than its bearish counterpart, and it’s difficult to determine the best trading strategy due to the lack of data.
But if you’re still interested, this bearish reversal pattern does seem to work as intended and leads to further downside.
With that understanding, let’s learn more about these bullish abandoned baby patterns.
What Is a Bullish Abandoned Baby Candlestick Pattern?

The bullish abandoned baby is an infrequent three-candle pattern that works as intended as a bullish reversal in the stock market.
It gets its name from the abandoned middle Doji.
With this in mind, how do we identify this bearish abandoned baby pattern?
How to Identify the Bullish Abandoned Baby Candlestick Pattern

The following are the requirements for a valid bearish abandoned baby candlestick pattern:
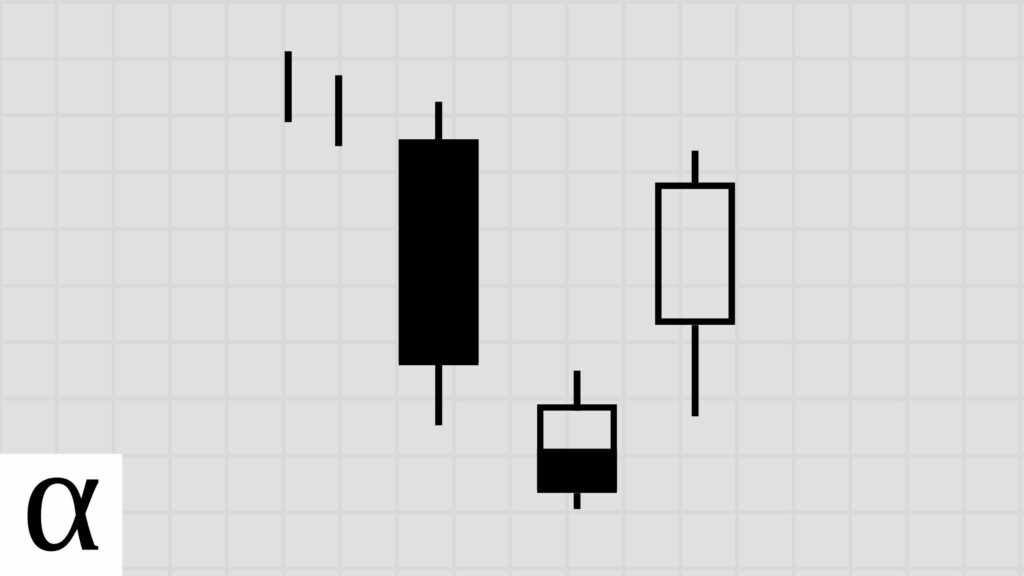
- The first candlestick must have a long bearish real body.
- The second candlestick must be a doji.
- There must be a downside gap where the wicks of the first and second candlesticks don’t touch.
- The third candle must be bullish with a real body that moves well within the first candle’s body.
- There must be an upside gap where the wicks of the second and third candlesticks don’t touch.
- The bullish abandoned baby must occur in a downtrend.
We can see a bullish abandoned baby above on the UBS Group (UBS) August 3rd, 2012 daily chart.
The price is below the fifty-day moving average, which we’re using as a proxy for a short-term bear market. We see the first red candle with a relatively long bearish body. Day two is a doji candle. And we see the third candlestick on day three is a large bullish candle that moves well within the first candle.
Now that we know how to identify this candle pattern on our charts, let’s cover the best bullish abandoned baby trading strategy.
How to Trade the Bullish Abandoned Baby Candlestick Pattern

We see this rare trend reversal pattern once again in the picture above.
The bullish abandoned baby pattern appeared on the KB Financial (KB) daily chart on November 1st, 2018.
Price is in a clear downtrend, as identified by the 50-day moving average. The first candle is a significant bearish candle, the following candle gaps down, and the third candle is a large bullish candle that moves well within the first candle’s opening and closing price.
With the pattern identified, traders go long at the break of the final candle’s high with a stop loss below the low of the second candle, assuming the prior trend reverses.
This is a profitable position for traders taking quick profits, but if that’s what you’re doing, you’re on the wrong side of history.
The backtest data shows, again without a lot of statistical significance, that these three candles typically lead to a longer-term trend reversal with an optimal profit target using a 1:5 risk-reward ratio.
Regarding profitability, what can traders expect from this pattern according to history?
Does the Bullish Abandoned Baby Candlestick Pattern Work? (Backtest Results)
I backtested the bullish abandoned baby candlestick pattern on the daily timeframe in the crypto, forex, and stock markets using the following rules:
- A close above the 50-day SMA constitutes an uptrend.
- I tested risk-reward ranges from 1 to 5.
- The optimal risk-reward ratio is selected using profit per bar.
- Entry and exits are discussed in the how-to trade section above.
- Confirmation must occur within three days of the pattern signal.
| Id | Pattern | Pattern Bars | Required Trend | Traditional Strategy | Market | Strategy | Setup | RR | Tickers | Signals | Trades | Trade Bars | Edge | Edge Per Bar | Confirm % | Win % | Cons Wins | Cons Losses | Avg. Trade Bars | Avg. Win Bars | Avg. Loss Bars | Details |
|---|---|---|---|---|---|---|---|---|---|---|---|---|---|---|---|---|---|---|---|---|---|---|
| 7,571 | bearish_three_line_strike | 4 | downtrend | bearish continuation | crypto | bearish continuation | high-close | 1 | 26 | 77 | 76 | 101 | -0.182 | -0.05 | 0.99 | 0.41 | 6 | 3 | 1.33 | 1.55 | 1.18 | https://analyzingalpha.com/bearish-three-line-strike-candlestick-pattern |
| 7,572 | bearish_three_line_strike | 4 | downtrend | bearish continuation | crypto | bearish continuation | high-close | 2 | 26 | 76 | 75 | 134 | -0.160 | -0.04 | 0.99 | 0.28 | 6 | 4 | 1.79 | 2.81 | 1.39 | https://analyzingalpha.com/bearish-three-line-strike-candlestick-pattern |
| 7,573 | bearish_three_line_strike | 4 | downtrend | bearish continuation | crypto | bearish continuation | high-close | 3 | 26 | 76 | 75 | 175 | 0.071 | 0.02 | 0.99 | 0.27 | 6 | 4 | 2.33 | 4.50 | 1.55 | https://analyzingalpha.com/bearish-three-line-strike-candlestick-pattern |
| 7,574 | bearish_three_line_strike | 4 | downtrend | bearish continuation | crypto | bearish continuation | high-close | 4 | 26 | 76 | 75 | 208 | 0.200 | 0.05 | 0.99 | 0.24 | 6 | 4 | 2.77 | 6.28 | 1.67 | https://analyzingalpha.com/bearish-three-line-strike-candlestick-pattern |
| 7,575 | bearish_three_line_strike | 4 | downtrend | bearish continuation | crypto | bearish continuation | high-close | 5 | 26 | 76 | 75 | 293 | 0.275 | 0.07 | 0.99 | 0.21 | 6 | 4 | 3.91 | 10.81 | 2.03 | https://analyzingalpha.com/bearish-three-line-strike-candlestick-pattern |
| 7,576 | bearish_three_line_strike | 4 | downtrend | bearish continuation | forex | bearish continuation | high-close | 1 | 287 | 856 | 849 | 1,225 | -0.475 | -0.12 | 0.99 | 0.27 | 4 | 8 | 1.44 | 1.24 | 1.51 | https://analyzingalpha.com/bearish-three-line-strike-candlestick-pattern |
| 7,577 | bearish_three_line_strike | 4 | downtrend | bearish continuation | forex | bearish continuation | high-close | 2 | 287 | 856 | 849 | 1,530 | -0.342 | -0.09 | 0.99 | 0.22 | 4 | 8 | 1.80 | 1.74 | 1.82 | https://analyzingalpha.com/bearish-three-line-strike-candlestick-pattern |
| 7,578 | bearish_three_line_strike | 4 | downtrend | bearish continuation | forex | bearish continuation | high-close | 3 | 287 | 856 | 849 | 1,716 | -0.240 | -0.06 | 0.99 | 0.19 | 4 | 8 | 2.02 | 2.37 | 1.94 | https://analyzingalpha.com/bearish-three-line-strike-candlestick-pattern |
| 7,579 | bearish_three_line_strike | 4 | downtrend | bearish continuation | forex | bearish continuation | high-close | 4 | 287 | 855 | 848 | 1,995 | -0.200 | -0.05 | 0.99 | 0.16 | 4 | 8 | 2.35 | 3.46 | 2.14 | https://analyzingalpha.com/bearish-three-line-strike-candlestick-pattern |
| 7,580 | bearish_three_line_strike | 4 | downtrend | bearish continuation | forex | bearish continuation | high-close | 5 | 287 | 855 | 847 | 2,242 | -0.170 | -0.04 | 0.99 | 0.14 | 4 | 8 | 2.65 | 4.72 | 2.32 | https://analyzingalpha.com/bearish-three-line-strike-candlestick-pattern |
| 7,581 | bearish_three_line_strike | 4 | downtrend | bearish continuation | stock | bearish continuation | high-close | 1 | 702 | 1,709 | 1,578 | 2,481 | -0.356 | -0.09 | 0.92 | 0.32 | 5 | 6 | 1.57 | 1.54 | 1.59 | https://analyzingalpha.com/bearish-three-line-strike-candlestick-pattern |
| 7,582 | bearish_three_line_strike | 4 | downtrend | bearish continuation | stock | bearish continuation | high-close | 2 | 702 | 1,708 | 1,577 | 3,041 | -0.136 | -0.03 | 0.92 | 0.29 | 4 | 6 | 1.93 | 2.16 | 1.84 | https://analyzingalpha.com/bearish-three-line-strike-candlestick-pattern |
| 7,583 | bearish_three_line_strike | 4 | downtrend | bearish continuation | stock | bearish continuation | high-close | 3 | 702 | 1,708 | 1,576 | 4,162 | 0.034 | 0.01 | 0.92 | 0.26 | 4 | 6 | 2.64 | 4.49 | 2.00 | https://analyzingalpha.com/bearish-three-line-strike-candlestick-pattern |
| 7,584 | bearish_three_line_strike | 4 | downtrend | bearish continuation | stock | bearish continuation | high-close | 4 | 702 | 1,708 | 1,576 | 4,744 | 0.154 | 0.04 | 0.92 | 0.23 | 3 | 6 | 3.01 | 4.57 | 2.54 | https://analyzingalpha.com/bearish-three-line-strike-candlestick-pattern |
| 7,585 | bearish_three_line_strike | 4 | downtrend | bearish continuation | stock | bearish continuation | high-close | 5 | 702 | 1,708 | 1,575 | 5,278 | 0.275 | 0.07 | 0.92 | 0.21 | 3 | 6 | 3.35 | 5.27 | 2.83 | https://analyzingalpha.com/bearish-three-line-strike-candlestick-pattern |
| 7,826 | bearish_three_line_strike | 4 | downtrend | bearish continuation | crypto | bearish continuation | high-low | 1 | 26 | 77 | 20 | 80 | 0.100 | 0.03 | 0.26 | 0.55 | 4 | 1 | 4.00 | 5.55 | 2.11 | https://analyzingalpha.com/bearish-three-line-strike-candlestick-pattern |
| 7,827 | bearish_three_line_strike | 4 | downtrend | bearish continuation | crypto | bearish continuation | high-low | 2 | 26 | 76 | 19 | 116 | 0.418 | 0.10 | 0.25 | 0.47 | 3 | 1 | 6.11 | 8.33 | 4.10 | https://analyzingalpha.com/bearish-three-line-strike-candlestick-pattern |
| 7,828 | bearish_three_line_strike | 4 | downtrend | bearish continuation | crypto | bearish continuation | high-low | 3 | 26 | 75 | 19 | 258 | 0.268 | 0.07 | 0.25 | 0.32 | 2 | 1 | 13.58 | 17.67 | 11.69 | https://analyzingalpha.com/bearish-three-line-strike-candlestick-pattern |
| 7,829 | bearish_three_line_strike | 4 | downtrend | bearish continuation | crypto | bearish continuation | high-low | 4 | 26 | 73 | 18 | 250 | -0.162 | -0.04 | 0.25 | 0.17 | 1 | 4 | 13.89 | 22.67 | 12.13 | https://analyzingalpha.com/bearish-three-line-strike-candlestick-pattern |
| 7,830 | bearish_three_line_strike | 4 | downtrend | bearish continuation | crypto | bearish continuation | high-low | 5 | 26 | 73 | 18 | 270 | -0.335 | -0.08 | 0.25 | 0.11 | 1 | 4 | 15.00 | 32.50 | 12.81 | https://analyzingalpha.com/bearish-three-line-strike-candlestick-pattern |
| 7,831 | bearish_three_line_strike | 4 | downtrend | bearish continuation | forex | bearish continuation | high-low | 1 | 287 | 856 | 204 | 807 | -0.441 | -0.11 | 0.24 | 0.28 | 2 | 4 | 3.96 | 5.39 | 3.40 | https://analyzingalpha.com/bearish-three-line-strike-candlestick-pattern |
| 7,832 | bearish_three_line_strike | 4 | downtrend | bearish continuation | forex | bearish continuation | high-low | 2 | 287 | 855 | 203 | 1,361 | -0.376 | -0.09 | 0.24 | 0.21 | 2 | 4 | 6.70 | 12.17 | 5.28 | https://analyzingalpha.com/bearish-three-line-strike-candlestick-pattern |
| 7,833 | bearish_three_line_strike | 4 | downtrend | bearish continuation | forex | bearish continuation | high-low | 3 | 287 | 853 | 201 | 1,920 | -0.428 | -0.11 | 0.24 | 0.14 | 2 | 4 | 9.55 | 16.62 | 8.36 | https://analyzingalpha.com/bearish-three-line-strike-candlestick-pattern |
| 7,834 | bearish_three_line_strike | 4 | downtrend | bearish continuation | forex | bearish continuation | high-low | 4 | 287 | 852 | 201 | 2,254 | -0.454 | -0.11 | 0.24 | 0.11 | 2 | 4 | 11.21 | 28.23 | 9.12 | https://analyzingalpha.com/bearish-three-line-strike-candlestick-pattern |
| 7,835 | bearish_three_line_strike | 4 | downtrend | bearish continuation | forex | bearish continuation | high-low | 5 | 287 | 852 | 201 | 2,669 | -0.425 | -0.11 | 0.24 | 0.10 | 2 | 4 | 13.28 | 43.84 | 10.09 | https://analyzingalpha.com/bearish-three-line-strike-candlestick-pattern |
| 7,836 | bearish_three_line_strike | 4 | downtrend | bearish continuation | stock | bearish continuation | high-low | 1 | 702 | 1,707 | 424 | 3,027 | -0.160 | -0.04 | 0.25 | 0.42 | 2 | 3 | 7.14 | 7.76 | 6.69 | https://analyzingalpha.com/bearish-three-line-strike-candlestick-pattern |
| 7,837 | bearish_three_line_strike | 4 | downtrend | bearish continuation | stock | bearish continuation | high-low | 2 | 702 | 1,704 | 424 | 7,001 | -0.158 | -0.04 | 0.25 | 0.28 | 2 | 3 | 16.51 | 28.83 | 11.70 | https://analyzingalpha.com/bearish-three-line-strike-candlestick-pattern |
| 7,838 | bearish_three_line_strike | 4 | downtrend | bearish continuation | stock | bearish continuation | high-low | 3 | 702 | 1,701 | 424 | 12,067 | -0.231 | -0.06 | 0.25 | 0.19 | 2 | 3 | 28.46 | 23.84 | 29.57 | https://analyzingalpha.com/bearish-three-line-strike-candlestick-pattern |
| 7,839 | bearish_three_line_strike | 4 | downtrend | bearish continuation | stock | bearish continuation | high-low | 4 | 702 | 1,699 | 424 | 16,148 | -0.238 | -0.06 | 0.25 | 0.15 | 2 | 3 | 38.08 | 75.98 | 31.22 | https://analyzingalpha.com/bearish-three-line-strike-candlestick-pattern |
| 7,840 | bearish_three_line_strike | 4 | downtrend | bearish continuation | stock | bearish continuation | high-low | 5 | 702 | 1,695 | 421 | 16,235 | -0.215 | -0.05 | 0.25 | 0.13 | 2 | 3 | 38.56 | 79.11 | 32.47 | https://analyzingalpha.com/bearish-three-line-strike-candlestick-pattern |
| 9,821 | bearish_three_line_strike | 4 | downtrend | bearish continuation | crypto | bullish reversal | low-high | 1 | 26 | 75 | 54 | 423 | 0.039 | 0.01 | 0.72 | 0.52 | 3 | 3 | 7.83 | 6.18 | 9.62 | https://analyzingalpha.com/bearish-three-line-strike-candlestick-pattern |
| 9,822 | bearish_three_line_strike | 4 | downtrend | bearish continuation | crypto | bullish reversal | low-high | 2 | 26 | 72 | 51 | 754 | 0.056 | 0.01 | 0.71 | 0.35 | 2 | 4 | 14.78 | 16.56 | 13.82 | https://analyzingalpha.com/bearish-three-line-strike-candlestick-pattern |
| 9,823 | bearish_three_line_strike | 4 | downtrend | bearish continuation | crypto | bullish reversal | low-high | 3 | 26 | 72 | 51 | 908 | 0.252 | 0.06 | 0.71 | 0.31 | 2 | 4 | 17.80 | 25.94 | 14.09 | https://analyzingalpha.com/bearish-three-line-strike-candlestick-pattern |
| 9,824 | bearish_three_line_strike | 4 | downtrend | bearish continuation | crypto | bullish reversal | low-high | 4 | 26 | 72 | 51 | 1,099 | 0.466 | 0.12 | 0.71 | 0.29 | 2 | 4 | 21.55 | 39.07 | 14.25 | https://analyzingalpha.com/bearish-three-line-strike-candlestick-pattern |
| 9,825 | bearish_three_line_strike | 4 | downtrend | bearish continuation | crypto | bullish reversal | low-high | 5 | 26 | 71 | 51 | 1,295 | 0.535 | 0.13 | 0.72 | 0.26 | 2 | 4 | 25.39 | 56.46 | 14.76 | https://analyzingalpha.com/bearish-three-line-strike-candlestick-pattern |
| 9,826 | bearish_three_line_strike | 4 | downtrend | bearish continuation | forex | bullish reversal | low-high | 1 | 287 | 851 | 678 | 6,949 | -0.218 | -0.05 | 0.80 | 0.39 | 4 | 4 | 10.25 | 10.19 | 10.29 | https://analyzingalpha.com/bearish-three-line-strike-candlestick-pattern |
| 9,827 | bearish_three_line_strike | 4 | downtrend | bearish continuation | forex | bullish reversal | low-high | 2 | 287 | 850 | 676 | 11,763 | -0.242 | -0.06 | 0.80 | 0.25 | 4 | 6 | 17.40 | 25.60 | 14.60 | https://analyzingalpha.com/bearish-three-line-strike-candlestick-pattern |
| 9,828 | bearish_three_line_strike | 4 | downtrend | bearish continuation | forex | bullish reversal | low-high | 3 | 287 | 847 | 673 | 17,130 | -0.243 | -0.06 | 0.79 | 0.19 | 4 | 8 | 25.45 | 41.88 | 21.63 | https://analyzingalpha.com/bearish-three-line-strike-candlestick-pattern |
| 9,829 | bearish_three_line_strike | 4 | downtrend | bearish continuation | forex | bullish reversal | low-high | 4 | 287 | 847 | 670 | 21,479 | -0.212 | -0.05 | 0.79 | 0.16 | 2 | 8 | 32.06 | 72.55 | 24.53 | https://analyzingalpha.com/bearish-three-line-strike-candlestick-pattern |
| 9,830 | bearish_three_line_strike | 4 | downtrend | bearish continuation | forex | bullish reversal | low-high | 5 | 287 | 847 | 670 | 25,084 | -0.180 | -0.05 | 0.79 | 0.14 | 2 | 8 | 37.44 | 105.02 | 26.82 | https://analyzingalpha.com/bearish-three-line-strike-candlestick-pattern |
| 9,831 | bearish_three_line_strike | 4 | downtrend | bearish continuation | stock | bullish reversal | low-high | 1 | 702 | 1,705 | 1,309 | 10,333 | 0.095 | 0.02 | 0.77 | 0.55 | 4 | 3 | 7.89 | 7.62 | 8.22 | https://analyzingalpha.com/bearish-three-line-strike-candlestick-pattern |
| 9,832 | bearish_three_line_strike | 4 | downtrend | bearish continuation | stock | bullish reversal | low-high | 2 | 702 | 1,703 | 1,308 | 21,023 | 0.108 | 0.03 | 0.77 | 0.37 | 3 | 4 | 16.07 | 17.78 | 15.07 | https://analyzingalpha.com/bearish-three-line-strike-candlestick-pattern |
| 9,833 | bearish_three_line_strike | 4 | downtrend | bearish continuation | stock | bullish reversal | low-high | 3 | 702 | 1,702 | 1,307 | 29,200 | 0.132 | 0.03 | 0.77 | 0.28 | 3 | 4 | 22.34 | 30.42 | 19.14 | https://analyzingalpha.com/bearish-three-line-strike-candlestick-pattern |
| 9,834 | bearish_three_line_strike | 4 | downtrend | bearish continuation | stock | bullish reversal | low-high | 4 | 702 | 1,701 | 1,307 | 36,880 | 0.196 | 0.05 | 0.77 | 0.24 | 3 | 4 | 28.22 | 45.86 | 22.66 | https://analyzingalpha.com/bearish-three-line-strike-candlestick-pattern |
| 9,835 | bearish_three_line_strike | 4 | downtrend | bearish continuation | stock | bullish reversal | low-high | 5 | 702 | 1,700 | 1,306 | 43,543 | 0.245 | 0.06 | 0.77 | 0.21 | 3 | 4 | 33.34 | 63.99 | 25.35 | https://analyzingalpha.com/bearish-three-line-strike-candlestick-pattern |
| 12,181 | bearish_three_line_strike | 4 | downtrend | bearish continuation | crypto | bearish mean reversion | atr-pattern_high | 1 | 26 | 77 | 42 | 173 | 0.478 | 0.12 | 0.55 | 0.74 | 2 | 2 | 4.12 | 4.13 | 4.09 | https://analyzingalpha.com/bearish-three-line-strike-candlestick-pattern |
| 12,182 | bearish_three_line_strike | 4 | downtrend | bearish continuation | crypto | bearish mean reversion | atr-pattern_high | 2 | 26 | 75 | 40 | 361 | 0.350 | 0.09 | 0.53 | 0.45 | 2 | 2 | 9.02 | 11.89 | 6.68 | https://analyzingalpha.com/bearish-three-line-strike-candlestick-pattern |
| 12,183 | bearish_three_line_strike | 4 | downtrend | bearish continuation | crypto | bearish mean reversion | atr-pattern_high | 3 | 26 | 74 | 39 | 497 | 0.535 | 0.13 | 0.53 | 0.39 | 1 | 2 | 12.74 | 19.20 | 8.71 | https://analyzingalpha.com/bearish-three-line-strike-candlestick-pattern |
| 12,184 | bearish_three_line_strike | 4 | downtrend | bearish continuation | crypto | bearish mean reversion | atr-pattern_high | 4 | 26 | 74 | 39 | 615 | 0.662 | 0.17 | 0.53 | 0.33 | 1 | 3 | 15.77 | 24.31 | 11.50 | https://analyzingalpha.com/bearish-three-line-strike-candlestick-pattern |
| 12,185 | bearish_three_line_strike | 4 | downtrend | bearish continuation | crypto | bearish mean reversion | atr-pattern_high | 5 | 26 | 74 | 39 | 1,139 | 0.225 | 0.06 | 0.53 | 0.21 | 1 | 3 | 29.21 | 55.00 | 22.55 | https://analyzingalpha.com/bearish-three-line-strike-candlestick-pattern |
| 12,186 | bearish_three_line_strike | 4 | downtrend | bearish continuation | forex | bearish mean reversion | atr-pattern_high | 1 | 287 | 855 | 548 | 2,641 | 0.355 | 0.09 | 0.64 | 0.68 | 5 | 3 | 4.82 | 4.12 | 6.27 | https://analyzingalpha.com/bearish-three-line-strike-candlestick-pattern |
| 12,187 | bearish_three_line_strike | 4 | downtrend | bearish continuation | forex | bearish mean reversion | atr-pattern_high | 2 | 287 | 853 | 545 | 5,675 | 0.466 | 0.12 | 0.64 | 0.49 | 5 | 3 | 10.41 | 11.84 | 9.05 | https://analyzingalpha.com/bearish-three-line-strike-candlestick-pattern |
| 12,188 | bearish_three_line_strike | 4 | downtrend | bearish continuation | forex | bearish mean reversion | atr-pattern_high | 3 | 287 | 849 | 544 | 9,088 | 0.360 | 0.09 | 0.64 | 0.34 | 4 | 4 | 16.71 | 23.12 | 13.40 | https://analyzingalpha.com/bearish-three-line-strike-candlestick-pattern |
| 12,189 | bearish_three_line_strike | 4 | downtrend | bearish continuation | forex | bearish mean reversion | atr-pattern_high | 4 | 287 | 847 | 544 | 12,548 | 0.320 | 0.08 | 0.64 | 0.27 | 3 | 4 | 23.07 | 39.36 | 17.20 | https://analyzingalpha.com/bearish-three-line-strike-candlestick-pattern |
| 12,190 | bearish_three_line_strike | 4 | downtrend | bearish continuation | forex | bearish mean reversion | atr-pattern_high | 5 | 287 | 843 | 542 | 15,829 | 0.300 | 0.08 | 0.64 | 0.22 | 3 | 4 | 29.20 | 59.94 | 20.74 | https://analyzingalpha.com/bearish-three-line-strike-candlestick-pattern |
| 12,191 | bearish_three_line_strike | 4 | downtrend | bearish continuation | stock | bearish mean reversion | atr-pattern_high | 1 | 702 | 1,709 | 1,028 | 4,071 | 0.182 | 0.05 | 0.60 | 0.59 | 4 | 3 | 3.96 | 3.83 | 4.14 | https://analyzingalpha.com/bearish-three-line-strike-candlestick-pattern |
| 12,192 | bearish_three_line_strike | 4 | downtrend | bearish continuation | stock | bearish mean reversion | atr-pattern_high | 2 | 702 | 1,705 | 1,026 | 8,225 | 0.164 | 0.04 | 0.60 | 0.39 | 3 | 3 | 8.02 | 10.00 | 6.77 | https://analyzingalpha.com/bearish-three-line-strike-candlestick-pattern |
| 12,193 | bearish_three_line_strike | 4 | downtrend | bearish continuation | stock | bearish mean reversion | atr-pattern_high | 3 | 702 | 1,705 | 1,025 | 12,004 | 0.188 | 0.05 | 0.60 | 0.30 | 3 | 3 | 11.71 | 16.66 | 9.63 | https://analyzingalpha.com/bearish-three-line-strike-candlestick-pattern |
| 12,194 | bearish_three_line_strike | 4 | downtrend | bearish continuation | stock | bearish mean reversion | atr-pattern_high | 4 | 702 | 1,701 | 1,021 | 17,385 | 0.138 | 0.03 | 0.60 | 0.23 | 3 | 3 | 17.03 | 29.24 | 13.44 | https://analyzingalpha.com/bearish-three-line-strike-candlestick-pattern |
| 12,195 | bearish_three_line_strike | 4 | downtrend | bearish continuation | stock | bearish mean reversion | atr-pattern_high | 5 | 702 | 1,697 | 1,018 | 24,878 | 0.120 | 0.03 | 0.60 | 0.19 | 3 | 3 | 24.44 | 43.84 | 20.02 | https://analyzingalpha.com/bearish-three-line-strike-candlestick-pattern |
| 12,391 | bearish_three_line_strike | 4 | downtrend | bearish continuation | crypto | bullish reversal | low-close | 1 | 26 | 75 | 74 | 444 | -0.024 | -0.01 | 0.99 | 0.49 | 3 | 2 | 6.00 | 4.64 | 7.29 | https://analyzingalpha.com/bearish-three-line-strike-candlestick-pattern |
| 12,392 | bearish_three_line_strike | 4 | downtrend | bearish continuation | crypto | bullish reversal | low-close | 2 | 26 | 72 | 71 | 854 | -0.070 | -0.02 | 0.99 | 0.31 | 2 | 3 | 12.03 | 13.64 | 11.31 | https://analyzingalpha.com/bearish-three-line-strike-candlestick-pattern |
| 12,393 | bearish_three_line_strike | 4 | downtrend | bearish continuation | crypto | bullish reversal | low-close | 3 | 26 | 72 | 71 | 955 | -0.043 | -0.01 | 0.99 | 0.24 | 2 | 5 | 13.45 | 20.53 | 11.22 | https://analyzingalpha.com/bearish-three-line-strike-candlestick-pattern |
| 12,394 | bearish_three_line_strike | 4 | downtrend | bearish continuation | crypto | bullish reversal | low-close | 4 | 26 | 72 | 71 | 1,088 | 0.196 | 0.05 | 0.99 | 0.24 | 2 | 5 | 15.32 | 28.35 | 11.22 | https://analyzingalpha.com/bearish-three-line-strike-candlestick-pattern |
| 12,395 | bearish_three_line_strike | 4 | downtrend | bearish continuation | crypto | bullish reversal | low-close | 5 | 26 | 71 | 70 | 1,279 | 0.280 | 0.07 | 0.99 | 0.21 | 2 | 5 | 18.27 | 42.47 | 11.67 | https://analyzingalpha.com/bearish-three-line-strike-candlestick-pattern |
| 12,396 | bearish_three_line_strike | 4 | downtrend | bearish continuation | forex | bullish reversal | low-close | 1 | 287 | 849 | 832 | 7,134 | -0.163 | -0.04 | 0.98 | 0.42 | 4 | 5 | 8.57 | 8.46 | 8.66 | https://analyzingalpha.com/bearish-three-line-strike-candlestick-pattern |
| 12,397 | bearish_three_line_strike | 4 | downtrend | bearish continuation | forex | bullish reversal | low-close | 2 | 287 | 847 | 828 | 11,958 | -0.218 | -0.05 | 0.98 | 0.26 | 3 | 6 | 14.44 | 18.81 | 12.90 | https://analyzingalpha.com/bearish-three-line-strike-candlestick-pattern |
| 12,398 | bearish_three_line_strike | 4 | downtrend | bearish continuation | forex | bullish reversal | low-close | 3 | 287 | 845 | 826 | 17,280 | -0.215 | -0.05 | 0.98 | 0.20 | 2 | 8 | 20.92 | 30.20 | 18.67 | https://analyzingalpha.com/bearish-three-line-strike-candlestick-pattern |
| 12,399 | bearish_three_line_strike | 4 | downtrend | bearish continuation | forex | bullish reversal | low-close | 4 | 287 | 844 | 822 | 21,564 | -0.192 | -0.05 | 0.97 | 0.16 | 2 | 8 | 26.23 | 47.03 | 22.22 | https://analyzingalpha.com/bearish-three-line-strike-candlestick-pattern |
| 12,400 | bearish_three_line_strike | 4 | downtrend | bearish continuation | forex | bullish reversal | low-close | 5 | 287 | 844 | 821 | 25,114 | -0.145 | -0.04 | 0.97 | 0.14 | 2 | 8 | 30.59 | 72.56 | 23.62 | https://analyzingalpha.com/bearish-three-line-strike-candlestick-pattern |
| 12,401 | bearish_three_line_strike | 4 | downtrend | bearish continuation | stock | bullish reversal | low-close | 1 | 702 | 1,706 | 1,527 | 10,789 | 0.079 | 0.02 | 0.90 | 0.54 | 4 | 4 | 7.07 | 6.57 | 7.65 | https://analyzingalpha.com/bearish-three-line-strike-candlestick-pattern |
| 12,402 | bearish_three_line_strike | 4 | downtrend | bearish continuation | stock | bullish reversal | low-close | 2 | 702 | 1,703 | 1,522 | 21,177 | 0.110 | 0.03 | 0.89 | 0.37 | 3 | 5 | 13.91 | 16.01 | 12.69 | https://analyzingalpha.com/bearish-three-line-strike-candlestick-pattern |
| 12,403 | bearish_three_line_strike | 4 | downtrend | bearish continuation | stock | bullish reversal | low-close | 3 | 702 | 1,702 | 1,522 | 29,076 | 0.163 | 0.04 | 0.89 | 0.29 | 3 | 5 | 19.10 | 26.91 | 15.90 | https://analyzingalpha.com/bearish-three-line-strike-candlestick-pattern |
| 12,404 | bearish_three_line_strike | 4 | downtrend | bearish continuation | stock | bullish reversal | low-close | 4 | 702 | 1,701 | 1,521 | 37,470 | 0.250 | 0.06 | 0.89 | 0.25 | 3 | 5 | 24.64 | 41.47 | 19.03 | https://analyzingalpha.com/bearish-three-line-strike-candlestick-pattern |
| 12,405 | bearish_three_line_strike | 4 | downtrend | bearish continuation | stock | bullish reversal | low-close | 5 | 702 | 1,699 | 1,520 | 44,453 | 0.265 | 0.07 | 0.89 | 0.21 | 3 | 5 | 29.25 | 58.00 | 21.55 | https://analyzingalpha.com/bearish-three-line-strike-candlestick-pattern |
| 13,306 | bearish_three_line_strike | 4 | downtrend | bearish continuation | crypto | bullish mean reversion | atr-pattern_low | 1 | 26 | 76 | 14 | 73 | 0.000 | 0.00 | 0.18 | 0.50 | 3 | 1 | 5.21 | 5.14 | 5.29 | https://analyzingalpha.com/bearish-three-line-strike-candlestick-pattern |
| 13,307 | bearish_three_line_strike | 4 | downtrend | bearish continuation | crypto | bullish mean reversion | atr-pattern_low | 2 | 26 | 76 | 14 | 86 | 0.074 | 0.02 | 0.18 | 0.36 | 1 | 1 | 6.14 | 8.00 | 5.11 | https://analyzingalpha.com/bearish-three-line-strike-candlestick-pattern |
| 13,308 | bearish_three_line_strike | 4 | downtrend | bearish continuation | crypto | bullish mean reversion | atr-pattern_low | 3 | 26 | 75 | 14 | 125 | -0.148 | -0.04 | 0.19 | 0.21 | 1 | 3 | 8.93 | 13.00 | 7.82 | https://analyzingalpha.com/bearish-three-line-strike-candlestick-pattern |
| 13,309 | bearish_three_line_strike | 4 | downtrend | bearish continuation | crypto | bullish mean reversion | atr-pattern_low | 4 | 26 | 75 | 14 | 147 | 0.066 | 0.02 | 0.19 | 0.21 | 1 | 3 | 10.50 | 20.33 | 7.82 | https://analyzingalpha.com/bearish-three-line-strike-candlestick-pattern |
| 13,310 | bearish_three_line_strike | 4 | downtrend | bearish continuation | crypto | bullish mean reversion | atr-pattern_low | 5 | 26 | 75 | 14 | 148 | 0.280 | 0.07 | 0.19 | 0.21 | 1 | 3 | 10.57 | 20.67 | 7.82 | https://analyzingalpha.com/bearish-three-line-strike-candlestick-pattern |
| 13,311 | bearish_three_line_strike | 4 | downtrend | bearish continuation | forex | bullish mean reversion | atr-pattern_low | 1 | 287 | 856 | 150 | 486 | 0.183 | 0.05 | 0.18 | 0.59 | 3 | 2 | 3.24 | 3.11 | 3.43 | https://analyzingalpha.com/bearish-three-line-strike-candlestick-pattern |
| 13,312 | bearish_three_line_strike | 4 | downtrend | bearish continuation | forex | bullish mean reversion | atr-pattern_low | 2 | 287 | 856 | 150 | 1,133 | 0.236 | 0.06 | 0.18 | 0.41 | 3 | 3 | 7.55 | 8.82 | 6.66 | https://analyzingalpha.com/bearish-three-line-strike-candlestick-pattern |
| 13,313 | bearish_three_line_strike | 4 | downtrend | bearish continuation | forex | bullish mean reversion | atr-pattern_low | 3 | 287 | 856 | 150 | 1,506 | 0.280 | 0.07 | 0.18 | 0.32 | 2 | 3 | 10.04 | 13.27 | 8.52 | https://analyzingalpha.com/bearish-three-line-strike-candlestick-pattern |
| 13,314 | bearish_three_line_strike | 4 | downtrend | bearish continuation | forex | bullish mean reversion | atr-pattern_low | 4 | 287 | 856 | 149 | 1,954 | 0.308 | 0.08 | 0.17 | 0.26 | 2 | 3 | 13.11 | 17.90 | 11.42 | https://analyzingalpha.com/bearish-three-line-strike-candlestick-pattern |
| 13,315 | bearish_three_line_strike | 4 | downtrend | bearish continuation | forex | bullish mean reversion | atr-pattern_low | 5 | 287 | 856 | 149 | 2,811 | 0.325 | 0.08 | 0.17 | 0.22 | 2 | 3 | 18.87 | 28.18 | 16.22 | https://analyzingalpha.com/bearish-three-line-strike-candlestick-pattern |
| 13,316 | bearish_three_line_strike | 4 | downtrend | bearish continuation | stock | bullish mean reversion | atr-pattern_low | 1 | 702 | 1,708 | 290 | 1,176 | 0.197 | 0.05 | 0.17 | 0.60 | 3 | 2 | 4.06 | 3.68 | 4.62 | https://analyzingalpha.com/bearish-three-line-strike-candlestick-pattern |
| 13,317 | bearish_three_line_strike | 4 | downtrend | bearish continuation | stock | bullish mean reversion | atr-pattern_low | 2 | 702 | 1,706 | 290 | 2,336 | 0.286 | 0.07 | 0.17 | 0.43 | 2 | 2 | 8.06 | 10.09 | 6.54 | https://analyzingalpha.com/bearish-three-line-strike-candlestick-pattern |
| 13,318 | bearish_three_line_strike | 4 | downtrend | bearish continuation | stock | bullish mean reversion | atr-pattern_low | 3 | 702 | 1,706 | 290 | 3,445 | 0.468 | 0.12 | 0.17 | 0.37 | 2 | 2 | 11.88 | 17.30 | 8.76 | https://analyzingalpha.com/bearish-three-line-strike-candlestick-pattern |
| 13,319 | bearish_three_line_strike | 4 | downtrend | bearish continuation | stock | bullish mean reversion | atr-pattern_low | 4 | 702 | 1,706 | 290 | 4,533 | 0.488 | 0.12 | 0.17 | 0.30 | 2 | 2 | 15.63 | 25.24 | 11.58 | https://analyzingalpha.com/bearish-three-line-strike-candlestick-pattern |
| 13,320 | bearish_three_line_strike | 4 | downtrend | bearish continuation | stock | bullish mean reversion | atr-pattern_low | 5 | 702 | 1,704 | 289 | 6,056 | 0.480 | 0.12 | 0.17 | 0.25 | 2 | 2 | 20.96 | 33.72 | 16.80 | https://analyzingalpha.com/bearish-three-line-strike-candlestick-pattern |
| Market | Strategy | Setup | Trades | Edge |
Pattern:
Pattern Bars:
Required Trend:
Traditional Strategy:
Market:
Strategy:
Setup:
RR:
Tickers:
Signals:
Trades:
Trade Bars:
Edge:
Edge Per Bar:
Confirm %:
Win %:
Cons Wins:
Cons Losses:
Avg. Trade Bars:
Avg. Win Bars:
Avg. Loss Bars:
Similar Patterns
Many candlestick patterns look similar to bullish abandoned baby candle patterns.
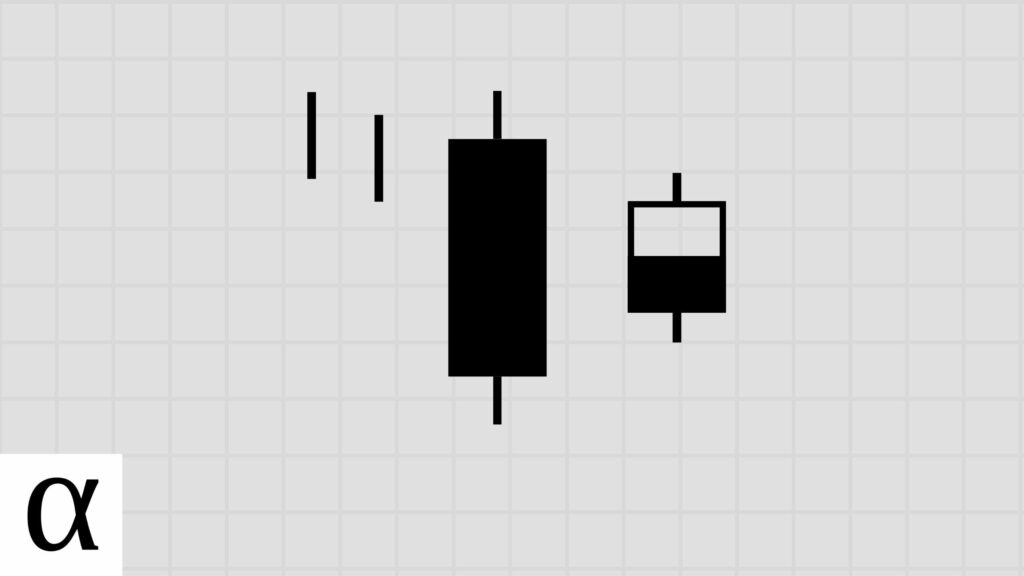
Bearish Abandoned Baby vs. Bullish Abandoned Baby

The bearish abandoned baby candlestick pattern and bullish abandoned baby are mirror opposites. They are three bar reversal candlestick patterns occurring in a downtrend and uptrend, respectively, with one being bullish and the other being bearish.
The first candle of the bearish abandoned baby is bullish instead of bearish. The middle candlestick gaps up instead of gapping down, and the third candlestick is bearish and moves well within the first bearish candle’s real body.
Morning Doji Star vs. Bullish Abandoned Baby
The morning doji star candlestick pattern, which is different than the morning star pattern, is almost identical to the bullish abandoned baby. The difference is that the morning star is a two-bar candlestick pattern that does not have a third candle requirement.
Bullish Harami vs. Bullish Abandoned Baby
The bullish harami candlestick pattern has a sizeable bearish candle followed by a second candle engulfed by the previous. In contrast, the abandoned baby has a second candle entirely above the last.
So while these patterns are different in identification, they are similar in name. Harami means pregnant in Japanese; their middle candles are the pattern’s babies, while the first are considered mothers.
The Bottom Line
The bullish abandoned baby is an extremely rare three-bar reversal pattern occurring only in the stock market. The data points toward the pattern working as intended, but unfortunately, it occurs infrequently to state this with any statistical certainty.
If you’re interested in going bullish with regularity, use my backtest results to find frequently occurring bullish reversal candlestick patterns.