The homing pigeon is a two-bar bullish reversal Japanese candlestick pattern that is traded using various strategies across the crypto, stock, and forex markets.
If you’re following traditional homing pigeon trading advice, you’re likely losing money or making meager profits at best.
Keep reading if you’re a candlestick technical analyst looking to make your profits soar to new heights using the best falling three methods candlestick pattern according to historical data.
What Is a Homing Pigeon Candlestick Pattern?

The homing pigeon candlestick pattern is a two-bar reversal pattern with mixed results.
The homing pigeon’s name comes from its bird-like characteristics on a candlestick chart where the first candle is the pigeon’s wings and the second is its head.
And while the name may help you remember the pattern, it does not help you trade it. But before we learn how to trade this two-bar pattern optimally in each market, let’s take a birds-eye-view at how to identify it.
How to Identify the Falling Three Methods Candlestick Pattern

The following are the requirements for a valid homing pigeon candlestick pattern:
- The first candle must be bearish and long.
- The second candle must be bearish and short, with its real body fitting within the previous real body.
- The homing pigeon must occur during a downtrend.
We see the homing pigeon on the Amazon (AMZN) August 15th, 2019, daily chart.
Price is in a bearish trend below the fifty-day moving average. The first candlestick is long and bearish. The second candle is short and bearish, with a real body engulfed by the prior real body, fulfilling our homing pigeon pattern requirements.
Now that we know how to identify this rare bird, how do we profit from this supposed bullish reversal pattern?
How to Trade Homing Pigeon Candlestick Patterns
The homing pigeon candlestick pattern should be traded as intended in the crypto markets, using a bearish mean reversion strategy in forex and a bullish mean reversion strategy in the stock market, according to our backtests.
Let’s learn how this pattern is typically traded, and then I’ll provide updated entry criteria making it the optimal homing pigeon crypto trading strategy.
Homing Pigeon Bullish Reversal Trade Setup

Let’s practice identifying the homing pigeon pattern.
The homing pigeon’s last candle is below the fifty-day moving average, which we consider a downward bearish price trend. There’s a sizeable bearish candle followed by a smaller bullish candle whose real body fits inside the previous, fulfilling the pattern requirements.
With the homing pigeon identified, traditional traders go long at a break of the second candle’s high, setting a stop loss below the same day’s low.
We can see that this Bitcoin trader stacked their satoshis–but history tells us there’s a better way. Data-driven crypto traders should enter long at the break of the close, not the high, to capture a better risk-reward trade.
Stock traders should go in the same direction using a different technique.
Homing Pigeon Bullish Mean Reversion Trade Setup

With the pattern identified, data-driven stock traders wait for the price to cross below the homing pigeon’s low and enter long when the price moves back above the low, setting a stop loss of one ATR.
Let’s use the Tesla (TSLA) April 24th, 2018, daily chart to make this lucid.
The pattern low occurs on the second candle at $18.56. The price crosses below and back above the low the next day, triggering a long entry. This mean reversion strategy led to profits for data-driven stock traders.
Professional forex traders should also capitalize on this pattern’s mean reversion tendencies in the other direction.
Homing Pigeon Bearish Mean Reversion Trade Setup

With the bird identified on the January 23rd, 2019, daily chart, data-driven forex traders wait for the price to cross above the homing pigeon pattern’s high and enter short when the price moves below the low, setting a stop loss of one ATR.
The pattern high occurs on the first day at $39.05. The price crosses above this high the day after pattern identification, alerting mean reversion traders to be ready for an entry. The price opens below the high the following day and goes against the trader. The next day the price gaps down, providing windfall profits to this currency trader.
Speaking of profits, what can history tell us about the best homing pigeon candlestick trading strategies?
Does the Homing Pigeon Candlestick Pattern Work? (Backtest Results)
I backtested the homing pigeon candlestick pattern on the daily timeframe in the crypto, forex, and stock markets using the following rules:
- A close above the 50-day SMA constitutes an uptrend.
- I tested risk-reward ranges from 1 to 5.
- The optimal risk-reward ratio is selected using profit per bar.
- Entry and exits are discussed in the how-to trade section above.
- Confirmation must occur within three days of the pattern signal.
| Id | Pattern | Pattern Bars | Required Trend | Traditional Strategy | Market | Strategy | Setup | RR | Tickers | Signals | Trades | Trade Bars | Edge | Edge Per Bar | Confirm % | Win % | Cons Wins | Cons Losses | Avg. Trade Bars | Avg. Win Bars | Avg. Loss Bars | Details |
|---|---|---|---|---|---|---|---|---|---|---|---|---|---|---|---|---|---|---|---|---|---|---|
| 7,781 | homing_pigeon | 2 | downtrend | bullish reversal | crypto | bullish mean reversion | atr-pattern_low | 1 | 97 | 326 | 160 | 952 | 0.339 | 0.17 | 0.49 | 0.67 | 3 | 3 | 5.95 | 5.37 | 7.11 | https://analyzingalpha.com/homing-pigeon-candlestick-pattern |
| 7,782 | homing_pigeon | 2 | downtrend | bullish reversal | crypto | bullish mean reversion | atr-pattern_low | 2 | 97 | 321 | 156 | 2,003 | 0.312 | 0.16 | 0.49 | 0.44 | 3 | 4 | 12.84 | 12.65 | 12.99 | https://analyzingalpha.com/homing-pigeon-candlestick-pattern |
| 7,783 | homing_pigeon | 2 | downtrend | bullish reversal | crypto | bullish mean reversion | atr-pattern_low | 3 | 97 | 318 | 154 | 2,703 | 0.246 | 0.12 | 0.48 | 0.31 | 3 | 4 | 17.55 | 21.65 | 15.70 | https://analyzingalpha.com/homing-pigeon-candlestick-pattern |
| 7,784 | homing_pigeon | 2 | downtrend | bullish reversal | crypto | bullish mean reversion | atr-pattern_low | 4 | 97 | 315 | 151 | 3,032 | 0.158 | 0.08 | 0.48 | 0.23 | 2 | 4 | 20.08 | 27.69 | 17.78 | https://analyzingalpha.com/homing-pigeon-candlestick-pattern |
| 7,785 | homing_pigeon | 2 | downtrend | bullish reversal | crypto | bullish mean reversion | atr-pattern_low | 5 | 97 | 315 | 151 | 3,322 | 0.315 | 0.16 | 0.48 | 0.22 | 2 | 4 | 22.00 | 34.97 | 18.37 | https://analyzingalpha.com/homing-pigeon-candlestick-pattern |
| 7,786 | homing_pigeon | 2 | downtrend | bullish reversal | forex | bullish mean reversion | atr-pattern_low | 1 | 380 | 1,884 | 975 | 4,436 | 0.300 | 0.15 | 0.52 | 0.65 | 14 | 4 | 4.55 | 4.00 | 5.57 | https://analyzingalpha.com/homing-pigeon-candlestick-pattern |
| 7,787 | homing_pigeon | 2 | downtrend | bullish reversal | forex | bullish mean reversion | atr-pattern_low | 2 | 380 | 1,822 | 946 | 14,199 | 0.162 | 0.08 | 0.52 | 0.39 | 6 | 7 | 15.01 | 18.25 | 12.97 | https://analyzingalpha.com/homing-pigeon-candlestick-pattern |
| 7,788 | homing_pigeon | 2 | downtrend | bullish reversal | forex | bullish mean reversion | atr-pattern_low | 3 | 380 | 1,794 | 925 | 21,573 | 0.074 | 0.04 | 0.52 | 0.27 | 3 | 11 | 23.32 | 36.65 | 18.44 | https://analyzingalpha.com/homing-pigeon-candlestick-pattern |
| 7,789 | homing_pigeon | 2 | downtrend | bullish reversal | forex | bullish mean reversion | atr-pattern_low | 4 | 380 | 1,779 | 914 | 26,335 | 0.038 | 0.02 | 0.51 | 0.21 | 3 | 13 | 28.81 | 50.29 | 23.22 | https://analyzingalpha.com/homing-pigeon-candlestick-pattern |
| 7,790 | homing_pigeon | 2 | downtrend | bullish reversal | forex | bullish mean reversion | atr-pattern_low | 5 | 380 | 1,773 | 908 | 30,125 | 0.035 | 0.02 | 0.51 | 0.17 | 3 | 13 | 33.18 | 76.48 | 24.12 | https://analyzingalpha.com/homing-pigeon-candlestick-pattern |
| 7,791 | homing_pigeon | 2 | downtrend | bullish reversal | stock | bullish mean reversion | atr-pattern_low | 1 | 5,103 | 99,227 | 50,606 | 201,283 | 0.158 | 0.08 | 0.51 | 0.58 | 16 | 9 | 3.98 | 3.82 | 4.19 | https://analyzingalpha.com/homing-pigeon-candlestick-pattern |
| 7,792 | homing_pigeon | 2 | downtrend | bullish reversal | stock | bullish mean reversion | atr-pattern_low | 2 | 5,103 | 97,462 | 49,582 | 373,403 | 0.250 | 0.13 | 0.51 | 0.42 | 10 | 15 | 7.53 | 8.89 | 6.57 | https://analyzingalpha.com/homing-pigeon-candlestick-pattern |
| 7,793 | homing_pigeon | 2 | downtrend | bullish reversal | stock | bullish mean reversion | atr-pattern_low | 3 | 5,103 | 96,008 | 48,717 | 536,848 | 0.311 | 0.16 | 0.51 | 0.33 | 8 | 16 | 11.02 | 15.49 | 8.85 | https://analyzingalpha.com/homing-pigeon-candlestick-pattern |
| 7,794 | homing_pigeon | 2 | downtrend | bullish reversal | stock | bullish mean reversion | atr-pattern_low | 4 | 5,103 | 94,931 | 48,087 | 691,996 | 0.380 | 0.19 | 0.51 | 0.28 | 8 | 20 | 14.39 | 23.72 | 10.85 | https://analyzingalpha.com/homing-pigeon-candlestick-pattern |
| 7,795 | homing_pigeon | 2 | downtrend | bullish reversal | stock | bullish mean reversion | atr-pattern_low | 5 | 5,103 | 94,059 | 47,602 | 845,411 | 0.435 | 0.22 | 0.51 | 0.24 | 5 | 20 | 17.76 | 33.41 | 12.84 | https://analyzingalpha.com/homing-pigeon-candlestick-pattern |
| 8,816 | homing_pigeon | 2 | downtrend | bullish reversal | crypto | bearish continuation | high-low | 1 | 97 | 331 | 202 | 902 | -0.338 | -0.17 | 0.61 | 0.33 | 4 | 4 | 4.47 | 6.63 | 3.39 | https://analyzingalpha.com/homing-pigeon-candlestick-pattern |
| 8,817 | homing_pigeon | 2 | downtrend | bullish reversal | crypto | bearish continuation | high-low | 2 | 97 | 318 | 194 | 1,561 | -0.368 | -0.18 | 0.61 | 0.21 | 3 | 4 | 8.05 | 17.05 | 5.63 | https://analyzingalpha.com/homing-pigeon-candlestick-pattern |
| 8,818 | homing_pigeon | 2 | downtrend | bullish reversal | crypto | bearish continuation | high-low | 3 | 97 | 314 | 190 | 1,959 | -0.308 | -0.15 | 0.61 | 0.17 | 3 | 4 | 10.31 | 20.88 | 8.09 | https://analyzingalpha.com/homing-pigeon-candlestick-pattern |
| 8,819 | homing_pigeon | 2 | downtrend | bullish reversal | crypto | bearish continuation | high-low | 4 | 97 | 314 | 190 | 2,387 | -0.416 | -0.21 | 0.61 | 0.12 | 3 | 4 | 12.56 | 35.09 | 9.61 | https://analyzingalpha.com/homing-pigeon-candlestick-pattern |
| 8,820 | homing_pigeon | 2 | downtrend | bullish reversal | crypto | bearish continuation | high-low | 5 | 97 | 308 | 183 | 3,219 | -0.445 | -0.22 | 0.59 | 0.09 | 3 | 4 | 17.59 | 21.53 | 17.19 | https://analyzingalpha.com/homing-pigeon-candlestick-pattern |
| 8,821 | homing_pigeon | 2 | downtrend | bullish reversal | forex | bearish continuation | high-low | 1 | 380 | 1,888 | 1,167 | 5,680 | -0.317 | -0.16 | 0.62 | 0.34 | 10 | 15 | 4.87 | 5.75 | 4.41 | https://analyzingalpha.com/homing-pigeon-candlestick-pattern |
| 8,822 | homing_pigeon | 2 | downtrend | bullish reversal | forex | bearish continuation | high-low | 2 | 380 | 1,851 | 1,139 | 9,549 | -0.314 | -0.16 | 0.62 | 0.23 | 5 | 15 | 8.38 | 11.22 | 7.54 | https://analyzingalpha.com/homing-pigeon-candlestick-pattern |
| 8,823 | homing_pigeon | 2 | downtrend | bullish reversal | forex | bearish continuation | high-low | 3 | 380 | 1,832 | 1,126 | 12,115 | -0.274 | -0.14 | 0.61 | 0.18 | 4 | 15 | 10.76 | 21.91 | 8.28 | https://analyzingalpha.com/homing-pigeon-candlestick-pattern |
| 8,824 | homing_pigeon | 2 | downtrend | bullish reversal | forex | bearish continuation | high-low | 4 | 380 | 1,813 | 1,116 | 15,680 | -0.262 | -0.13 | 0.62 | 0.15 | 4 | 15 | 14.05 | 33.93 | 10.62 | https://analyzingalpha.com/homing-pigeon-candlestick-pattern |
| 8,825 | homing_pigeon | 2 | downtrend | bullish reversal | forex | bearish continuation | high-low | 5 | 380 | 1,806 | 1,113 | 18,889 | -0.260 | -0.13 | 0.62 | 0.12 | 4 | 15 | 16.97 | 48.59 | 12.50 | https://analyzingalpha.com/homing-pigeon-candlestick-pattern |
| 8,826 | homing_pigeon | 2 | downtrend | bullish reversal | stock | bearish continuation | high-low | 1 | 5,103 | 101,364 | 70,368 | 191,803 | -0.125 | -0.06 | 0.69 | 0.44 | 27 | 17 | 2.73 | 2.88 | 2.60 | https://analyzingalpha.com/homing-pigeon-candlestick-pattern |
| 8,827 | homing_pigeon | 2 | downtrend | bullish reversal | stock | bearish continuation | high-low | 2 | 5,103 | 99,554 | 69,041 | 307,353 | -0.108 | -0.05 | 0.69 | 0.30 | 22 | 28 | 4.45 | 5.85 | 3.86 | https://analyzingalpha.com/homing-pigeon-candlestick-pattern |
| 8,828 | homing_pigeon | 2 | downtrend | bullish reversal | stock | bearish continuation | high-low | 3 | 5,103 | 97,970 | 67,916 | 416,535 | -0.117 | -0.06 | 0.69 | 0.22 | 16 | 28 | 6.13 | 9.52 | 5.17 | https://analyzingalpha.com/homing-pigeon-candlestick-pattern |
| 8,829 | homing_pigeon | 2 | downtrend | bullish reversal | stock | bearish continuation | high-low | 4 | 5,103 | 96,675 | 66,945 | 522,175 | -0.138 | -0.07 | 0.69 | 0.17 | 13 | 31 | 7.80 | 13.93 | 6.52 | https://analyzingalpha.com/homing-pigeon-candlestick-pattern |
| 8,830 | homing_pigeon | 2 | downtrend | bullish reversal | stock | bearish continuation | high-low | 5 | 5,103 | 95,498 | 66,091 | 622,574 | -0.160 | -0.08 | 0.69 | 0.14 | 12 | 32 | 9.42 | 19.30 | 7.81 | https://analyzingalpha.com/homing-pigeon-candlestick-pattern |
| 9,176 | homing_pigeon | 2 | downtrend | bullish reversal | crypto | bullish reversal | low-high | 1 | 97 | 326 | 202 | 621 | -0.199 | -0.10 | 0.62 | 0.40 | 3 | 4 | 3.07 | 3.21 | 2.98 | https://analyzingalpha.com/homing-pigeon-candlestick-pattern |
| 9,177 | homing_pigeon | 2 | downtrend | bullish reversal | crypto | bullish reversal | low-high | 2 | 97 | 326 | 200 | 891 | -0.130 | -0.07 | 0.61 | 0.29 | 3 | 7 | 4.46 | 6.34 | 3.68 | https://analyzingalpha.com/homing-pigeon-candlestick-pattern |
| 9,178 | homing_pigeon | 2 | downtrend | bullish reversal | crypto | bullish reversal | low-high | 3 | 97 | 326 | 200 | 1,032 | 0.000 | 0.00 | 0.61 | 0.25 | 3 | 7 | 5.16 | 8.04 | 4.20 | https://analyzingalpha.com/homing-pigeon-candlestick-pattern |
| 9,179 | homing_pigeon | 2 | downtrend | bullish reversal | crypto | bullish reversal | low-high | 4 | 97 | 326 | 200 | 1,254 | 0.000 | 0.00 | 0.61 | 0.20 | 3 | 7 | 6.27 | 12.82 | 4.63 | https://analyzingalpha.com/homing-pigeon-candlestick-pattern |
| 9,180 | homing_pigeon | 2 | downtrend | bullish reversal | crypto | bullish reversal | low-high | 5 | 97 | 326 | 200 | 1,524 | -0.015 | -0.01 | 0.61 | 0.17 | 2 | 7 | 7.62 | 14.91 | 6.18 | https://analyzingalpha.com/homing-pigeon-candlestick-pattern |
| 9,181 | homing_pigeon | 2 | downtrend | bullish reversal | forex | bullish reversal | low-high | 1 | 380 | 1,892 | 1,164 | 6,180 | -0.381 | -0.19 | 0.62 | 0.31 | 4 | 14 | 5.31 | 5.52 | 5.22 | https://analyzingalpha.com/homing-pigeon-candlestick-pattern |
| 9,182 | homing_pigeon | 2 | downtrend | bullish reversal | forex | bullish reversal | low-high | 2 | 380 | 1,887 | 1,161 | 9,468 | -0.374 | -0.19 | 0.62 | 0.21 | 3 | 19 | 8.16 | 14.29 | 6.55 | https://analyzingalpha.com/homing-pigeon-candlestick-pattern |
| 9,183 | homing_pigeon | 2 | downtrend | bullish reversal | forex | bullish reversal | low-high | 3 | 380 | 1,879 | 1,156 | 12,942 | -0.372 | -0.19 | 0.62 | 0.16 | 3 | 24 | 11.20 | 22.54 | 9.10 | https://analyzingalpha.com/homing-pigeon-candlestick-pattern |
| 9,184 | homing_pigeon | 2 | downtrend | bullish reversal | forex | bullish reversal | low-high | 4 | 380 | 1,872 | 1,150 | 15,716 | -0.362 | -0.18 | 0.61 | 0.13 | 3 | 24 | 13.67 | 32.02 | 11.00 | https://analyzingalpha.com/homing-pigeon-candlestick-pattern |
| 9,185 | homing_pigeon | 2 | downtrend | bullish reversal | forex | bullish reversal | low-high | 5 | 380 | 1,867 | 1,146 | 18,674 | -0.330 | -0.17 | 0.61 | 0.11 | 3 | 24 | 16.29 | 49.30 | 12.14 | https://analyzingalpha.com/homing-pigeon-candlestick-pattern |
| 9,186 | homing_pigeon | 2 | downtrend | bullish reversal | stock | bullish reversal | low-high | 1 | 5,103 | 100,760 | 67,500 | 178,068 | -0.141 | -0.07 | 0.67 | 0.43 | 9 | 16 | 2.64 | 2.89 | 2.45 | https://analyzingalpha.com/homing-pigeon-candlestick-pattern |
| 9,187 | homing_pigeon | 2 | downtrend | bullish reversal | stock | bullish reversal | low-high | 2 | 5,103 | 99,927 | 66,898 | 285,473 | -0.062 | -0.03 | 0.67 | 0.31 | 6 | 20 | 4.27 | 5.90 | 3.52 | https://analyzingalpha.com/homing-pigeon-candlestick-pattern |
| 9,188 | homing_pigeon | 2 | downtrend | bullish reversal | stock | bullish reversal | low-high | 3 | 5,103 | 99,142 | 66,333 | 392,035 | 0.000 | 0.00 | 0.67 | 0.25 | 5 | 23 | 5.91 | 9.94 | 4.57 | https://analyzingalpha.com/homing-pigeon-candlestick-pattern |
| 9,189 | homing_pigeon | 2 | downtrend | bullish reversal | stock | bullish reversal | low-high | 4 | 5,103 | 98,491 | 65,854 | 493,344 | 0.050 | 0.03 | 0.67 | 0.21 | 4 | 27 | 7.49 | 14.76 | 5.56 | https://analyzingalpha.com/homing-pigeon-candlestick-pattern |
| 9,190 | homing_pigeon | 2 | downtrend | bullish reversal | stock | bullish reversal | low-high | 5 | 5,103 | 97,878 | 65,436 | 594,934 | 0.090 | 0.05 | 0.67 | 0.18 | 4 | 31 | 9.09 | 20.32 | 6.59 | https://analyzingalpha.com/homing-pigeon-candlestick-pattern |
| 10,751 | homing_pigeon | 2 | downtrend | bullish reversal | crypto | bearish continuation | high-close | 1 | 97 | 332 | 305 | 910 | -0.203 | -0.10 | 0.92 | 0.40 | 5 | 5 | 2.98 | 3.45 | 2.68 | https://analyzingalpha.com/homing-pigeon-candlestick-pattern |
| 10,752 | homing_pigeon | 2 | downtrend | bullish reversal | crypto | bearish continuation | high-close | 2 | 97 | 329 | 301 | 1,541 | -0.222 | -0.11 | 0.91 | 0.26 | 4 | 6 | 5.12 | 4.69 | 5.27 | https://analyzingalpha.com/homing-pigeon-candlestick-pattern |
| 10,753 | homing_pigeon | 2 | downtrend | bullish reversal | crypto | bearish continuation | high-close | 3 | 97 | 329 | 301 | 1,869 | -0.163 | -0.08 | 0.91 | 0.21 | 3 | 6 | 6.21 | 9.05 | 5.46 | https://analyzingalpha.com/homing-pigeon-candlestick-pattern |
| 10,754 | homing_pigeon | 2 | downtrend | bullish reversal | crypto | bearish continuation | high-close | 4 | 97 | 327 | 298 | 1,929 | -0.184 | -0.09 | 0.91 | 0.16 | 3 | 6 | 6.47 | 7.31 | 6.31 | https://analyzingalpha.com/homing-pigeon-candlestick-pattern |
| 10,755 | homing_pigeon | 2 | downtrend | bullish reversal | crypto | bearish continuation | high-close | 5 | 97 | 323 | 293 | 2,134 | -0.115 | -0.06 | 0.91 | 0.15 | 3 | 6 | 7.28 | 10.95 | 6.65 | https://analyzingalpha.com/homing-pigeon-candlestick-pattern |
| 10,756 | homing_pigeon | 2 | downtrend | bullish reversal | forex | bearish continuation | high-close | 1 | 380 | 1,925 | 1,874 | 4,258 | -0.163 | -0.08 | 0.97 | 0.42 | 19 | 8 | 2.27 | 2.15 | 2.36 | https://analyzingalpha.com/homing-pigeon-candlestick-pattern |
| 10,757 | homing_pigeon | 2 | downtrend | bullish reversal | forex | bearish continuation | high-close | 2 | 380 | 1,905 | 1,856 | 6,181 | -0.072 | -0.04 | 0.97 | 0.31 | 12 | 9 | 3.33 | 3.58 | 3.22 | https://analyzingalpha.com/homing-pigeon-candlestick-pattern |
| 10,758 | homing_pigeon | 2 | downtrend | bullish reversal | forex | bearish continuation | high-close | 3 | 380 | 1,879 | 1,831 | 7,744 | -0.043 | -0.02 | 0.97 | 0.24 | 8 | 21 | 4.23 | 5.98 | 3.68 | https://analyzingalpha.com/homing-pigeon-candlestick-pattern |
| 10,759 | homing_pigeon | 2 | downtrend | bullish reversal | forex | bearish continuation | high-close | 4 | 380 | 1,870 | 1,820 | 9,531 | 0.038 | 0.02 | 0.97 | 0.21 | 8 | 21 | 5.24 | 8.16 | 4.48 | https://analyzingalpha.com/homing-pigeon-candlestick-pattern |
| 10,760 | homing_pigeon | 2 | downtrend | bullish reversal | forex | bearish continuation | high-close | 5 | 380 | 1,858 | 1,809 | 11,343 | 0.065 | 0.03 | 0.97 | 0.18 | 8 | 21 | 6.27 | 11.82 | 5.08 | https://analyzingalpha.com/homing-pigeon-candlestick-pattern |
| 10,761 | homing_pigeon | 2 | downtrend | bullish reversal | stock | bearish continuation | high-close | 1 | 5,103 | 102,512 | 91,609 | 161,728 | -0.124 | -0.06 | 0.89 | 0.44 | 40 | 17 | 1.77 | 1.83 | 1.71 | https://analyzingalpha.com/homing-pigeon-candlestick-pattern |
| 10,762 | homing_pigeon | 2 | downtrend | bullish reversal | stock | bearish continuation | high-close | 2 | 5,103 | 101,510 | 90,675 | 234,976 | -0.004 | 0.00 | 0.89 | 0.33 | 28 | 20 | 2.59 | 3.11 | 2.33 | https://analyzingalpha.com/homing-pigeon-candlestick-pattern |
| 10,763 | homing_pigeon | 2 | downtrend | bullish reversal | stock | bearish continuation | high-close | 3 | 5,103 | 100,435 | 89,688 | 308,296 | 0.068 | 0.03 | 0.89 | 0.27 | 25 | 22 | 3.44 | 4.64 | 3.00 | https://analyzingalpha.com/homing-pigeon-candlestick-pattern |
| 10,764 | homing_pigeon | 2 | downtrend | bullish reversal | stock | bearish continuation | high-close | 4 | 5,103 | 99,480 | 88,809 | 376,369 | 0.104 | 0.05 | 0.89 | 0.22 | 20 | 40 | 4.24 | 6.46 | 3.61 | https://analyzingalpha.com/homing-pigeon-candlestick-pattern |
| 10,765 | homing_pigeon | 2 | downtrend | bullish reversal | stock | bearish continuation | high-close | 5 | 5,103 | 98,580 | 87,958 | 442,401 | 0.125 | 0.06 | 0.89 | 0.19 | 19 | 40 | 5.03 | 8.29 | 4.28 | https://analyzingalpha.com/homing-pigeon-candlestick-pattern |
| 10,996 | homing_pigeon | 2 | downtrend | bullish reversal | crypto | bearish mean reversion | atr-pattern_high | 1 | 97 | 326 | 104 | 461 | 0.157 | 0.08 | 0.32 | 0.58 | 3 | 2 | 4.43 | 3.68 | 5.45 | https://analyzingalpha.com/homing-pigeon-candlestick-pattern |
| 10,997 | homing_pigeon | 2 | downtrend | bullish reversal | crypto | bearish mean reversion | atr-pattern_high | 2 | 97 | 320 | 104 | 1,107 | 0.072 | 0.04 | 0.32 | 0.36 | 2 | 3 | 10.64 | 13.62 | 9.00 | https://analyzingalpha.com/homing-pigeon-candlestick-pattern |
| 10,998 | homing_pigeon | 2 | downtrend | bullish reversal | crypto | bearish mean reversion | atr-pattern_high | 3 | 97 | 317 | 104 | 1,943 | 0.040 | 0.02 | 0.33 | 0.26 | 2 | 3 | 18.68 | 39.26 | 11.47 | https://analyzingalpha.com/homing-pigeon-candlestick-pattern |
| 10,999 | homing_pigeon | 2 | downtrend | bullish reversal | crypto | bearish mean reversion | atr-pattern_high | 4 | 97 | 311 | 102 | 3,530 | -0.066 | -0.03 | 0.33 | 0.19 | 2 | 3 | 34.61 | 64.63 | 27.73 | https://analyzingalpha.com/homing-pigeon-candlestick-pattern |
| 11,000 | homing_pigeon | 2 | downtrend | bullish reversal | crypto | bearish mean reversion | atr-pattern_high | 5 | 97 | 308 | 100 | 4,344 | -0.340 | -0.17 | 0.32 | 0.11 | 2 | 3 | 43.44 | 60.64 | 41.31 | https://analyzingalpha.com/homing-pigeon-candlestick-pattern |
| 11,001 | homing_pigeon | 2 | downtrend | bullish reversal | forex | bearish mean reversion | atr-pattern_high | 1 | 380 | 1,901 | 625 | 2,777 | 0.316 | 0.16 | 0.33 | 0.66 | 14 | 4 | 4.44 | 4.07 | 5.16 | https://analyzingalpha.com/homing-pigeon-candlestick-pattern |
| 11,002 | homing_pigeon | 2 | downtrend | bullish reversal | forex | bearish mean reversion | atr-pattern_high | 2 | 380 | 1,855 | 602 | 7,949 | 0.260 | 0.13 | 0.32 | 0.42 | 6 | 9 | 13.20 | 16.94 | 10.50 | https://analyzingalpha.com/homing-pigeon-candlestick-pattern |
| 11,003 | homing_pigeon | 2 | downtrend | bullish reversal | forex | bearish mean reversion | atr-pattern_high | 3 | 380 | 1,820 | 586 | 13,284 | 0.237 | 0.12 | 0.32 | 0.31 | 6 | 9 | 22.67 | 31.84 | 18.57 | https://analyzingalpha.com/homing-pigeon-candlestick-pattern |
| 11,004 | homing_pigeon | 2 | downtrend | bullish reversal | forex | bearish mean reversion | atr-pattern_high | 4 | 380 | 1,791 | 573 | 15,461 | 0.212 | 0.11 | 0.32 | 0.24 | 5 | 9 | 26.98 | 38.12 | 23.42 | https://analyzingalpha.com/homing-pigeon-candlestick-pattern |
| 11,005 | homing_pigeon | 2 | downtrend | bullish reversal | forex | bearish mean reversion | atr-pattern_high | 5 | 380 | 1,773 | 565 | 18,967 | 0.220 | 0.11 | 0.32 | 0.20 | 4 | 11 | 33.57 | 53.70 | 28.43 | https://analyzingalpha.com/homing-pigeon-candlestick-pattern |
| 11,006 | homing_pigeon | 2 | downtrend | bullish reversal | stock | bearish mean reversion | atr-pattern_high | 1 | 5,103 | 100,107 | 35,882 | 129,472 | 0.120 | 0.06 | 0.36 | 0.56 | 22 | 8 | 3.61 | 3.42 | 3.85 | https://analyzingalpha.com/homing-pigeon-candlestick-pattern |
| 11,007 | homing_pigeon | 2 | downtrend | bullish reversal | stock | bearish mean reversion | atr-pattern_high | 2 | 5,103 | 98,359 | 35,181 | 248,639 | 0.088 | 0.04 | 0.36 | 0.36 | 15 | 14 | 7.07 | 8.40 | 6.31 | https://analyzingalpha.com/homing-pigeon-candlestick-pattern |
| 11,008 | homing_pigeon | 2 | downtrend | bullish reversal | stock | bearish mean reversion | atr-pattern_high | 3 | 5,103 | 96,943 | 34,610 | 352,995 | 0.074 | 0.04 | 0.36 | 0.27 | 13 | 17 | 10.20 | 14.66 | 8.56 | https://analyzingalpha.com/homing-pigeon-candlestick-pattern |
| 11,009 | homing_pigeon | 2 | downtrend | bullish reversal | stock | bearish mean reversion | atr-pattern_high | 4 | 5,103 | 95,765 | 34,088 | 459,939 | 0.042 | 0.02 | 0.36 | 0.21 | 9 | 17 | 13.49 | 22.54 | 11.12 | https://analyzingalpha.com/homing-pigeon-candlestick-pattern |
| 11,010 | homing_pigeon | 2 | downtrend | bullish reversal | stock | bearish mean reversion | atr-pattern_high | 5 | 5,103 | 94,600 | 33,597 | 557,490 | 0.010 | 0.01 | 0.36 | 0.17 | 8 | 19 | 16.59 | 32.37 | 13.41 | https://analyzingalpha.com/homing-pigeon-candlestick-pattern |
| 11,161 | homing_pigeon | 2 | downtrend | bullish reversal | crypto | bullish reversal | low-close | 1 | 97 | 332 | 315 | 951 | -0.116 | -0.06 | 0.95 | 0.44 | 4 | 4 | 3.02 | 2.24 | 3.65 | https://analyzingalpha.com/homing-pigeon-candlestick-pattern |
| 11,162 | homing_pigeon | 2 | downtrend | bullish reversal | crypto | bullish reversal | low-close | 2 | 97 | 329 | 311 | 1,151 | 0.044 | 0.02 | 0.95 | 0.35 | 3 | 5 | 3.70 | 2.78 | 4.19 | https://analyzingalpha.com/homing-pigeon-candlestick-pattern |
| 11,163 | homing_pigeon | 2 | downtrend | bullish reversal | crypto | bullish reversal | low-close | 3 | 97 | 328 | 309 | 1,238 | 0.163 | 0.08 | 0.94 | 0.29 | 3 | 11 | 4.01 | 2.76 | 4.52 | https://analyzingalpha.com/homing-pigeon-candlestick-pattern |
| 11,164 | homing_pigeon | 2 | downtrend | bullish reversal | crypto | bullish reversal | low-close | 4 | 97 | 328 | 309 | 1,544 | 0.346 | 0.17 | 0.94 | 0.27 | 3 | 11 | 5.00 | 5.55 | 4.79 | https://analyzingalpha.com/homing-pigeon-candlestick-pattern |
| 11,165 | homing_pigeon | 2 | downtrend | bullish reversal | crypto | bullish reversal | low-close | 5 | 97 | 328 | 309 | 1,665 | 0.480 | 0.24 | 0.94 | 0.25 | 3 | 11 | 5.39 | 4.58 | 5.65 | https://analyzingalpha.com/homing-pigeon-candlestick-pattern |
| 11,166 | homing_pigeon | 2 | downtrend | bullish reversal | forex | bullish reversal | low-close | 1 | 380 | 1,920 | 1,870 | 4,542 | -0.284 | -0.14 | 0.97 | 0.36 | 3 | 12 | 2.43 | 2.58 | 2.34 | https://analyzingalpha.com/homing-pigeon-candlestick-pattern |
| 11,167 | homing_pigeon | 2 | downtrend | bullish reversal | forex | bullish reversal | low-close | 2 | 380 | 1,910 | 1,860 | 7,369 | -0.248 | -0.12 | 0.97 | 0.25 | 3 | 18 | 3.96 | 5.06 | 3.59 | https://analyzingalpha.com/homing-pigeon-candlestick-pattern |
| 11,168 | homing_pigeon | 2 | downtrend | bullish reversal | forex | bullish reversal | low-close | 3 | 380 | 1,902 | 1,851 | 9,702 | -0.212 | -0.11 | 0.97 | 0.20 | 3 | 28 | 5.24 | 8.28 | 4.50 | https://analyzingalpha.com/homing-pigeon-candlestick-pattern |
| 11,169 | homing_pigeon | 2 | downtrend | bullish reversal | forex | bullish reversal | low-close | 4 | 380 | 1,898 | 1,847 | 12,099 | -0.216 | -0.11 | 0.97 | 0.16 | 3 | 28 | 6.55 | 12.52 | 5.44 | https://analyzingalpha.com/homing-pigeon-candlestick-pattern |
| 11,170 | homing_pigeon | 2 | downtrend | bullish reversal | forex | bullish reversal | low-close | 5 | 380 | 1,895 | 1,844 | 13,631 | -0.205 | -0.10 | 0.97 | 0.13 | 3 | 35 | 7.39 | 16.21 | 6.03 | https://analyzingalpha.com/homing-pigeon-candlestick-pattern |
| 11,171 | homing_pigeon | 2 | downtrend | bullish reversal | stock | bullish reversal | low-close | 1 | 5,103 | 102,224 | 93,483 | 144,181 | -0.178 | -0.09 | 0.91 | 0.41 | 9 | 17 | 1.54 | 1.65 | 1.47 | https://analyzingalpha.com/homing-pigeon-candlestick-pattern |
| 11,172 | homing_pigeon | 2 | downtrend | bullish reversal | stock | bullish reversal | low-close | 2 | 5,103 | 101,835 | 93,109 | 199,940 | 0.014 | 0.01 | 0.91 | 0.34 | 8 | 18 | 2.15 | 2.60 | 1.92 | https://analyzingalpha.com/homing-pigeon-candlestick-pattern |
| 11,173 | homing_pigeon | 2 | downtrend | bullish reversal | stock | bullish reversal | low-close | 3 | 5,103 | 101,384 | 92,676 | 255,832 | 0.151 | 0.08 | 0.91 | 0.29 | 8 | 20 | 2.76 | 3.78 | 2.35 | https://analyzingalpha.com/homing-pigeon-candlestick-pattern |
| 11,174 | homing_pigeon | 2 | downtrend | bullish reversal | stock | bullish reversal | low-close | 4 | 5,103 | 100,987 | 92,295 | 309,055 | 0.258 | 0.13 | 0.91 | 0.25 | 5 | 26 | 3.35 | 5.18 | 2.73 | https://analyzingalpha.com/homing-pigeon-candlestick-pattern |
| 11,175 | homing_pigeon | 2 | downtrend | bullish reversal | stock | bullish reversal | low-close | 5 | 5,103 | 100,599 | 91,927 | 365,807 | 0.345 | 0.17 | 0.91 | 0.23 | 5 | 30 | 3.98 | 6.77 | 3.17 | https://analyzingalpha.com/homing-pigeon-candlestick-pattern |
| Market | Strategy | Setup | Trades | Edge |
Pattern:
Pattern Bars:
Required Trend:
Traditional Strategy:
Market:
Strategy:
Setup:
RR:
Tickers:
Signals:
Trades:
Trade Bars:
Edge:
Edge Per Bar:
Confirm %:
Win %:
Cons Wins:
Cons Losses:
Avg. Trade Bars:
Avg. Win Bars:
Avg. Loss Bars:
Similar Candlestick Patterns
Multiple candlestick patterns are often confused with the homing pigeon pattern. It’s essential to understand the differences when using candlestick pattern technical analysis.
Bullish Harami vs. Homing Pigeon
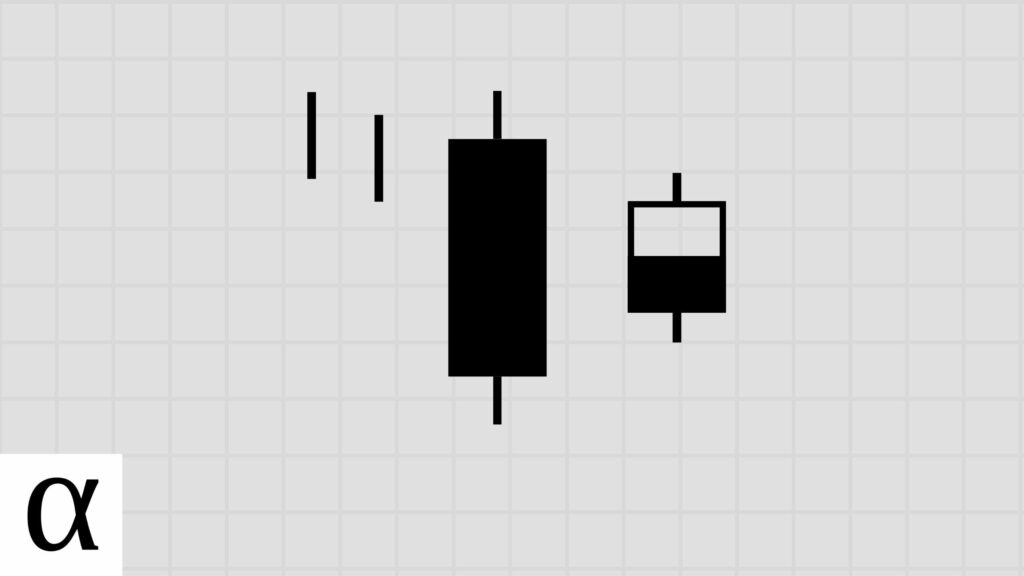
The bullish harami candlestick pattern is a two-bar bullish reversal pattern where the second candle’s real body fits within the prior real body. The only difference between the bullish harami and the homing pigeon is the color of the second candle. The bullish harami’s second candle is bullish, whereas the homing pigeon’s candle is bearish.
Both of these patterns are traditionally traded using bullish reversal patterns, but history tells us capturing future volatility is likely a better bet in most markets.
Identical Three Crows vs. Homing Pigeon
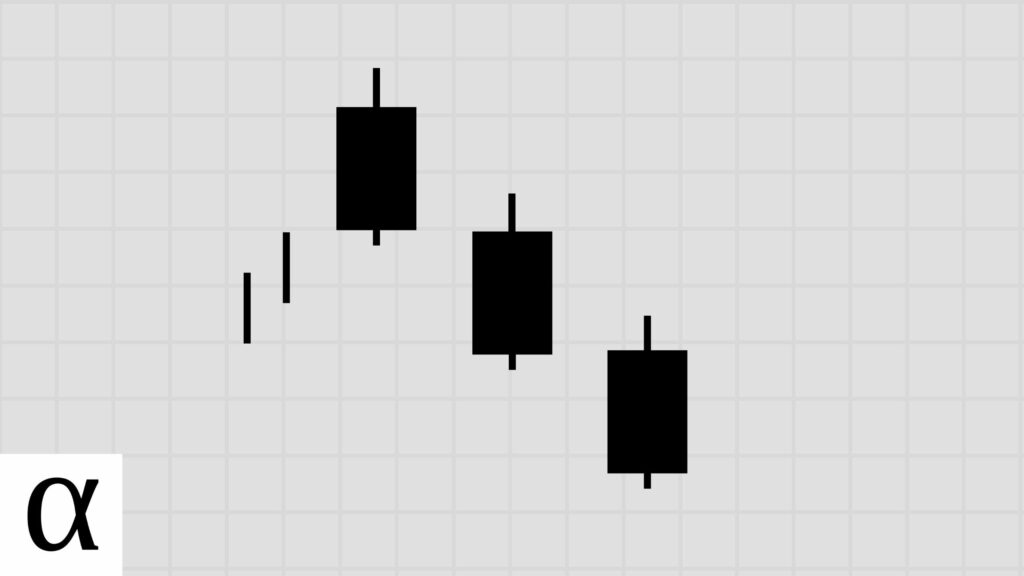
The identical three crows is a three-bar bearish reversal pattern. The patterns are entirely different but often get confused due to their bird-like names. The key to distinguishing them is to remember the three crows require three candles.
The Bottom Line
The homing pigeon is a two-bar bullish reversal pattern that’s best traded as intended in the crypto market, using a bearish mean reversion strategy in the forex market, and a bullish mean reversion strategy in the stock market, according to a 21-year backtest.
Want to know more? I ranked and reviewed every Japanese candlestick pattern.