The ladder bottom candlestick pattern is a rare five-bar bullish reversal Japanese candlestick pattern that is best traded as intended in the stock market in an extensive backtest.
Data-driven traders requiring statistical significance should avoid these patterns in the crypto and forex markets.
If you’re a stock trader following traditional inverted hammer candlestick strategies, you’re leaving money on the table if you’re using the typical entry.
Keep reading to learn how to climb your profits to new heights using history’s best ladder bottom trading strategy.
What Is a Ladder Bottom Candlestick Pattern?

The ladder bottom candlestick pattern is a rare five-bar bullish reversal pattern.
The ladder bottom gets its name from the consecutive downtrend candles representing a ladder on a candlestick chart.
The pattern leads to bullish action, but optimizing the entry and exit are critical. But before we learn the best ladder bottom trading strategy, let’s learn how to identify this five-bar pattern.
How to Identify the Ladder Bottom Candlestick Pattern
The following are the requirements for a valid ladder bottom candlestick pattern:
- Three bearish candles with consecutively lower open and closes.
- A fourth bearish candle with an upper shadow.
- A fifth bullish candle opens above the prior body and closes above the previous high.
- The ladder bottom must occur in a downtrend.
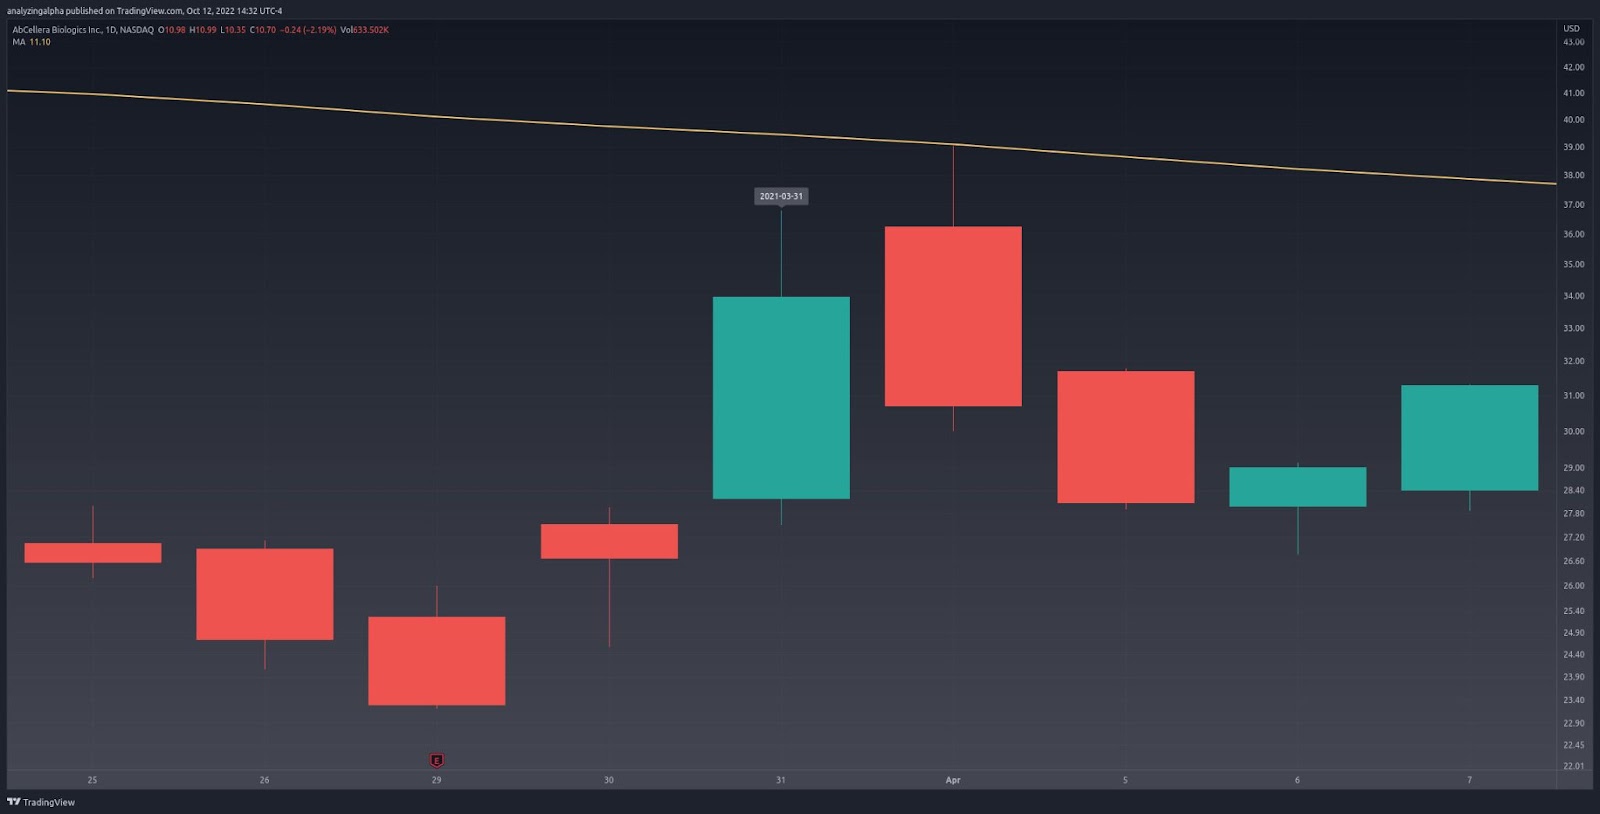
We saw the ladder bottom on the Abcellera (ABCL) daily chart on March 31st, 2021.
The price is below the fifty-day simple moving average, giving us a bearish trend. We see three bearish candles consecutively opening and closing lower. The fourth candle is bearish and has a tiny wick, which still fulfills that candle’s requirement. The fifth candle is bullish, opens above the fourth candle’s real body, and closes above the high.
How do we trade these five-bar patterns optimally now that we can identify them?
How to Trade Ladder Bottom Candlestick Patterns
The ladder bottom candlestick pattern should be traded using a bullish reversal strategy in the stock market using an adjusted entry, according to a 21-year backtest.
Forex and crypto traders should avoid trading this pattern as there are not enough data to identify a statistically significant best ladder bottom trading strategy.
Let’s learn how traders typically enter when trading this five-candle pattern, and then I’ll show you how professional, history-driven traders improve upon it.
Ladder Bottom Bullish Reversal Trade Setup

Let’s practice identifying the ladder bottom pattern.
We see that that price action is in a downtrend below the fifty-day simple moving average. There are three consecutive bearish candles with lower opens and closes. The fourth candle is bearish with an upper shadow. The fifth candle opens above the close and closes above the high.
With the ladder bottom identified, traditional traders enter long at a break of the fifth candle’s high and set a stop loss below the fourth candle’s low. These traders will likely make money as this setup has a historically positive expectancy.
According to history, these traders will leave money on the table.
Data-driven traders enter long at a break of the close, instead of the high, with a stop loss below the low.
Let’s use the Amazon September 27th, 2017, daily chart to make this lucid. The fifth candle closes at $47.54, with a high of $47.77. Price gaps up the next day, triggering an immediate entry for our data-driven trader. The traditional trader entered later that day with a higher risk and lower reward.
The data-driven trader made excellent profits, and the traditional trader did okay.
Speaking of profits, what does history tell us about the best ladder bottom trading strategy?
Does the Ladder Bottom Candlestick Pattern Work? (Backtest Results)
Using the following rules, I backtested the ladder bottom candlestick pattern on the daily timeframe in the crypto, forex, and stock markets.
- A close above the 50-day SMA constitutes an uptrend.
- I tested risk-reward ranges from 1 to 5.
- The optimal risk-reward ratio is selected using profit per bar.
- Entry and exits are discussed in the how-to trade section above.
- Confirmation must occur within three days of the pattern signal.
Similar Candlestick Patterns
Multiple candlestick patterns are often confused with the ladder bottom pattern. It’s critical to identify each pattern correctly on your candlestick charts.
Concealing Baby Swallow vs. Ladder Bottom

The concealing baby swallow candlestick pattern is a four-bar bullish reversal pattern. The concealing baby swallow and the ladder bottom get confused because they’re both multiple-candle bullish reversal patterns.
The concealing baby has four black candles. The first two are bearish marubozu candles. The third candle gaps down but has an upper shadow that extends into the prior candle. The fourth candle completely engulfs the previous candle.
The concealing baby swallow and the ladder bottom are best traded as intended using the modified close entry.
The Bottom Line
The ladder bottom is an infrequent five-bar bullish reversal pattern that is best traded as intended utilizing the close for an entry in the stock market, according to a 21-year backtest.
Data-driven crypto and forex traders should avoid this pattern due to a lack of statistical significance. It’s better to trade more frequent downtrend candlestick patterns.