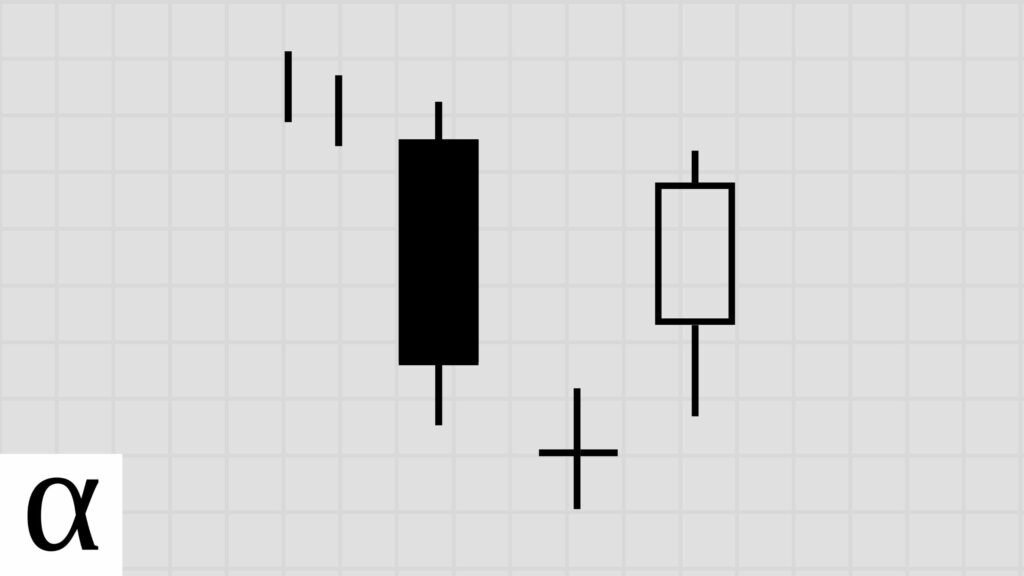
The bullish doji star is a two-bar bullish-reversal Japanese candlestick pattern that historically leads to bullish price action.
Traders using conventional doji star candlestick methods lose money in every market tested.
Not so great, right?
But what if I told you that you could turn this unprofitable bullish doji star pattern into a profitable one by listening to history?
Would that pique your curiosity?
If so, read on to learn how to trade bullish doji star patterns in a data-driven, profitable way.
What Is a Bullish Doji Star Candlestick Pattern

The bullish doji star is a two-bar pattern that supposedly alerts traders of a bullish reversal. But unfortunately, history tells us otherwise.
The bullish doji star gets its name from the star indecision candlestick that’s supposed to be the pivot of the move.
But before we dive into the past performance of this bullish doji star pattern, let’s learn to identify this pattern on our candlestick charts.
How to Identify the Bullish Doji Star Candlestick Pattern

The following are the requirements for a valid bullish doji star pattern:
- The first candle must have a long bearish real body.
- The second candle must be a doji that gaps down.
- The bullish doji star must occur in a downtrend.
We see the bullish doji star on the Apple (AAPL) daily chart occurring on March 19th, 2021. The price trend is down as prices are below the 50-day simple moving average. The first bar is a relatively long bearish candlestick followed by a gap down doji – a doji is a candlestick where the opening and closing prices are similar.
With an understanding of how to identify this supposed bullish reversal pattern, let’s learn the best trading strategies for the bullish doji star.
How to Trade the Bullish Doji Candlestick Pattern
The bullish doji candlestick pattern is traded optimally as a bullish reversal in the stock market, a bullish mean reversion in the crypto and forex markets.
Let’s understand how this pattern is traded traditionally and review how data-driven traders can optimize this setup to be profitable in the stock market.
Bullish Doji Star Bullish Reversal Trade Setup

Let’s practice identifying the bullish doji star again.
The bullish doji star pattern occurs on Adobe’s November 12th, 2020, daily chart. We see a large bearish candle followed by a gap down into a star doji. The price is below the 50-day simple moving average at the time of the final candle, which we’re using to determine a short-term bear market or downtrend.
With the pattern identified, traders traditionally enter long on a break of the high of the doji with a stop loss below the low of the same doji.
Data-driven stock market traders expect a longer-term move using a 1:5 risk-reward ratio. And as we can see from the above Adobe chart, these traders profited nicely.
Now that we know the best trading strategy for the stock market, let’s review the optimal crypto trading strategy.
Bullish Doji Star Bullish Mean Reversion Trade Setup

The crypto price is in a downtrend as it’s below the 50-day simple moving average. We see a long-bodied bearish candle on the first day, followed by a second-day bearish doji that gaped down.
With the pattern identified, data-driven forex and crypto traders wait for the price to cross below the low of the two candlesticks pattern and enter long when prices come back up through that low with a stop loss of one ATR above the same price.
Let’s clarify this using the Bitcoin chart on December 10th, 2021.
The low of the doji star pattern occurs on the second day at $46,900. The next day, the price falls below and back above the low, trigging an entry. The bulls take over, and the price moves up and to the right for a nice profit.
Speaking of satoshis, what can the data tell us about the best bullish doji star trading strategies?
Does the Bullish Doji Star Pattern Work? (Backtest Results)
I backtested the bullish doji star candlestick pattern on the daily timeframe in the crypto, forex, and stock markets using the following rules:
- A close above the 50-day SMA constitutes an uptrend.
- I tested risk-reward ranges from 1 to 5.
- The optimal risk-reward ratio is selected using profit per bar.
- Entry and exits are discussed in the how-to trade section above.
- Confirmation must occur within three days of the pattern signal.
| Id | Pattern | Pattern Bars | Required Trend | Traditional Strategy | Market | Strategy | Setup | RR | Tickers | Signals | Trades | Trade Bars | Edge | Edge Per Bar | Confirm % | Win % | Cons Wins | Cons Losses | Avg. Trade Bars | Avg. Win Bars | Avg. Loss Bars | Details |
|---|---|---|---|---|---|---|---|---|---|---|---|---|---|---|---|---|---|---|---|---|---|---|
| 9,566 | bullish_doji_star | 2 | downtrend | bullish reversal | crypto | bullish reversal | low-high | 1 | 147 | 732 | 466 | 1,447 | -0.238 | -0.12 | 0.64 | 0.38 | 4 | 6 | 3.11 | 3.69 | 2.74 | https://analyzingalpha.com/bullish-doji-star-candlestick-pattern |
| 9,567 | bullish_doji_star | 2 | downtrend | bullish reversal | crypto | bullish reversal | low-high | 2 | 147 | 725 | 458 | 1,921 | -0.130 | -0.07 | 0.63 | 0.29 | 2 | 8 | 4.19 | 5.31 | 3.74 | https://analyzingalpha.com/bullish-doji-star-candlestick-pattern |
| 9,568 | bullish_doji_star | 2 | downtrend | bullish reversal | crypto | bullish reversal | low-high | 3 | 147 | 720 | 455 | 2,496 | -0.071 | -0.04 | 0.63 | 0.23 | 2 | 8 | 5.49 | 8.43 | 4.59 | https://analyzingalpha.com/bullish-doji-star-candlestick-pattern |
| 9,569 | bullish_doji_star | 2 | downtrend | bullish reversal | crypto | bullish reversal | low-high | 4 | 147 | 718 | 453 | 2,927 | -0.016 | -0.01 | 0.63 | 0.20 | 2 | 11 | 6.46 | 10.72 | 5.42 | https://analyzingalpha.com/bullish-doji-star-candlestick-pattern |
| 9,570 | bullish_doji_star | 2 | downtrend | bullish reversal | crypto | bullish reversal | low-high | 5 | 147 | 718 | 453 | 3,058 | 0.130 | 0.07 | 0.63 | 0.19 | 2 | 11 | 6.75 | 12.29 | 5.47 | https://analyzingalpha.com/bullish-doji-star-candlestick-pattern |
| 9,571 | bullish_doji_star | 2 | downtrend | bullish reversal | forex | bullish reversal | low-high | 1 | 694 | 5,919 | 3,527 | 13,553 | -0.302 | -0.15 | 0.60 | 0.35 | 5 | 15 | 3.84 | 4.67 | 3.40 | https://analyzingalpha.com/bullish-doji-star-candlestick-pattern |
| 9,572 | bullish_doji_star | 2 | downtrend | bullish reversal | forex | bullish reversal | low-high | 2 | 694 | 5,898 | 3,507 | 23,559 | -0.332 | -0.17 | 0.59 | 0.22 | 5 | 15 | 6.72 | 9.66 | 5.87 | https://analyzingalpha.com/bullish-doji-star-candlestick-pattern |
| 9,573 | bullish_doji_star | 2 | downtrend | bullish reversal | forex | bullish reversal | low-high | 3 | 694 | 5,880 | 3,493 | 31,500 | -0.366 | -0.18 | 0.59 | 0.16 | 3 | 29 | 9.02 | 17.34 | 7.45 | https://analyzingalpha.com/bullish-doji-star-candlestick-pattern |
| 9,574 | bullish_doji_star | 2 | downtrend | bullish reversal | forex | bullish reversal | low-high | 4 | 694 | 5,864 | 3,479 | 38,362 | -0.362 | -0.18 | 0.59 | 0.13 | 3 | 29 | 11.03 | 27.52 | 8.63 | https://analyzingalpha.com/bullish-doji-star-candlestick-pattern |
| 9,575 | bullish_doji_star | 2 | downtrend | bullish reversal | forex | bullish reversal | low-high | 5 | 694 | 5,844 | 3,464 | 45,093 | -0.355 | -0.18 | 0.59 | 0.11 | 3 | 29 | 13.02 | 37.58 | 10.07 | https://analyzingalpha.com/bullish-doji-star-candlestick-pattern |
| 9,576 | bullish_doji_star | 2 | downtrend | bullish reversal | stock | bullish reversal | low-high | 1 | 5,259 | 105,180 | 74,543 | 200,124 | -0.120 | -0.06 | 0.71 | 0.44 | 10 | 13 | 2.68 | 2.96 | 2.47 | https://analyzingalpha.com/bullish-doji-star-candlestick-pattern |
| 9,577 | bullish_doji_star | 2 | downtrend | bullish reversal | stock | bullish reversal | low-high | 2 | 5,259 | 104,371 | 73,863 | 319,129 | -0.008 | 0.00 | 0.71 | 0.33 | 8 | 19 | 4.32 | 5.83 | 3.57 | https://analyzingalpha.com/bullish-doji-star-candlestick-pattern |
| 9,578 | bullish_doji_star | 2 | downtrend | bullish reversal | stock | bullish reversal | low-high | 3 | 5,259 | 103,589 | 73,208 | 431,085 | 0.086 | 0.04 | 0.71 | 0.27 | 8 | 23 | 5.89 | 9.22 | 4.64 | https://analyzingalpha.com/bullish-doji-star-candlestick-pattern |
| 9,579 | bullish_doji_star | 2 | downtrend | bullish reversal | stock | bullish reversal | low-high | 4 | 5,259 | 102,933 | 72,715 | 539,421 | 0.188 | 0.09 | 0.71 | 0.24 | 8 | 36 | 7.42 | 13.26 | 5.61 | https://analyzingalpha.com/bullish-doji-star-candlestick-pattern |
| 9,580 | bullish_doji_star | 2 | downtrend | bullish reversal | stock | bullish reversal | low-high | 5 | 5,259 | 102,336 | 72,245 | 642,804 | 0.265 | 0.13 | 0.71 | 0.21 | 8 | 36 | 8.90 | 17.81 | 6.51 | https://analyzingalpha.com/bullish-doji-star-candlestick-pattern |
| 10,411 | bullish_doji_star | 2 | downtrend | bullish reversal | crypto | bearish mean reversion | atr-pattern_high | 1 | 147 | 734 | 176 | 782 | 0.043 | 0.02 | 0.24 | 0.52 | 5 | 3 | 4.44 | 2.67 | 6.38 | https://analyzingalpha.com/bullish-doji-star-candlestick-pattern |
| 10,412 | bullish_doji_star | 2 | downtrend | bullish reversal | crypto | bearish mean reversion | atr-pattern_high | 2 | 147 | 728 | 172 | 1,436 | -0.062 | -0.03 | 0.24 | 0.31 | 3 | 4 | 8.35 | 6.85 | 9.03 | https://analyzingalpha.com/bullish-doji-star-candlestick-pattern |
| 10,413 | bullish_doji_star | 2 | downtrend | bullish reversal | crypto | bearish mean reversion | atr-pattern_high | 3 | 147 | 719 | 168 | 2,146 | -0.092 | -0.05 | 0.23 | 0.23 | 2 | 4 | 12.77 | 12.45 | 12.87 | https://analyzingalpha.com/bullish-doji-star-candlestick-pattern |
| 10,414 | bullish_doji_star | 2 | downtrend | bullish reversal | crypto | bearish mean reversion | atr-pattern_high | 4 | 147 | 716 | 167 | 2,545 | -0.216 | -0.11 | 0.23 | 0.16 | 2 | 7 | 15.24 | 22.62 | 13.88 | https://analyzingalpha.com/bullish-doji-star-candlestick-pattern |
| 10,415 | bullish_doji_star | 2 | downtrend | bullish reversal | crypto | bearish mean reversion | atr-pattern_high | 5 | 147 | 711 | 166 | 2,823 | -0.390 | -0.20 | 0.23 | 0.10 | 2 | 7 | 17.01 | 31.06 | 15.40 | https://analyzingalpha.com/bullish-doji-star-candlestick-pattern |
| 10,416 | bullish_doji_star | 2 | downtrend | bullish reversal | forex | bearish mean reversion | atr-pattern_high | 1 | 694 | 5,935 | 1,355 | 5,544 | 0.222 | 0.11 | 0.23 | 0.61 | 15 | 4 | 4.09 | 3.90 | 4.39 | https://analyzingalpha.com/bullish-doji-star-candlestick-pattern |
| 10,417 | bullish_doji_star | 2 | downtrend | bullish reversal | forex | bearish mean reversion | atr-pattern_high | 2 | 694 | 5,885 | 1,336 | 14,190 | 0.178 | 0.09 | 0.23 | 0.39 | 10 | 5 | 10.62 | 11.51 | 10.04 | https://analyzingalpha.com/bullish-doji-star-candlestick-pattern |
| 10,418 | bullish_doji_star | 2 | downtrend | bullish reversal | forex | bearish mean reversion | atr-pattern_high | 3 | 694 | 5,841 | 1,315 | 22,795 | 0.185 | 0.09 | 0.23 | 0.30 | 6 | 7 | 17.33 | 27.06 | 13.26 | https://analyzingalpha.com/bullish-doji-star-candlestick-pattern |
| 10,419 | bullish_doji_star | 2 | downtrend | bullish reversal | forex | bearish mean reversion | atr-pattern_high | 4 | 694 | 5,809 | 1,305 | 31,198 | 0.180 | 0.09 | 0.22 | 0.24 | 4 | 8 | 23.91 | 43.23 | 17.96 | https://analyzingalpha.com/bullish-doji-star-candlestick-pattern |
| 10,420 | bullish_doji_star | 2 | downtrend | bullish reversal | forex | bearish mean reversion | atr-pattern_high | 5 | 694 | 5,773 | 1,288 | 34,224 | 0.090 | 0.05 | 0.22 | 0.18 | 4 | 9 | 26.57 | 46.68 | 22.11 | https://analyzingalpha.com/bullish-doji-star-candlestick-pattern |
| 10,421 | bullish_doji_star | 2 | downtrend | bullish reversal | stock | bearish mean reversion | atr-pattern_high | 1 | 5,259 | 104,613 | 26,576 | 90,048 | 0.137 | 0.07 | 0.25 | 0.57 | 15 | 8 | 3.39 | 3.23 | 3.60 | https://analyzingalpha.com/bullish-doji-star-candlestick-pattern |
| 10,422 | bullish_doji_star | 2 | downtrend | bullish reversal | stock | bearish mean reversion | atr-pattern_high | 2 | 5,259 | 103,641 | 26,265 | 176,139 | 0.136 | 0.07 | 0.25 | 0.38 | 11 | 13 | 6.71 | 7.92 | 5.97 | https://analyzingalpha.com/bullish-doji-star-candlestick-pattern |
| 10,423 | bullish_doji_star | 2 | downtrend | bullish reversal | stock | bearish mean reversion | atr-pattern_high | 3 | 5,259 | 102,689 | 25,957 | 256,080 | 0.111 | 0.06 | 0.25 | 0.28 | 11 | 20 | 9.87 | 13.78 | 8.36 | https://analyzingalpha.com/bullish-doji-star-candlestick-pattern |
| 10,424 | bullish_doji_star | 2 | downtrend | bullish reversal | stock | bearish mean reversion | atr-pattern_high | 4 | 5,259 | 101,872 | 25,690 | 338,606 | 0.088 | 0.04 | 0.25 | 0.22 | 10 | 20 | 13.18 | 21.65 | 10.84 | https://analyzingalpha.com/bullish-doji-star-candlestick-pattern |
| 10,425 | bullish_doji_star | 2 | downtrend | bullish reversal | stock | bearish mean reversion | atr-pattern_high | 5 | 5,259 | 101,064 | 25,444 | 418,743 | 0.065 | 0.03 | 0.25 | 0.18 | 8 | 20 | 16.46 | 32.16 | 13.08 | https://analyzingalpha.com/bullish-doji-star-candlestick-pattern |
| 10,826 | bullish_doji_star | 2 | downtrend | bullish reversal | crypto | bearish continuation | high-close | 1 | 147 | 747 | 710 | 1,882 | -0.156 | -0.08 | 0.95 | 0.42 | 13 | 7 | 2.65 | 1.96 | 3.16 | https://analyzingalpha.com/bullish-doji-star-candlestick-pattern |
| 10,827 | bullish_doji_star | 2 | downtrend | bullish reversal | crypto | bearish continuation | high-close | 2 | 147 | 742 | 703 | 2,590 | -0.032 | -0.02 | 0.95 | 0.32 | 11 | 8 | 3.68 | 3.59 | 3.73 | https://analyzingalpha.com/bullish-doji-star-candlestick-pattern |
| 10,828 | bullish_doji_star | 2 | downtrend | bullish reversal | crypto | bearish continuation | high-close | 3 | 147 | 732 | 691 | 3,073 | -0.040 | -0.02 | 0.94 | 0.24 | 9 | 12 | 4.45 | 3.99 | 4.59 | https://analyzingalpha.com/bullish-doji-star-candlestick-pattern |
| 10,829 | bullish_doji_star | 2 | downtrend | bullish reversal | crypto | bearish continuation | high-close | 4 | 147 | 728 | 687 | 3,586 | 0.016 | 0.01 | 0.94 | 0.20 | 8 | 15 | 5.22 | 6.52 | 4.89 | https://analyzingalpha.com/bullish-doji-star-candlestick-pattern |
| 10,830 | bullish_doji_star | 2 | downtrend | bullish reversal | crypto | bearish continuation | high-close | 5 | 147 | 721 | 678 | 3,943 | 0.040 | 0.02 | 0.94 | 0.17 | 7 | 15 | 5.82 | 7.08 | 5.55 | https://analyzingalpha.com/bullish-doji-star-candlestick-pattern |
| 10,831 | bullish_doji_star | 2 | downtrend | bullish reversal | forex | bearish continuation | high-close | 1 | 694 | 5,979 | 5,855 | 11,564 | -0.180 | -0.09 | 0.98 | 0.41 | 15 | 11 | 1.98 | 1.92 | 2.01 | https://analyzingalpha.com/bullish-doji-star-candlestick-pattern |
| 10,832 | bullish_doji_star | 2 | downtrend | bullish reversal | forex | bearish continuation | high-close | 2 | 694 | 5,941 | 5,817 | 16,959 | -0.096 | -0.05 | 0.98 | 0.30 | 14 | 16 | 2.92 | 3.47 | 2.67 | https://analyzingalpha.com/bullish-doji-star-candlestick-pattern |
| 10,833 | bullish_doji_star | 2 | downtrend | bullish reversal | forex | bearish continuation | high-close | 3 | 694 | 5,903 | 5,779 | 22,966 | -0.055 | -0.03 | 0.98 | 0.24 | 12 | 20 | 3.97 | 6.01 | 3.35 | https://analyzingalpha.com/bullish-doji-star-candlestick-pattern |
| 10,834 | bullish_doji_star | 2 | downtrend | bullish reversal | forex | bearish continuation | high-close | 4 | 694 | 5,874 | 5,750 | 28,546 | -0.050 | -0.03 | 0.98 | 0.19 | 10 | 20 | 4.96 | 8.42 | 4.16 | https://analyzingalpha.com/bullish-doji-star-candlestick-pattern |
| 10,835 | bullish_doji_star | 2 | downtrend | bullish reversal | forex | bearish continuation | high-close | 5 | 694 | 5,852 | 5,727 | 33,008 | -0.030 | -0.02 | 0.98 | 0.16 | 9 | 20 | 5.76 | 10.74 | 4.80 | https://analyzingalpha.com/bullish-doji-star-candlestick-pattern |
| 10,836 | bullish_doji_star | 2 | downtrend | bullish reversal | stock | bearish continuation | high-close | 1 | 5,259 | 106,607 | 92,293 | 153,853 | -0.196 | -0.10 | 0.87 | 0.40 | 31 | 23 | 1.67 | 1.77 | 1.60 | https://analyzingalpha.com/bullish-doji-star-candlestick-pattern |
| 10,837 | bullish_doji_star | 2 | downtrend | bullish reversal | stock | bearish continuation | high-close | 2 | 5,259 | 105,987 | 91,716 | 214,981 | -0.050 | -0.03 | 0.87 | 0.32 | 30 | 24 | 2.34 | 2.82 | 2.12 | https://analyzingalpha.com/bullish-doji-star-candlestick-pattern |
| 10,838 | bullish_doji_star | 2 | downtrend | bullish reversal | stock | bearish continuation | high-close | 3 | 5,259 | 105,218 | 90,999 | 277,836 | 0.031 | 0.02 | 0.86 | 0.26 | 30 | 33 | 3.05 | 4.15 | 2.67 | https://analyzingalpha.com/bullish-doji-star-candlestick-pattern |
| 10,839 | bullish_doji_star | 2 | downtrend | bullish reversal | stock | bearish continuation | high-close | 4 | 5,259 | 104,458 | 90,290 | 338,999 | 0.092 | 0.05 | 0.86 | 0.22 | 27 | 45 | 3.75 | 5.57 | 3.25 | https://analyzingalpha.com/bullish-doji-star-candlestick-pattern |
| 10,840 | bullish_doji_star | 2 | downtrend | bullish reversal | stock | bearish continuation | high-close | 5 | 5,259 | 103,774 | 89,650 | 396,129 | 0.140 | 0.07 | 0.86 | 0.19 | 27 | 45 | 4.42 | 7.20 | 3.77 | https://analyzingalpha.com/bullish-doji-star-candlestick-pattern |
| 11,956 | bullish_doji_star | 2 | downtrend | bullish reversal | crypto | bullish mean reversion | atr-pattern_low | 1 | 147 | 712 | 375 | 2,100 | 0.241 | 0.12 | 0.53 | 0.62 | 4 | 3 | 5.60 | 6.13 | 4.73 | https://analyzingalpha.com/bullish-doji-star-candlestick-pattern |
| 11,957 | bullish_doji_star | 2 | downtrend | bullish reversal | crypto | bullish mean reversion | atr-pattern_low | 2 | 147 | 699 | 363 | 3,967 | 0.262 | 0.13 | 0.52 | 0.42 | 2 | 5 | 10.93 | 12.55 | 9.75 | https://analyzingalpha.com/bullish-doji-star-candlestick-pattern |
| 11,958 | bullish_doji_star | 2 | downtrend | bullish reversal | crypto | bullish mean reversion | atr-pattern_low | 3 | 147 | 684 | 350 | 5,662 | 0.449 | 0.22 | 0.51 | 0.36 | 3 | 5 | 16.18 | 24.17 | 11.62 | https://analyzingalpha.com/bullish-doji-star-candlestick-pattern |
| 11,959 | bullish_doji_star | 2 | downtrend | bullish reversal | crypto | bullish mean reversion | atr-pattern_low | 4 | 147 | 681 | 348 | 6,431 | 0.562 | 0.28 | 0.51 | 0.31 | 3 | 6 | 18.48 | 30.14 | 13.16 | https://analyzingalpha.com/bullish-doji-star-candlestick-pattern |
| 11,960 | bullish_doji_star | 2 | downtrend | bullish reversal | crypto | bullish mean reversion | atr-pattern_low | 5 | 147 | 678 | 345 | 7,161 | 0.630 | 0.32 | 0.51 | 0.27 | 2 | 7 | 20.76 | 38.24 | 14.21 | https://analyzingalpha.com/bullish-doji-star-candlestick-pattern |
| 11,961 | bullish_doji_star | 2 | downtrend | bullish reversal | forex | bullish mean reversion | atr-pattern_low | 1 | 694 | 5,890 | 3,129 | 14,589 | 0.235 | 0.12 | 0.53 | 0.62 | 22 | 9 | 4.66 | 4.59 | 4.77 | https://analyzingalpha.com/bullish-doji-star-candlestick-pattern |
| 11,962 | bullish_doji_star | 2 | downtrend | bullish reversal | forex | bullish mean reversion | atr-pattern_low | 2 | 694 | 5,792 | 3,057 | 35,912 | 0.168 | 0.08 | 0.53 | 0.39 | 5 | 11 | 11.75 | 15.83 | 9.16 | https://analyzingalpha.com/bullish-doji-star-candlestick-pattern |
| 11,963 | bullish_doji_star | 2 | downtrend | bullish reversal | forex | bullish mean reversion | atr-pattern_low | 3 | 694 | 5,717 | 3,018 | 54,814 | 0.132 | 0.07 | 0.53 | 0.28 | 4 | 12 | 18.16 | 32.09 | 12.64 | https://analyzingalpha.com/bullish-doji-star-candlestick-pattern |
| 11,964 | bullish_doji_star | 2 | downtrend | bullish reversal | forex | bullish mean reversion | atr-pattern_low | 4 | 694 | 5,649 | 2,969 | 74,320 | 0.096 | 0.05 | 0.53 | 0.22 | 3 | 14 | 25.03 | 55.72 | 16.43 | https://analyzingalpha.com/bullish-doji-star-candlestick-pattern |
| 11,965 | bullish_doji_star | 2 | downtrend | bullish reversal | forex | bullish mean reversion | atr-pattern_low | 5 | 694 | 5,611 | 2,939 | 87,045 | 0.085 | 0.04 | 0.52 | 0.18 | 3 | 14 | 29.62 | 74.45 | 19.71 | https://analyzingalpha.com/bullish-doji-star-candlestick-pattern |
| 11,966 | bullish_doji_star | 2 | downtrend | bullish reversal | stock | bullish mean reversion | atr-pattern_low | 1 | 5,259 | 103,704 | 56,109 | 223,818 | 0.159 | 0.08 | 0.54 | 0.58 | 17 | 11 | 3.99 | 3.75 | 4.32 | https://analyzingalpha.com/bullish-doji-star-candlestick-pattern |
| 11,967 | bullish_doji_star | 2 | downtrend | bullish reversal | stock | bullish mean reversion | atr-pattern_low | 2 | 5,259 | 102,020 | 54,961 | 413,122 | 0.222 | 0.11 | 0.54 | 0.41 | 11 | 15 | 7.52 | 8.78 | 6.65 | https://analyzingalpha.com/bullish-doji-star-candlestick-pattern |
| 11,968 | bullish_doji_star | 2 | downtrend | bullish reversal | stock | bullish mean reversion | atr-pattern_low | 3 | 5,259 | 100,576 | 54,013 | 591,964 | 0.271 | 0.14 | 0.54 | 0.32 | 8 | 22 | 10.96 | 15.58 | 8.81 | https://analyzingalpha.com/bullish-doji-star-candlestick-pattern |
| 11,969 | bullish_doji_star | 2 | downtrend | bullish reversal | stock | bullish mean reversion | atr-pattern_low | 4 | 5,259 | 99,465 | 53,276 | 754,623 | 0.320 | 0.16 | 0.54 | 0.27 | 8 | 22 | 14.16 | 23.71 | 10.72 | https://analyzingalpha.com/bullish-doji-star-candlestick-pattern |
| 11,970 | bullish_doji_star | 2 | downtrend | bullish reversal | stock | bullish mean reversion | atr-pattern_low | 5 | 5,259 | 98,533 | 52,696 | 920,219 | 0.375 | 0.19 | 0.53 | 0.23 | 6 | 29 | 17.46 | 32.98 | 12.86 | https://analyzingalpha.com/bullish-doji-star-candlestick-pattern |
| 12,241 | bullish_doji_star | 2 | downtrend | bullish reversal | crypto | bearish continuation | high-low | 1 | 147 | 740 | 498 | 1,651 | -0.198 | -0.10 | 0.67 | 0.40 | 9 | 10 | 3.32 | 3.43 | 3.24 | https://analyzingalpha.com/bullish-doji-star-candlestick-pattern |
| 12,242 | bullish_doji_star | 2 | downtrend | bullish reversal | crypto | bearish continuation | high-low | 2 | 147 | 727 | 484 | 2,671 | -0.224 | -0.11 | 0.67 | 0.26 | 6 | 10 | 5.52 | 7.46 | 4.84 | https://analyzingalpha.com/bullish-doji-star-candlestick-pattern |
| 12,243 | bullish_doji_star | 2 | downtrend | bullish reversal | crypto | bearish continuation | high-low | 3 | 147 | 720 | 478 | 3,504 | -0.234 | -0.12 | 0.66 | 0.19 | 4 | 13 | 7.33 | 8.99 | 6.94 | https://analyzingalpha.com/bullish-doji-star-candlestick-pattern |
| 12,244 | bullish_doji_star | 2 | downtrend | bullish reversal | crypto | bearish continuation | high-low | 4 | 147 | 708 | 471 | 5,196 | -0.246 | -0.12 | 0.67 | 0.15 | 4 | 13 | 11.03 | 17.51 | 9.88 | https://analyzingalpha.com/bullish-doji-star-candlestick-pattern |
| 12,245 | bullish_doji_star | 2 | downtrend | bullish reversal | crypto | bearish continuation | high-low | 5 | 147 | 697 | 462 | 6,368 | -0.240 | -0.12 | 0.66 | 0.13 | 2 | 13 | 13.78 | 35.10 | 10.72 | https://analyzingalpha.com/bullish-doji-star-candlestick-pattern |
| 12,246 | bullish_doji_star | 2 | downtrend | bullish reversal | forex | bearish continuation | high-low | 1 | 694 | 5,941 | 3,820 | 13,780 | -0.264 | -0.13 | 0.64 | 0.37 | 10 | 17 | 3.61 | 4.30 | 3.21 | https://analyzingalpha.com/bullish-doji-star-candlestick-pattern |
| 12,247 | bullish_doji_star | 2 | downtrend | bullish reversal | forex | bearish continuation | high-low | 2 | 694 | 5,871 | 3,771 | 22,260 | -0.274 | -0.14 | 0.64 | 0.24 | 9 | 17 | 5.90 | 9.29 | 4.81 | https://analyzingalpha.com/bullish-doji-star-candlestick-pattern |
| 12,248 | bullish_doji_star | 2 | downtrend | bullish reversal | forex | bearish continuation | high-low | 3 | 694 | 5,838 | 3,755 | 31,543 | -0.274 | -0.14 | 0.64 | 0.18 | 8 | 20 | 8.40 | 16.25 | 6.66 | https://analyzingalpha.com/bullish-doji-star-candlestick-pattern |
| 12,249 | bullish_doji_star | 2 | downtrend | bullish reversal | forex | bearish continuation | high-low | 4 | 694 | 5,805 | 3,736 | 38,307 | -0.262 | -0.13 | 0.64 | 0.15 | 8 | 20 | 10.25 | 25.70 | 7.59 | https://analyzingalpha.com/bullish-doji-star-candlestick-pattern |
| 12,250 | bullish_doji_star | 2 | downtrend | bullish reversal | forex | bearish continuation | high-low | 5 | 694 | 5,770 | 3,710 | 45,677 | -0.265 | -0.13 | 0.64 | 0.12 | 7 | 20 | 12.31 | 36.63 | 8.90 | https://analyzingalpha.com/bullish-doji-star-candlestick-pattern |
| 12,251 | bullish_doji_star | 2 | downtrend | bullish reversal | stock | bearish continuation | high-low | 1 | 5,259 | 105,778 | 70,565 | 177,641 | -0.163 | -0.08 | 0.67 | 0.42 | 30 | 16 | 2.52 | 2.73 | 2.37 | https://analyzingalpha.com/bullish-doji-star-candlestick-pattern |
| 12,252 | bullish_doji_star | 2 | downtrend | bullish reversal | stock | bearish continuation | high-low | 2 | 5,259 | 104,495 | 69,624 | 278,095 | -0.126 | -0.06 | 0.67 | 0.29 | 27 | 32 | 3.99 | 5.21 | 3.49 | https://analyzingalpha.com/bullish-doji-star-candlestick-pattern |
| 12,253 | bullish_doji_star | 2 | downtrend | bullish reversal | stock | bearish continuation | high-low | 3 | 5,259 | 103,219 | 68,708 | 372,465 | -0.089 | -0.04 | 0.67 | 0.23 | 26 | 32 | 5.42 | 8.43 | 4.54 | https://analyzingalpha.com/bullish-doji-star-candlestick-pattern |
| 12,254 | bullish_doji_star | 2 | downtrend | bullish reversal | stock | bearish continuation | high-low | 4 | 5,259 | 102,090 | 67,903 | 473,069 | -0.062 | -0.03 | 0.67 | 0.19 | 26 | 32 | 6.97 | 12.29 | 5.75 | https://analyzingalpha.com/bullish-doji-star-candlestick-pattern |
| 12,255 | bullish_doji_star | 2 | downtrend | bullish reversal | stock | bearish continuation | high-low | 5 | 5,259 | 101,097 | 67,181 | 555,538 | -0.045 | -0.02 | 0.66 | 0.16 | 25 | 32 | 8.27 | 16.05 | 6.80 | https://analyzingalpha.com/bullish-doji-star-candlestick-pattern |
| 13,261 | bullish_doji_star | 2 | downtrend | bullish reversal | crypto | bullish reversal | low-close | 1 | 147 | 744 | 728 | 1,693 | -0.224 | -0.11 | 0.98 | 0.39 | 4 | 9 | 2.33 | 3.80 | 1.40 | https://analyzingalpha.com/bullish-doji-star-candlestick-pattern |
| 13,262 | bullish_doji_star | 2 | downtrend | bullish reversal | crypto | bullish reversal | low-close | 2 | 147 | 741 | 724 | 2,170 | -0.104 | -0.05 | 0.98 | 0.30 | 3 | 9 | 3.00 | 5.17 | 2.07 | https://analyzingalpha.com/bullish-doji-star-candlestick-pattern |
| 13,263 | bullish_doji_star | 2 | downtrend | bullish reversal | crypto | bullish reversal | low-close | 3 | 147 | 739 | 722 | 2,508 | 0.046 | 0.02 | 0.98 | 0.26 | 3 | 9 | 3.47 | 6.34 | 2.46 | https://analyzingalpha.com/bullish-doji-star-candlestick-pattern |
| 13,264 | bullish_doji_star | 2 | downtrend | bullish reversal | crypto | bullish reversal | low-close | 4 | 147 | 735 | 718 | 2,877 | 0.180 | 0.09 | 0.98 | 0.24 | 3 | 18 | 4.01 | 8.03 | 2.77 | https://analyzingalpha.com/bullish-doji-star-candlestick-pattern |
| 13,265 | bullish_doji_star | 2 | downtrend | bullish reversal | crypto | bullish reversal | low-close | 5 | 147 | 735 | 718 | 3,110 | 0.280 | 0.14 | 0.98 | 0.21 | 3 | 18 | 4.33 | 9.31 | 2.97 | https://analyzingalpha.com/bullish-doji-star-candlestick-pattern |
| 13,266 | bullish_doji_star | 2 | downtrend | bullish reversal | forex | bullish reversal | low-close | 1 | 694 | 5,985 | 5,887 | 11,284 | -0.256 | -0.13 | 0.98 | 0.37 | 8 | 18 | 1.92 | 1.98 | 1.88 | https://analyzingalpha.com/bullish-doji-star-candlestick-pattern |
| 13,267 | bullish_doji_star | 2 | downtrend | bullish reversal | forex | bullish reversal | low-close | 2 | 694 | 5,971 | 5,873 | 16,763 | -0.160 | -0.08 | 0.98 | 0.28 | 5 | 18 | 2.85 | 3.36 | 2.66 | https://analyzingalpha.com/bullish-doji-star-candlestick-pattern |
| 13,268 | bullish_doji_star | 2 | downtrend | bullish reversal | forex | bullish reversal | low-close | 3 | 694 | 5,962 | 5,863 | 21,283 | -0.123 | -0.06 | 0.98 | 0.22 | 4 | 18 | 3.63 | 5.33 | 3.15 | https://analyzingalpha.com/bullish-doji-star-candlestick-pattern |
| 13,269 | bullish_doji_star | 2 | downtrend | bullish reversal | forex | bullish reversal | low-close | 4 | 694 | 5,949 | 5,849 | 27,178 | -0.100 | -0.05 | 0.98 | 0.18 | 4 | 18 | 4.65 | 7.97 | 3.92 | https://analyzingalpha.com/bullish-doji-star-candlestick-pattern |
| 13,270 | bullish_doji_star | 2 | downtrend | bullish reversal | forex | bullish reversal | low-close | 5 | 694 | 5,935 | 5,835 | 32,018 | -0.085 | -0.04 | 0.98 | 0.15 | 4 | 20 | 5.49 | 11.56 | 4.39 | https://analyzingalpha.com/bullish-doji-star-candlestick-pattern |
| 13,271 | bullish_doji_star | 2 | downtrend | bullish reversal | stock | bullish reversal | low-close | 1 | 5,259 | 106,327 | 97,169 | 160,844 | -0.123 | -0.06 | 0.91 | 0.44 | 10 | 18 | 1.66 | 1.79 | 1.55 | https://analyzingalpha.com/bullish-doji-star-candlestick-pattern |
| 13,272 | bullish_doji_star | 2 | downtrend | bullish reversal | stock | bullish reversal | low-close | 2 | 5,259 | 105,946 | 96,776 | 225,270 | 0.088 | 0.04 | 0.91 | 0.36 | 8 | 21 | 2.33 | 2.85 | 2.03 | https://analyzingalpha.com/bullish-doji-star-candlestick-pattern |
| 13,273 | bullish_doji_star | 2 | downtrend | bullish reversal | stock | bullish reversal | low-close | 3 | 5,259 | 105,522 | 96,310 | 286,894 | 0.252 | 0.13 | 0.91 | 0.31 | 8 | 23 | 2.98 | 3.98 | 2.52 | https://analyzingalpha.com/bullish-doji-star-candlestick-pattern |
| 13,274 | bullish_doji_star | 2 | downtrend | bullish reversal | stock | bullish reversal | low-close | 4 | 5,259 | 105,141 | 95,906 | 348,045 | 0.396 | 0.20 | 0.91 | 0.28 | 8 | 27 | 3.63 | 5.32 | 2.97 | https://analyzingalpha.com/bullish-doji-star-candlestick-pattern |
| 13,275 | bullish_doji_star | 2 | downtrend | bullish reversal | stock | bullish reversal | low-close | 5 | 5,259 | 104,735 | 95,509 | 409,068 | 0.515 | 0.26 | 0.91 | 0.25 | 8 | 34 | 4.28 | 6.89 | 3.40 | https://analyzingalpha.com/bullish-doji-star-candlestick-pattern |
| Market | Strategy | Setup | Trades | Edge |
Pattern:
Pattern Bars:
Required Trend:
Traditional Strategy:
Market:
Strategy:
Setup:
RR:
Tickers:
Signals:
Trades:
Trade Bars:
Edge:
Edge Per Bar:
Confirm %:
Win %:
Cons Wins:
Cons Losses:
Avg. Trade Bars:
Avg. Win Bars:
Avg. Loss Bars:
Similar Candlestick Patterns
Multiple candlestick patterns are similar to the bullish doji star.
Bearish Doji Star vs. Bullish Doji Star

The bearish doji candlestick pattern is the exact opposite of the bullish doji star. The bearish doji is a two-bar bearish reversal pattern, whereas the bullish doji star is a two-bar bull reversal candlestick pattern.
The bullish doji star has a long red candle and then a doji that gaps down; the bearish doji star has a green candle followed by a doji star.
Both anticipate a trend reversal, but the bearish doji star occurs in an uptrend while the bullish doji star appears in a downtrend.
Morning Doji Star vs. Bullish Doji Star
The morning doji star candlestick pattern is a three-bar candlestick pattern than contains the two candles of the bullish doji star. The only difference is that the morning doji star has a third candle that closes at or above the midpoint of the first red candlestick.
The Bottom Line
The bullish doji star occurs in all markets and supposedly portends a bearish reversal; however, history gives us another story. And while it does work as a bullish reversal in the stock market, it’s hard to tell if this is due to the stock market’s upward tendencies or an edge with the trading pattern – I’m leaning towards the former.
Want to master candlestick trading? Review my backtest results to forget the names and intuitively understand price action candlestick patterns.