The piercing candlestick pattern is a rare two-bar bullish reversal Japanese candlestick pattern that is best traded using a bullish mean reversion strategy in the stock market, according to the extensive backtest data.
You might be surprised you’re leaving money on the table if you practice traditional Japanese candlestick technical analysis.
Keep reading if you want to take that profit back by using history’s best piercing pattern trading strategies.
What Is a Piercing Candlestick Pattern?

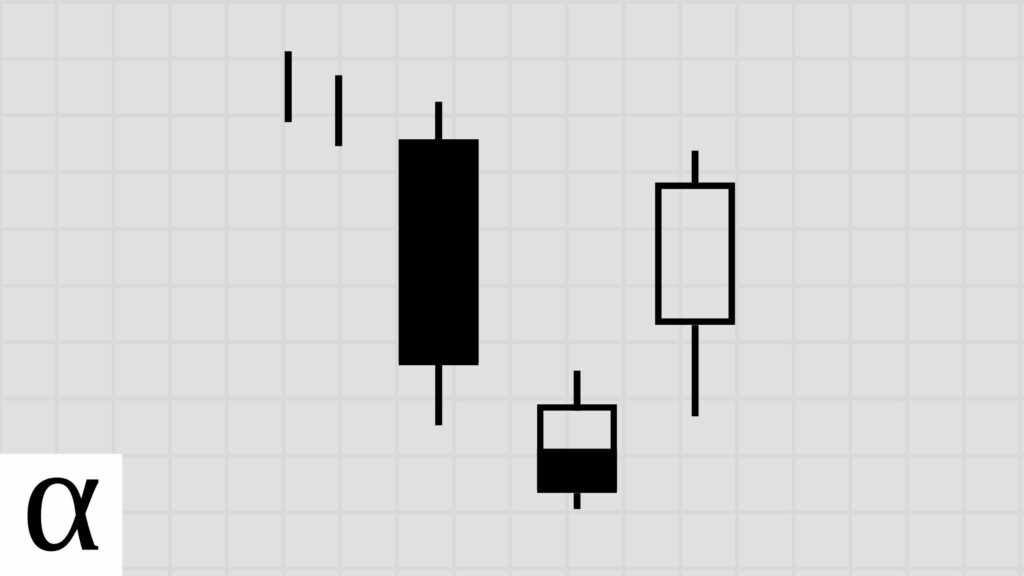
The piercing candlestick pattern is a two-bar bullish reversal pattern.
The piercing name comes from the second candle piercing into the first.
The data tells us the pattern does produce profits in the stock market trading traditionally, but there’s a better way. Before we learn the best piercing trading strategy, let’s learn how to identify this two-bar pattern.
How to Identify the Piercing Candlestick Pattern

The following are the requirements for a valid piercing candlestick pattern:
- The first candle is long and bearish.
- The second candle is bullish, opens below the previous candle’s low, and closes between the previous day’s open and midpoint.
- The piercing pattern must occur during a downtrend.
The piercing pattern appeared on Amazon’s (AMZN) daily chart on February 19th, 2016.
The price is in a clear downtrend, significantly below the fifty-day simple moving average. We see a large red bearish candle followed by a green candle that opens below the prior day’s low and closes between the midpoint and yesterday’s open, fulfilling the piercing pattern requirements.
Now that we’ve hammered this pattern’s requirements into our minds, what’s the best piercing trading strategy?
How to Trade Piercing Candlestick Patterns
The piercing candlestick pattern should be traded using a bullish mean reversion strategy in the stock market, according to a 21-year backtest.
Forex and crypto traders shouldn’t trade this pattern due to a lack of data and statistical significance when determining the best piercing pattern trading strategies.
Let’s learn how traders typically leak profits when trading this piercing pattern, and then we’ll learn how data-driven stock traders nail it.
Piercing Bullish Reversal Trade Setup

Let’s practice identifying the piercing pattern.
We see price is in a short-term bear market as it’s extended from the fifty-day simple moving average. There’s a sizeable bearish candle followed by a large bullish candlestick that opens below the prior day’s low and closes above the previous candle’s midpoint without exceeding the open.
With the piercing pattern identified, traditional traders go long at a break of the second candle’s high, placing their stop loss just below the same candle’s low.
These traditional stock traders leave money on the table using a suboptimal trading strategy.
Piercing Bullish Mean Reversion Trade Setup

Data-driven, professional stock traders wait for the price to go below the pattern low and enter long when the price moves above the same low, setting a stop loss of one ATR.
Let’s use MercadoLibre’s (MELI) daily chart on October 8th, 2008, to clarify this.
The pattern low occurs on the second day at $16.50. Two days later, the price crosses below and back above this price, causing an entry. This data-driven mean reversion stock trader exited in the next day or two with significant profits.
Speaking of profits, what can history tell us about the best piercing trading strategy?
Does the Piercing Candlestick Pattern Work? (Backtest Results)
Using the following rules, I backtested the piercing candlestick pattern on the daily timeframe in the crypto, forex, and stock markets.
- A close above the 50-day SMA constitutes an uptrend.
- I tested risk-reward ranges from 1 to 5.
- The optimal risk-reward ratio is selected using profit per bar.
- Entry and exits are discussed in the how-to trade section above.
- Confirmation must occur within three days of the pattern signal.
| Id | Pattern | Pattern Bars | Required Trend | Traditional Strategy | Market | Strategy | Setup | RR | Tickers | Signals | Trades | Trade Bars | Edge | Edge Per Bar | Confirm % | Win % | Cons Wins | Cons Losses | Avg. Trade Bars | Avg. Win Bars | Avg. Loss Bars | Details |
|---|---|---|---|---|---|---|---|---|---|---|---|---|---|---|---|---|---|---|---|---|---|---|
| 7,351 | piercing | 2 | downtrend | bullish reversal | forex | bearish continuation | high-low | 1 | 22 | 54 | 20 | 99 | 0.000 | 0.00 | 0.37 | 0.50 | 2 | 2 | 4.95 | 7.80 | 2.10 | https://analyzingalpha.com/piercing-candlestick-pattern |
| 7,352 | piercing | 2 | downtrend | bullish reversal | forex | bearish continuation | high-low | 2 | 22 | 54 | 20 | 191 | 0.200 | 0.10 | 0.37 | 0.40 | 1 | 2 | 9.55 | 16.00 | 5.25 | https://analyzingalpha.com/piercing-candlestick-pattern |
| 7,353 | piercing | 2 | downtrend | bullish reversal | forex | bearish continuation | high-low | 3 | 22 | 54 | 20 | 283 | 0.000 | 0.00 | 0.37 | 0.25 | 1 | 2 | 14.15 | 19.80 | 12.27 | https://analyzingalpha.com/piercing-candlestick-pattern |
| 7,354 | piercing | 2 | downtrend | bullish reversal | forex | bearish continuation | high-low | 4 | 22 | 54 | 20 | 352 | -0.500 | -0.25 | 0.37 | 0.10 | 1 | 2 | 17.60 | 36.00 | 15.56 | https://analyzingalpha.com/piercing-candlestick-pattern |
| 7,355 | piercing | 2 | downtrend | bullish reversal | forex | bearish continuation | high-low | 5 | 22 | 54 | 20 | 386 | -0.700 | -0.35 | 0.37 | 0.05 | 1 | 2 | 19.30 | 94.00 | 15.37 | https://analyzingalpha.com/piercing-candlestick-pattern |
| 7,356 | piercing | 2 | downtrend | bullish reversal | stock | bearish continuation | high-low | 1 | 3,541 | 21,436 | 7,768 | 32,054 | -0.261 | -0.13 | 0.36 | 0.37 | 6 | 7 | 4.13 | 4.69 | 3.80 | https://analyzingalpha.com/piercing-candlestick-pattern |
| 7,357 | piercing | 2 | downtrend | bullish reversal | stock | bearish continuation | high-low | 2 | 3,541 | 21,349 | 7,728 | 52,876 | -0.288 | -0.14 | 0.36 | 0.24 | 5 | 10 | 6.84 | 10.42 | 5.74 | https://analyzingalpha.com/piercing-candlestick-pattern |
| 7,358 | piercing | 2 | downtrend | bullish reversal | stock | bearish continuation | high-low | 3 | 3,541 | 21,274 | 7,689 | 75,571 | -0.320 | -0.16 | 0.36 | 0.17 | 5 | 10 | 9.83 | 17.98 | 8.16 | https://analyzingalpha.com/piercing-candlestick-pattern |
| 7,359 | piercing | 2 | downtrend | bullish reversal | stock | bearish continuation | high-low | 4 | 3,541 | 21,226 | 7,659 | 93,304 | -0.342 | -0.17 | 0.36 | 0.13 | 4 | 10 | 12.18 | 28.10 | 9.76 | https://analyzingalpha.com/piercing-candlestick-pattern |
| 7,360 | piercing | 2 | downtrend | bullish reversal | stock | bearish continuation | high-low | 5 | 3,541 | 21,173 | 7,628 | 113,066 | -0.380 | -0.19 | 0.36 | 0.10 | 4 | 10 | 14.82 | 42.72 | 11.58 | https://analyzingalpha.com/piercing-candlestick-pattern |
| 7,536 | piercing | 2 | downtrend | bullish reversal | forex | bullish reversal | low-close | 1 | 22 | 53 | 52 | 476 | -0.382 | -0.19 | 0.98 | 0.31 | 2 | 2 | 9.15 | 9.50 | 9.00 | https://analyzingalpha.com/piercing-candlestick-pattern |
| 7,537 | piercing | 2 | downtrend | bullish reversal | forex | bullish reversal | low-close | 2 | 22 | 53 | 52 | 1,074 | -0.484 | -0.24 | 0.98 | 0.17 | 2 | 3 | 20.65 | 51.67 | 14.16 | https://analyzingalpha.com/piercing-candlestick-pattern |
| 7,538 | piercing | 2 | downtrend | bullish reversal | forex | bullish reversal | low-close | 3 | 22 | 53 | 52 | 1,580 | -0.535 | -0.27 | 0.98 | 0.12 | 1 | 5 | 30.38 | 159.17 | 13.59 | https://analyzingalpha.com/piercing-candlestick-pattern |
| 7,539 | piercing | 2 | downtrend | bullish reversal | forex | bullish reversal | low-close | 4 | 22 | 53 | 52 | 1,775 | -0.708 | -0.35 | 0.98 | 0.06 | 1 | 5 | 34.13 | 270.33 | 19.67 | https://analyzingalpha.com/piercing-candlestick-pattern |
| 7,540 | piercing | 2 | downtrend | bullish reversal | forex | bullish reversal | low-close | 5 | 22 | 53 | 52 | 1,803 | -0.650 | -0.33 | 0.98 | 0.06 | 1 | 5 | 34.67 | 279.67 | 19.67 | https://analyzingalpha.com/piercing-candlestick-pattern |
| 7,541 | piercing | 2 | downtrend | bullish reversal | stock | bullish reversal | low-close | 1 | 3,541 | 21,401 | 19,311 | 95,671 | 0.058 | 0.03 | 0.90 | 0.53 | 9 | 7 | 4.95 | 4.83 | 5.09 | https://analyzingalpha.com/piercing-candlestick-pattern |
| 7,542 | piercing | 2 | downtrend | bullish reversal | stock | bullish reversal | low-close | 2 | 3,541 | 21,265 | 19,147 | 174,415 | 0.114 | 0.06 | 0.90 | 0.37 | 8 | 11 | 9.11 | 11.24 | 7.84 | https://analyzingalpha.com/piercing-candlestick-pattern |
| 7,543 | piercing | 2 | downtrend | bullish reversal | stock | bullish reversal | low-close | 3 | 3,541 | 21,143 | 19,017 | 258,119 | 0.185 | 0.09 | 0.90 | 0.30 | 6 | 14 | 13.57 | 21.32 | 10.33 | https://analyzingalpha.com/piercing-candlestick-pattern |
| 7,544 | piercing | 2 | downtrend | bullish reversal | stock | bullish reversal | low-close | 4 | 3,541 | 21,045 | 18,911 | 334,573 | 0.242 | 0.12 | 0.90 | 0.25 | 5 | 14 | 17.69 | 32.58 | 12.78 | https://analyzingalpha.com/piercing-candlestick-pattern |
| 7,545 | piercing | 2 | downtrend | bullish reversal | stock | bullish reversal | low-close | 5 | 3,541 | 20,972 | 18,822 | 406,539 | 0.300 | 0.15 | 0.90 | 0.22 | 4 | 14 | 21.60 | 45.68 | 14.97 | https://analyzingalpha.com/piercing-candlestick-pattern |
| 8,661 | piercing | 2 | downtrend | bullish reversal | forex | bullish reversal | low-high | 1 | 22 | 53 | 40 | 521 | -0.500 | -0.25 | 0.75 | 0.25 | 2 | 3 | 13.02 | 18.50 | 11.20 | https://analyzingalpha.com/piercing-candlestick-pattern |
| 8,662 | piercing | 2 | downtrend | bullish reversal | forex | bullish reversal | low-high | 2 | 22 | 53 | 40 | 1,089 | -0.550 | -0.28 | 0.75 | 0.15 | 1 | 4 | 27.22 | 85.17 | 17.00 | https://analyzingalpha.com/piercing-candlestick-pattern |
| 8,663 | piercing | 2 | downtrend | bullish reversal | forex | bullish reversal | low-high | 3 | 22 | 53 | 40 | 1,665 | -0.505 | -0.25 | 0.75 | 0.13 | 1 | 4 | 41.62 | 171.00 | 23.14 | https://analyzingalpha.com/piercing-candlestick-pattern |
| 8,664 | piercing | 2 | downtrend | bullish reversal | forex | bullish reversal | low-high | 4 | 22 | 53 | 40 | 1,752 | -0.500 | -0.25 | 0.75 | 0.10 | 1 | 4 | 43.80 | 211.25 | 25.19 | https://analyzingalpha.com/piercing-candlestick-pattern |
| 8,665 | piercing | 2 | downtrend | bullish reversal | forex | bullish reversal | low-high | 5 | 22 | 53 | 40 | 1,909 | -0.400 | -0.20 | 0.75 | 0.10 | 1 | 4 | 47.72 | 250.50 | 25.19 | https://analyzingalpha.com/piercing-candlestick-pattern |
| 8,666 | piercing | 2 | downtrend | bullish reversal | stock | bullish reversal | low-high | 1 | 3,541 | 21,353 | 17,009 | 102,861 | 0.039 | 0.02 | 0.80 | 0.52 | 9 | 8 | 6.05 | 5.88 | 6.23 | https://analyzingalpha.com/piercing-candlestick-pattern |
| 8,667 | piercing | 2 | downtrend | bullish reversal | stock | bullish reversal | low-high | 2 | 3,541 | 21,212 | 16,861 | 189,968 | 0.086 | 0.04 | 0.79 | 0.36 | 8 | 10 | 11.27 | 14.25 | 9.56 | https://analyzingalpha.com/piercing-candlestick-pattern |
| 8,668 | piercing | 2 | downtrend | bullish reversal | stock | bullish reversal | low-high | 3 | 3,541 | 21,087 | 16,740 | 278,881 | 0.160 | 0.08 | 0.79 | 0.29 | 6 | 12 | 16.66 | 26.72 | 12.54 | https://analyzingalpha.com/piercing-candlestick-pattern |
| 8,669 | piercing | 2 | downtrend | bullish reversal | stock | bullish reversal | low-high | 4 | 3,541 | 21,001 | 16,655 | 359,897 | 0.216 | 0.11 | 0.79 | 0.24 | 5 | 12 | 21.61 | 41.28 | 15.26 | https://analyzingalpha.com/piercing-candlestick-pattern |
| 8,670 | piercing | 2 | downtrend | bullish reversal | stock | bullish reversal | low-high | 5 | 3,541 | 20,906 | 16,550 | 442,295 | 0.275 | 0.14 | 0.79 | 0.21 | 5 | 12 | 26.72 | 59.33 | 17.89 | https://analyzingalpha.com/piercing-candlestick-pattern |
| 9,121 | piercing | 2 | downtrend | bullish reversal | forex | bullish mean reversion | atr-pattern_low | 1 | 22 | 54 | 17 | 77 | -0.059 | -0.03 | 0.31 | 0.47 | 2 | 1 | 4.53 | 2.00 | 6.78 | https://analyzingalpha.com/piercing-candlestick-pattern |
| 9,122 | piercing | 2 | downtrend | bullish reversal | forex | bullish mean reversion | atr-pattern_low | 2 | 22 | 54 | 17 | 119 | -0.468 | -0.23 | 0.31 | 0.18 | 1 | 2 | 7.00 | 5.00 | 7.43 | https://analyzingalpha.com/piercing-candlestick-pattern |
| 9,123 | piercing | 2 | downtrend | bullish reversal | forex | bullish mean reversion | atr-pattern_low | 3 | 22 | 54 | 17 | 132 | -0.292 | -0.15 | 0.31 | 0.18 | 1 | 2 | 7.76 | 9.33 | 7.43 | https://analyzingalpha.com/piercing-candlestick-pattern |
| 9,124 | piercing | 2 | downtrend | bullish reversal | forex | bullish mean reversion | atr-pattern_low | 4 | 22 | 54 | 17 | 136 | -0.116 | -0.06 | 0.31 | 0.18 | 1 | 2 | 8.00 | 10.67 | 7.43 | https://analyzingalpha.com/piercing-candlestick-pattern |
| 9,125 | piercing | 2 | downtrend | bullish reversal | forex | bullish mean reversion | atr-pattern_low | 5 | 22 | 54 | 17 | 144 | 0.060 | 0.03 | 0.31 | 0.18 | 1 | 2 | 8.47 | 13.33 | 7.43 | https://analyzingalpha.com/piercing-candlestick-pattern |
| 9,126 | piercing | 2 | downtrend | bullish reversal | stock | bullish mean reversion | atr-pattern_low | 1 | 3,541 | 21,426 | 6,895 | 27,372 | 0.243 | 0.12 | 0.32 | 0.62 | 7 | 6 | 3.97 | 3.76 | 4.31 | https://analyzingalpha.com/piercing-candlestick-pattern |
| 9,127 | piercing | 2 | downtrend | bullish reversal | stock | bullish mean reversion | atr-pattern_low | 2 | 3,541 | 21,323 | 6,836 | 60,954 | 0.310 | 0.16 | 0.32 | 0.44 | 5 | 7 | 8.92 | 10.15 | 7.97 | https://analyzingalpha.com/piercing-candlestick-pattern |
| 9,128 | piercing | 2 | downtrend | bullish reversal | stock | bullish mean reversion | atr-pattern_low | 3 | 3,541 | 21,279 | 6,809 | 93,057 | 0.345 | 0.17 | 0.32 | 0.34 | 4 | 7 | 13.67 | 19.75 | 10.61 | https://analyzingalpha.com/piercing-candlestick-pattern |
| 9,129 | piercing | 2 | downtrend | bullish reversal | stock | bullish mean reversion | atr-pattern_low | 4 | 3,541 | 21,244 | 6,785 | 122,931 | 0.392 | 0.20 | 0.32 | 0.28 | 3 | 7 | 18.12 | 30.38 | 13.39 | https://analyzingalpha.com/piercing-candlestick-pattern |
| 9,130 | piercing | 2 | downtrend | bullish reversal | stock | bullish mean reversion | atr-pattern_low | 5 | 3,541 | 21,214 | 6,765 | 153,566 | 0.430 | 0.22 | 0.32 | 0.24 | 3 | 8 | 22.70 | 43.48 | 16.23 | https://analyzingalpha.com/piercing-candlestick-pattern |
| 9,766 | piercing | 2 | downtrend | bullish reversal | forex | bearish mean reversion | atr-pattern_high | 1 | 22 | 54 | 27 | 204 | 0.481 | 0.24 | 0.50 | 0.74 | 3 | 1 | 7.56 | 7.80 | 6.86 | https://analyzingalpha.com/piercing-candlestick-pattern |
| 9,767 | piercing | 2 | downtrend | bullish reversal | forex | bearish mean reversion | atr-pattern_high | 2 | 22 | 52 | 26 | 547 | 0.616 | 0.31 | 0.50 | 0.54 | 2 | 1 | 21.04 | 19.07 | 23.33 | https://analyzingalpha.com/piercing-candlestick-pattern |
| 9,768 | piercing | 2 | downtrend | bullish reversal | forex | bearish mean reversion | atr-pattern_high | 3 | 22 | 51 | 25 | 762 | 0.920 | 0.46 | 0.49 | 0.48 | 2 | 1 | 30.48 | 36.17 | 25.23 | https://analyzingalpha.com/piercing-candlestick-pattern |
| 9,769 | piercing | 2 | downtrend | bullish reversal | forex | bearish mean reversion | atr-pattern_high | 4 | 22 | 50 | 25 | 1,095 | 0.400 | 0.20 | 0.50 | 0.28 | 2 | 2 | 43.80 | 50.43 | 41.22 | https://analyzingalpha.com/piercing-candlestick-pattern |
| 9,770 | piercing | 2 | downtrend | bullish reversal | forex | bearish mean reversion | atr-pattern_high | 5 | 22 | 50 | 25 | 1,500 | 0.440 | 0.22 | 0.50 | 0.24 | 2 | 2 | 60.00 | 97.67 | 48.11 | https://analyzingalpha.com/piercing-candlestick-pattern |
| 9,771 | piercing | 2 | downtrend | bullish reversal | stock | bearish mean reversion | atr-pattern_high | 1 | 3,541 | 21,393 | 11,371 | 54,198 | 0.136 | 0.07 | 0.53 | 0.57 | 9 | 6 | 4.77 | 4.42 | 5.22 | https://analyzingalpha.com/piercing-candlestick-pattern |
| 9,772 | piercing | 2 | downtrend | bullish reversal | stock | bearish mean reversion | atr-pattern_high | 2 | 3,541 | 21,206 | 11,242 | 112,098 | 0.078 | 0.04 | 0.53 | 0.36 | 6 | 8 | 9.97 | 11.53 | 9.10 | https://analyzingalpha.com/piercing-candlestick-pattern |
| 9,773 | piercing | 2 | downtrend | bullish reversal | stock | bearish mean reversion | atr-pattern_high | 3 | 3,541 | 21,034 | 11,126 | 176,154 | 0.034 | 0.02 | 0.53 | 0.26 | 5 | 11 | 15.83 | 21.45 | 13.88 | https://analyzingalpha.com/piercing-candlestick-pattern |
| 9,774 | piercing | 2 | downtrend | bullish reversal | stock | bearish mean reversion | atr-pattern_high | 4 | 3,541 | 20,833 | 11,003 | 248,777 | -0.020 | -0.01 | 0.53 | 0.20 | 5 | 11 | 22.61 | 32.94 | 20.11 | https://analyzingalpha.com/piercing-candlestick-pattern |
| 9,775 | piercing | 2 | downtrend | bullish reversal | stock | bearish mean reversion | atr-pattern_high | 5 | 3,541 | 20,700 | 10,907 | 308,304 | -0.080 | -0.04 | 0.53 | 0.15 | 4 | 11 | 28.27 | 46.80 | 24.89 | https://analyzingalpha.com/piercing-candlestick-pattern |
| 10,931 | piercing | 2 | downtrend | bullish reversal | forex | bearish continuation | high-close | 1 | 22 | 54 | 53 | 64 | -0.282 | -0.14 | 0.98 | 0.36 | 2 | 4 | 1.21 | 1.16 | 1.24 | https://analyzingalpha.com/piercing-candlestick-pattern |
| 10,932 | piercing | 2 | downtrend | bullish reversal | forex | bearish continuation | high-close | 2 | 22 | 54 | 53 | 73 | -0.154 | -0.08 | 0.98 | 0.28 | 2 | 4 | 1.38 | 1.47 | 1.34 | https://analyzingalpha.com/piercing-candlestick-pattern |
| 10,933 | piercing | 2 | downtrend | bullish reversal | forex | bearish continuation | high-close | 3 | 22 | 54 | 53 | 117 | -0.092 | -0.05 | 0.98 | 0.23 | 2 | 4 | 2.21 | 3.75 | 1.76 | https://analyzingalpha.com/piercing-candlestick-pattern |
| 10,934 | piercing | 2 | downtrend | bullish reversal | forex | bearish continuation | high-close | 4 | 22 | 54 | 53 | 130 | 0.134 | 0.07 | 0.98 | 0.23 | 2 | 4 | 2.45 | 4.83 | 1.76 | https://analyzingalpha.com/piercing-candlestick-pattern |
| 10,935 | piercing | 2 | downtrend | bullish reversal | forex | bearish continuation | high-close | 5 | 22 | 54 | 53 | 152 | 0.250 | 0.13 | 0.98 | 0.21 | 2 | 4 | 2.87 | 7.09 | 1.76 | https://analyzingalpha.com/piercing-candlestick-pattern |
| 10,936 | piercing | 2 | downtrend | bullish reversal | stock | bearish continuation | high-close | 1 | 3,541 | 21,552 | 19,616 | 25,280 | -0.360 | -0.18 | 0.91 | 0.32 | 10 | 14 | 1.29 | 1.42 | 1.23 | https://analyzingalpha.com/piercing-candlestick-pattern |
| 10,937 | piercing | 2 | downtrend | bullish reversal | stock | bearish continuation | high-close | 2 | 3,541 | 21,540 | 19,602 | 31,304 | -0.162 | -0.08 | 0.91 | 0.28 | 10 | 15 | 1.60 | 1.90 | 1.48 | https://analyzingalpha.com/piercing-candlestick-pattern |
| 10,938 | piercing | 2 | downtrend | bullish reversal | stock | bearish continuation | high-close | 3 | 3,541 | 21,524 | 19,585 | 37,612 | -0.012 | -0.01 | 0.91 | 0.25 | 9 | 15 | 1.92 | 2.42 | 1.76 | https://analyzingalpha.com/piercing-candlestick-pattern |
| 10,939 | piercing | 2 | downtrend | bullish reversal | stock | bearish continuation | high-close | 4 | 3,541 | 21,505 | 19,561 | 41,907 | 0.104 | 0.05 | 0.91 | 0.22 | 7 | 18 | 2.14 | 2.76 | 1.97 | https://analyzingalpha.com/piercing-candlestick-pattern |
| 10,940 | piercing | 2 | downtrend | bullish reversal | stock | bearish continuation | high-close | 5 | 3,541 | 21,498 | 19,553 | 46,558 | 0.210 | 0.11 | 0.91 | 0.20 | 7 | 18 | 2.38 | 3.25 | 2.16 | https://analyzingalpha.com/piercing-candlestick-pattern |
| Market | Strategy | Setup | Trades | Edge |
Pattern:
Pattern Bars:
Required Trend:
Traditional Strategy:
Market:
Strategy:
Setup:
RR:
Tickers:
Signals:
Trades:
Trade Bars:
Edge:
Edge Per Bar:
Confirm %:
Win %:
Cons Wins:
Cons Losses:
Avg. Trade Bars:
Avg. Win Bars:
Avg. Loss Bars:
Similar Candlestick Patterns
Multiple candlestick patterns are often confused with the piercing pattern. It’s essential not to poke holes in your portfolio profits by properly identifying patterns when practicing technical analysis.
In Neck vs. On Neck vs. Piercing Pattern


The in neck and on neck candlestick patterns are two-bar bearish continuation patterns, whereas the piercing pattern is a bullish reversal
The only difference between the neck patterns and the piercing pattern is where the second candle closes relative to the first candle. The on neck closes at the prior candle’s low, the in neck candle closes just above the previous candle’s close, and the piercing pattern closes between the midpoint and the last open.
Morning Star vs. Piercing Pattern
The morning star candlestick pattern is a three-bar bullish reversal pattern that shares many similarities with the piercing pattern. The primary difference between the morning star and the piercing pattern is that the morning star has a small second candle gaping down. The third candle moves well within the first candle’s body and can exceed the opening price.
The Bottom Line
The piercing is a two-bar bullish reversal pattern that’s best traded using a bullish mean reversion strategy in the stock market, according to a 21-year backtest. The pattern often leads to a bullish trend change, but the data shows it’s even more likely to portend near-team bullish volatility.
Cryptocurrency and forex traders should avoid trading this pattern due to not enough data to identify statistically significant trading strategies. Due to this pattern’s frequency, traders may want to look into different candlestick patterns.