The three stars in the south is a three-bar Japanese candlestick pattern that supposedly signals a weakening downtrend and a possible bullish reversal. The pattern occurs so infrequently that the verdict is still out if the pattern works as intended.
The pattern is so rare that it hasn’t occurred in the last 21 years in the stock market when analyzing the largest 5,000 companies.
And while I can’t tell you how a data-driven trader would trade it, I’ll still let you know how to identify it and how traders have traditionally traded this extremely rare candlestick pattern.
What Are Three Stars in the South Candlestick Patterns?

The three stars in the south is a three-candle bullish reversal pattern.
The name comes from the three black candlesticks that look like stars in a downtrend or “the south”.
Let’s take a look at this once-in-a-lifetime candlestick pattern.
How to Identify Three Stars in the South Candlestick Patterns

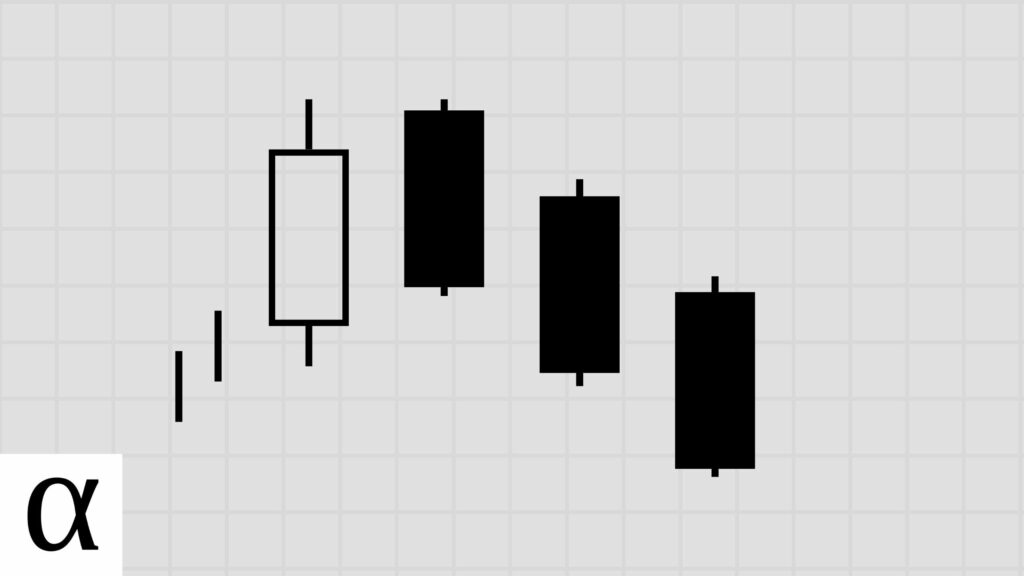
A valid three stars in the south pattern requires:
- The first candle is a long bearish candle with a long lower shadow.
- The second is bearish and opens higher than the prior close but within the preceding candle’s range.
- The second candle must have a lower shadow but not longer than the previous candle’s shadow.
- The third candle is a small bearish marubozu engulfed by the previous candle’s range.
- The three stars in the south must occur within a downtrend.
Again, this pattern, in its strictest sense, has not occurred in the stock market on the daily chart in the last 21 years.
How to Trade the Three Stars in the South Candlestick Pattern
So how does a trader trade this elusive pattern? To be honest, I wouldn’t. I don’t have data to back up my trades, and it happens so infrequently I’m not going to waste screening for it.
But for those interested, it’s a bullish reversal pattern where a trader goes long at the break of the high of the third candle with a stop loss below the first candle’s low.
Does the Three Stars in the South Candlestick Pattern Work? (Backtest Results)
I backtested the three stars in the south candlestick pattern on the daily timeframe in the crypto, forex, and stock markets using the following rules:
- A close above the 50-day SMA constitutes an uptrend.
- I tested risk-reward ranges from 1 to 5.
- The optimal risk-reward ratio is selected using profit per bar.
- Entry and exits are discussed in the how-to trade section above.
- Confirmation must occur within three days of the pattern signal.
| Id | Pattern | Pattern Bars | Required Trend | Traditional Strategy | Market | Strategy | Setup | RR | Tickers | Signals | Trades | Trade Bars | Edge | Edge Per Bar | Confirm % | Win % | Cons Wins | Cons Losses | Avg. Trade Bars | Avg. Win Bars | Avg. Loss Bars | Details |
|---|---|---|---|---|---|---|---|---|---|---|---|---|---|---|---|---|---|---|---|---|---|---|
| 8,671 | three_stars_in_the_south | 3 | downtrend | bullish reversal | forex | bullish reversal | low-high | 1 | 10 | 31 | 30 | 255 | -0.463 | -0.15 | 0.97 | 0.27 | 2 | 2 | 8.50 | 5.50 | 9.59 | https://analyzingalpha.com/three-stars-in-the-south-candlestick-pattern |
| 8,672 | three_stars_in_the_south | 3 | downtrend | bullish reversal | forex | bullish reversal | low-high | 2 | 10 | 31 | 30 | 763 | -0.604 | -0.20 | 0.97 | 0.13 | 2 | 12 | 25.43 | 26.00 | 25.35 | https://analyzingalpha.com/three-stars-in-the-south-candlestick-pattern |
| 8,673 | three_stars_in_the_south | 3 | downtrend | bullish reversal | forex | bullish reversal | low-high | 3 | 10 | 31 | 30 | 896 | -0.471 | -0.16 | 0.97 | 0.13 | 2 | 12 | 29.87 | 59.25 | 25.35 | https://analyzingalpha.com/three-stars-in-the-south-candlestick-pattern |
| 8,674 | three_stars_in_the_south | 3 | downtrend | bullish reversal | forex | bullish reversal | low-high | 4 | 10 | 31 | 30 | 1,521 | -0.500 | -0.17 | 0.97 | 0.10 | 2 | 12 | 50.70 | 3.67 | 55.93 | https://analyzingalpha.com/three-stars-in-the-south-candlestick-pattern |
| 8,675 | three_stars_in_the_south | 3 | downtrend | bullish reversal | forex | bullish reversal | low-high | 5 | 10 | 31 | 30 | 1,522 | -0.400 | -0.13 | 0.97 | 0.10 | 2 | 12 | 50.73 | 4.00 | 55.93 | https://analyzingalpha.com/three-stars-in-the-south-candlestick-pattern |
| 9,561 | three_stars_in_the_south | 3 | downtrend | bullish reversal | forex | bullish reversal | low-close | 1 | 10 | 31 | 31 | 260 | -0.420 | -0.14 | 1.00 | 0.29 | 2 | 2 | 8.39 | 5.11 | 9.73 | https://analyzingalpha.com/three-stars-in-the-south-candlestick-pattern |
| 9,562 | three_stars_in_the_south | 3 | downtrend | bullish reversal | forex | bullish reversal | low-close | 2 | 10 | 31 | 31 | 768 | -0.612 | -0.20 | 1.00 | 0.13 | 2 | 12 | 24.77 | 25.75 | 24.63 | https://analyzingalpha.com/three-stars-in-the-south-candlestick-pattern |
| 9,563 | three_stars_in_the_south | 3 | downtrend | bullish reversal | forex | bullish reversal | low-close | 3 | 10 | 31 | 31 | 901 | -0.483 | -0.16 | 1.00 | 0.13 | 2 | 12 | 29.06 | 59.00 | 24.63 | https://analyzingalpha.com/three-stars-in-the-south-candlestick-pattern |
| 9,564 | three_stars_in_the_south | 3 | downtrend | bullish reversal | forex | bullish reversal | low-close | 4 | 10 | 31 | 31 | 1,526 | -0.512 | -0.17 | 1.00 | 0.10 | 2 | 12 | 49.23 | 3.33 | 54.14 | https://analyzingalpha.com/three-stars-in-the-south-candlestick-pattern |
| 9,565 | three_stars_in_the_south | 3 | downtrend | bullish reversal | forex | bullish reversal | low-close | 5 | 10 | 31 | 31 | 1,527 | -0.415 | -0.14 | 1.00 | 0.10 | 2 | 12 | 49.26 | 3.67 | 54.14 | https://analyzingalpha.com/three-stars-in-the-south-candlestick-pattern |
| 9,641 | three_stars_in_the_south | 3 | downtrend | bullish reversal | forex | bearish mean reversion | atr-pattern_high | 1 | 10 | 32 | 9 | 15 | 0.337 | 0.11 | 0.28 | 0.67 | 3 | 2 | 1.67 | 2.00 | 1.00 | https://analyzingalpha.com/three-stars-in-the-south-candlestick-pattern |
| 9,642 | three_stars_in_the_south | 3 | downtrend | bullish reversal | forex | bearish mean reversion | atr-pattern_high | 2 | 10 | 32 | 9 | 43 | 1.004 | 0.33 | 0.28 | 0.67 | 3 | 2 | 4.78 | 6.67 | 1.00 | https://analyzingalpha.com/three-stars-in-the-south-candlestick-pattern |
| 9,643 | three_stars_in_the_south | 3 | downtrend | bullish reversal | forex | bearish mean reversion | atr-pattern_high | 3 | 10 | 32 | 9 | 131 | 0.772 | 0.26 | 0.28 | 0.44 | 2 | 2 | 14.56 | 22.25 | 8.40 | https://analyzingalpha.com/three-stars-in-the-south-candlestick-pattern |
| 9,644 | three_stars_in_the_south | 3 | downtrend | bullish reversal | forex | bearish mean reversion | atr-pattern_high | 4 | 10 | 32 | 9 | 224 | 1.216 | 0.41 | 0.28 | 0.44 | 2 | 2 | 24.89 | 45.50 | 8.40 | https://analyzingalpha.com/three-stars-in-the-south-candlestick-pattern |
| 9,645 | three_stars_in_the_south | 3 | downtrend | bullish reversal | forex | bearish mean reversion | atr-pattern_high | 5 | 10 | 32 | 9 | 290 | 1.660 | 0.55 | 0.28 | 0.44 | 2 | 2 | 32.22 | 62.00 | 8.40 | https://analyzingalpha.com/three-stars-in-the-south-candlestick-pattern |
| 10,261 | three_stars_in_the_south | 3 | downtrend | bullish reversal | forex | bullish mean reversion | atr-pattern_low | 1 | 10 | 32 | 13 | 48 | 0.235 | 0.08 | 0.41 | 0.62 | 6 | 1 | 3.69 | 1.75 | 6.80 | https://analyzingalpha.com/three-stars-in-the-south-candlestick-pattern |
| 10,262 | three_stars_in_the_south | 3 | downtrend | bullish reversal | forex | bullish mean reversion | atr-pattern_low | 2 | 10 | 32 | 13 | 213 | -0.074 | -0.02 | 0.41 | 0.31 | 1 | 4 | 16.38 | 34.25 | 8.44 | https://analyzingalpha.com/three-stars-in-the-south-candlestick-pattern |
| 10,263 | three_stars_in_the_south | 3 | downtrend | bullish reversal | forex | bullish mean reversion | atr-pattern_low | 3 | 10 | 32 | 13 | 255 | -0.077 | -0.03 | 0.41 | 0.23 | 1 | 4 | 19.62 | 13.00 | 21.60 | https://analyzingalpha.com/three-stars-in-the-south-candlestick-pattern |
| 10,264 | three_stars_in_the_south | 3 | downtrend | bullish reversal | forex | bullish mean reversion | atr-pattern_low | 4 | 10 | 32 | 13 | 297 | 0.154 | 0.05 | 0.41 | 0.23 | 1 | 4 | 22.85 | 27.00 | 21.60 | https://analyzingalpha.com/three-stars-in-the-south-candlestick-pattern |
| 10,265 | three_stars_in_the_south | 3 | downtrend | bullish reversal | forex | bullish mean reversion | atr-pattern_low | 5 | 10 | 32 | 13 | 614 | -0.080 | -0.03 | 0.41 | 0.15 | 1 | 6 | 47.23 | 22.00 | 51.82 | https://analyzingalpha.com/three-stars-in-the-south-candlestick-pattern |
| 10,806 | three_stars_in_the_south | 3 | downtrend | bullish reversal | forex | bearish continuation | high-close | 1 | 10 | 32 | 31 | 115 | 0.544 | 0.18 | 0.97 | 0.77 | 11 | 1 | 3.71 | 4.17 | 2.14 | https://analyzingalpha.com/three-stars-in-the-south-candlestick-pattern |
| 10,807 | three_stars_in_the_south | 3 | downtrend | bullish reversal | forex | bearish continuation | high-close | 2 | 10 | 31 | 30 | 461 | 0.596 | 0.20 | 0.97 | 0.53 | 7 | 2 | 15.37 | 9.62 | 21.93 | https://analyzingalpha.com/three-stars-in-the-south-candlestick-pattern |
| 10,808 | three_stars_in_the_south | 3 | downtrend | bullish reversal | forex | bearish continuation | high-close | 3 | 10 | 29 | 28 | 685 | 1.000 | 0.33 | 0.97 | 0.50 | 6 | 2 | 24.46 | 24.79 | 24.14 | https://analyzingalpha.com/three-stars-in-the-south-candlestick-pattern |
| 10,809 | three_stars_in_the_south | 3 | downtrend | bullish reversal | forex | bearish continuation | high-close | 4 | 10 | 29 | 28 | 836 | 1.146 | 0.38 | 0.97 | 0.43 | 6 | 2 | 29.86 | 38.08 | 23.69 | https://analyzingalpha.com/three-stars-in-the-south-candlestick-pattern |
| 10,810 | three_stars_in_the_south | 3 | downtrend | bullish reversal | forex | bearish continuation | high-close | 5 | 10 | 27 | 26 | 874 | 1.080 | 0.36 | 0.96 | 0.35 | 3 | 2 | 33.62 | 53.11 | 23.29 | https://analyzingalpha.com/three-stars-in-the-south-candlestick-pattern |
| 11,801 | three_stars_in_the_south | 3 | downtrend | bullish reversal | forex | bearish continuation | high-low | 1 | 10 | 32 | 31 | 116 | 0.482 | 0.16 | 0.97 | 0.74 | 10 | 1 | 3.74 | 4.26 | 2.25 | https://analyzingalpha.com/three-stars-in-the-south-candlestick-pattern |
| 11,802 | three_stars_in_the_south | 3 | downtrend | bullish reversal | forex | bearish continuation | high-low | 2 | 10 | 31 | 30 | 462 | 0.596 | 0.20 | 0.97 | 0.53 | 7 | 2 | 15.40 | 9.69 | 21.93 | https://analyzingalpha.com/three-stars-in-the-south-candlestick-pattern |
| 11,803 | three_stars_in_the_south | 3 | downtrend | bullish reversal | forex | bearish continuation | high-low | 3 | 10 | 29 | 28 | 685 | 1.000 | 0.33 | 0.97 | 0.50 | 6 | 2 | 24.46 | 24.79 | 24.14 | https://analyzingalpha.com/three-stars-in-the-south-candlestick-pattern |
| 11,804 | three_stars_in_the_south | 3 | downtrend | bullish reversal | forex | bearish continuation | high-low | 4 | 10 | 29 | 28 | 836 | 1.146 | 0.38 | 0.97 | 0.43 | 6 | 2 | 29.86 | 38.08 | 23.69 | https://analyzingalpha.com/three-stars-in-the-south-candlestick-pattern |
| 11,805 | three_stars_in_the_south | 3 | downtrend | bullish reversal | forex | bearish continuation | high-low | 5 | 10 | 27 | 26 | 874 | 1.080 | 0.36 | 0.96 | 0.35 | 3 | 2 | 33.62 | 53.11 | 23.29 | https://analyzingalpha.com/three-stars-in-the-south-candlestick-pattern |
| Market | Strategy | Setup | Trades | Edge |
Pattern:
Pattern Bars:
Required Trend:
Traditional Strategy:
Market:
Strategy:
Setup:
RR:
Tickers:
Signals:
Trades:
Trade Bars:
Edge:
Edge Per Bar:
Confirm %:
Win %:
Cons Wins:
Cons Losses:
Avg. Trade Bars:
Avg. Win Bars:
Avg. Loss Bars:
To get some results, I used the lenient pattern identification where the final candle has shorter wicks and isn’t necessarily a bearish marubozu.
Similar Candlestick Patterns
Traders confuse the three stars in the south patterns with other candlestick patterns.
Three White Soldiers vs. Three Stars in the South

The three white soldiers is a three-bar bullish reversal pattern. It has three bullish candlesticks with consecutively higher closes, with each opening within or near the previous bullish real body with little to no upper wick. The confusion between these two patterns stems from the name–they both have three candles occurring in a downtrend.
The similarities end there, however.
Three Black Crows vs. Three Stars in the South
The three black crows is a four-bar bearish reversal pattern. It has three consecutive declining candlesticks with little to no lower shadow, and each candle after the first must open within the prior candle’s real body. The first bearish bar must close under the previous close.
Again, other than the name, there are not a lot of similarities between these two patterns.
The Bottom Line
The three stars in the south pattern is extremely rare, and I wouldn’t recommend trading it as it doesn’t occur frequently enough to screen for it regularly, and there’s not enough data to back up the profit assumptions.
So why learn this candlestick pattern? Well, I set out to test every pattern to understand price action deeply. And now, if I’m ever playing trader trivia, I can answer, “mirror, mirror, what is the rarest pattern of them all?”
Data-driven traders should find more frequent bullish reversal candlestick patterns.