Keltner Channels are a technical indicator that combines an exponential moving average with volatility-based envelopes set above and below the EMA at a fixed percentage of the same duration. Keltner Channels aims to identify the underlying price trend and over-extended conditions.
This post will dive deep into what Keltner Channels are, how they are used in strategies, and how to backtest them in Backtrader.
Keltner Channel History
In 1960, Chester Keltner introduced Keltner Channels in his famous book How to Make Money in Commodities. Initially, Keltner Channels used the 10-day simple moving average as the centerline, and the high-low range was subtracted and added from the envelope lines.
Famed market wizard Linda Bradford Raschke modified Keltner Channels in 1980 to a volatility-based indicator using Average True Range (ATR) to set the channel width. Today, most use Linda’s version of the Kelter Channel.
What Do Keltner Channels Tell Us?
Like all technical analysis indicators, Keltner Channels are a tool for traders to help understand price action — or the psychology of the market. When we understand the psychology of the market, we can more easily identify supply and demand issues and exploit them for profit.
Keltner Channels are a lagging indicator designed to identify the prevalent price trend.
The Keltner Channel midline shows the price trend. A breach of the envelope, a cross of the upper or lower lines surrounding the midline, can be interpreted as a price breakout or overbought/oversold conditions.
A breakout is where we expect price action to continue, and overbought/oversold conditions lead to price reverting, also known as mean reversion.
With a breach of the Keltner Channels potentially leading to two different results, how do we determine if the market is likely to mean revert or to continue?
We’ll go over that soon, but before we do, let’s discover how to calculate Keltner Channels.
Keltner Channel Calculation
Keltner Channels have a middle line, also known as a basis, and upper and lower channel lines collectively referred to as the envelope. The picture below shows an example of a Keltner Channel for the S&P 500 daily chart.
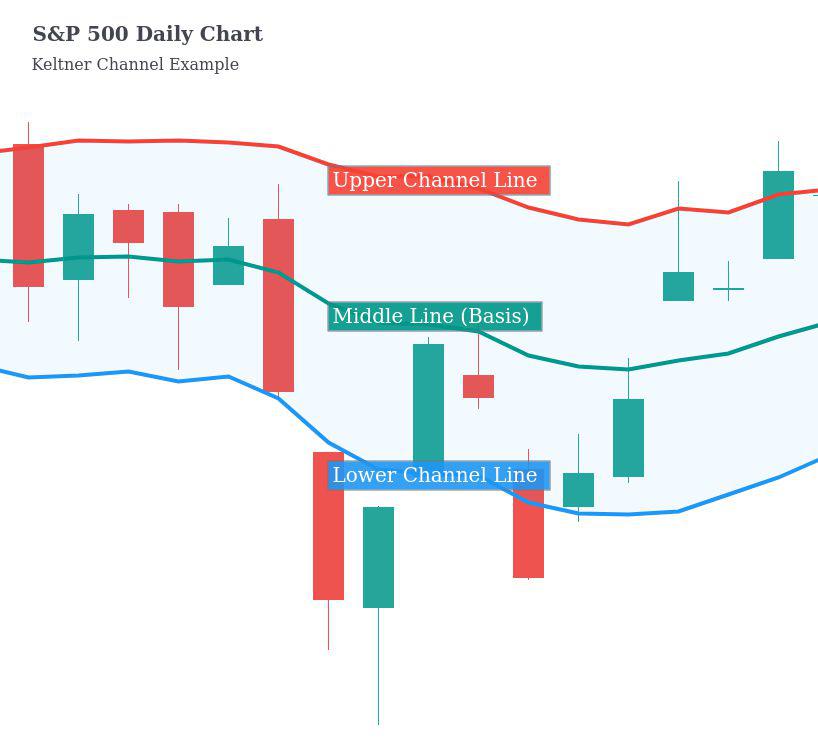
The middle line is an exponential moving average. This midline conventionally uses a 20-period EMA.
The envelope lines typically are set above and below the basis by two times the Average True Range. Some calculations use a multiple of the daily high/low range, but it is more common to use the ATR.
The formulas for each component are below.
- Middle Line (Basis) = EMA
- Upper Channel Line = EMA + 2 * ATR
- Lower Channel Line = EMA + 2 * ATR
Keltner Channel Limitations
Like many indicators, there’s a tug-of-war between signal and noise.
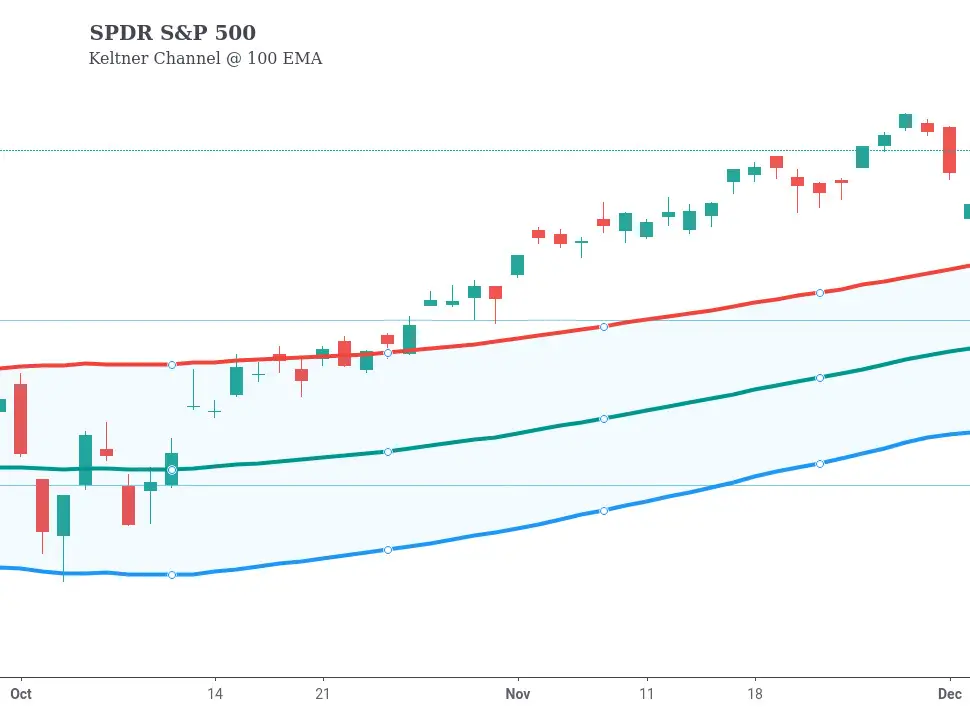
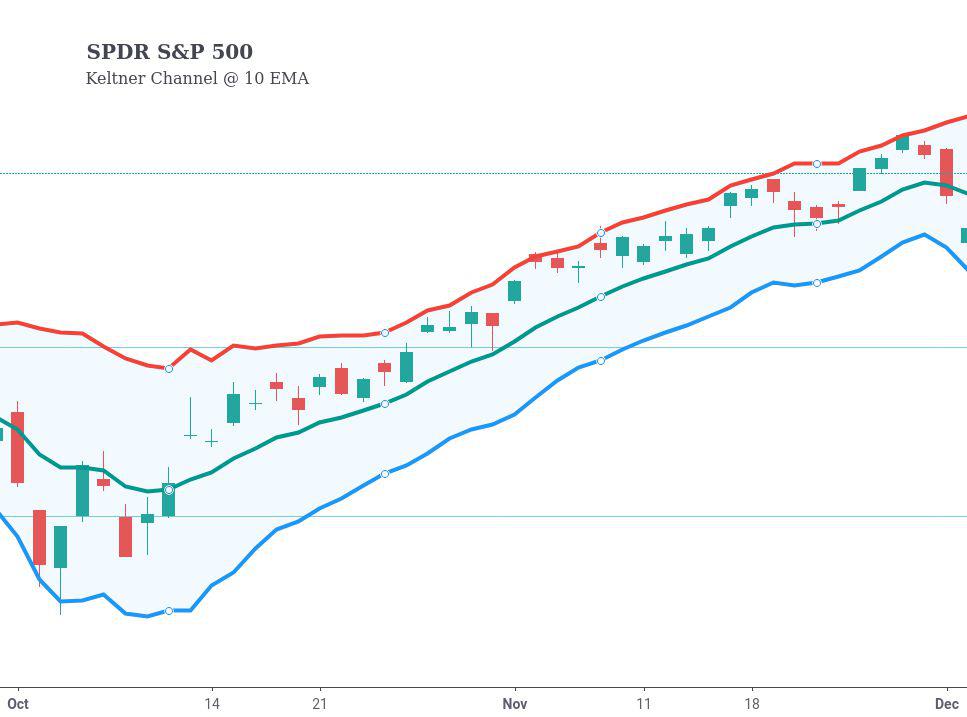
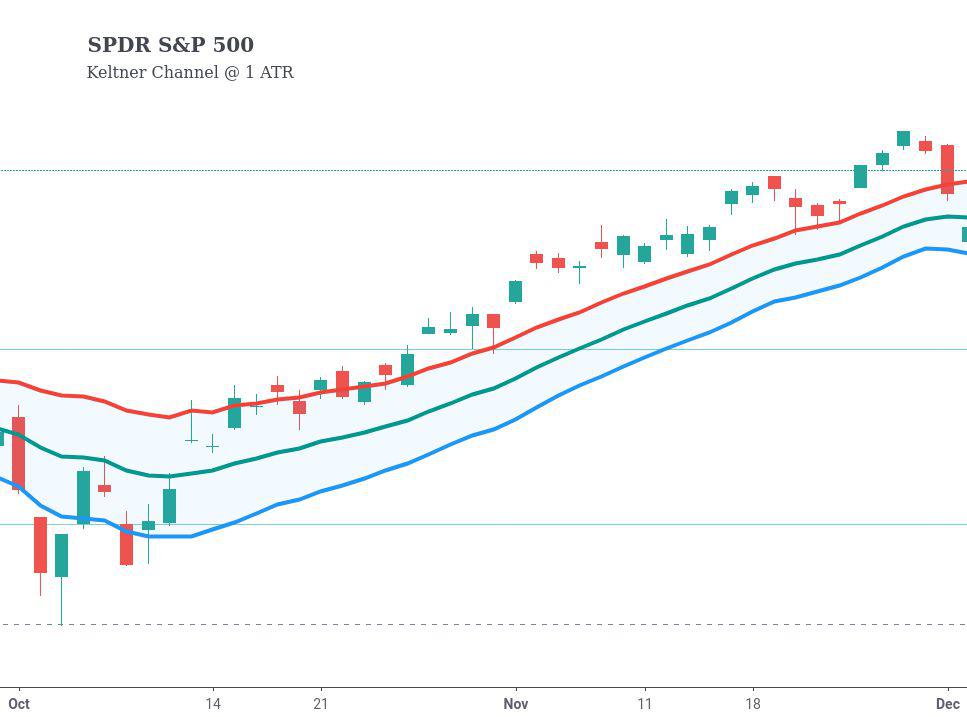
If you set the EMA too slow, the trend will be easy to see, but the channels won’t respond quickly to price changes; however, setting the EMA too short will reverse this problem. The trend will be harder to identify, but the channels will quickly incorporate price action. See the below.
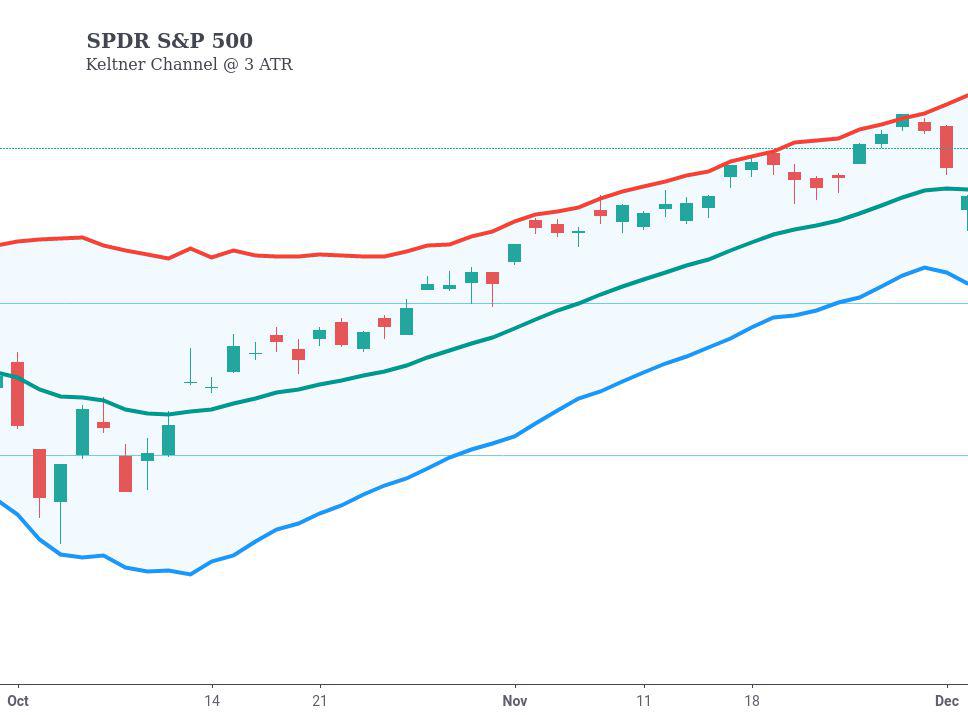
If you configure the envelopes too narrowly, the signal will occur more frequently but may be less reliable. If the envelopes are set too broad, you may not even get a signal to trade, as shown below.
Additionally, no rule states Keltner Channels must act as support or resistance. Indicators are just tools to help the trader understand the price action.
It’s important to note that Keltner Channels use moving averages, which means it’s inherently a lagging indicator. Lagging indicators do precisely that: they lag behind price. This lag naturally means the indicator is providing delayed feedback.
With the drawbacks out of the way, let’s discuss how Keltner Channels compare to its close cousin: Bollinger Bands.
Keltner Channels vs. Bollinger Bands
Keltner Channels and Bollinger Bands are very similar. You can see them overlaid below with the Keltner Channels in red and the Bollinger Bands in green.
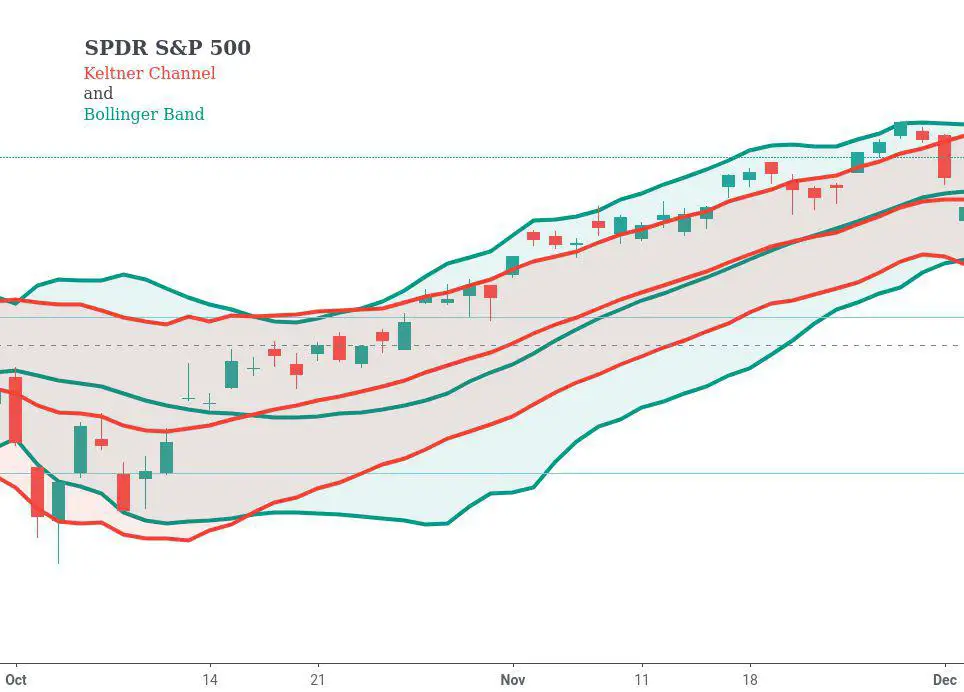
The midline and envelopes are calculated differently in Keltner Channels and Bollinger Bands.
Bollinger Bands calculate the midline using a simple moving average, whereas Keltner Channels use an exponential moving average. This calculation difference causes Bollinger Bands to react more slowly to changes in price direction.
Additionally, while Keltner Channels use the Average True Range (ATR) to calculate the envelope lines, Bollinger Bands use standard deviation. Standard deviation is often abbreviated as SD and expresses the variability of a population. If you’re interested, you can learn more about standard deviation.
Keltner Channels are smoother than Bollinger bands without getting too technical as the standard deviation is more volatile than the Average True Range.
Keltner Channel Trading Strategies
Prices are either trending or not. The key to using Keltner Channels is to understand if there is a trend and what that underlying trend is.
Strong Trend, Breakout
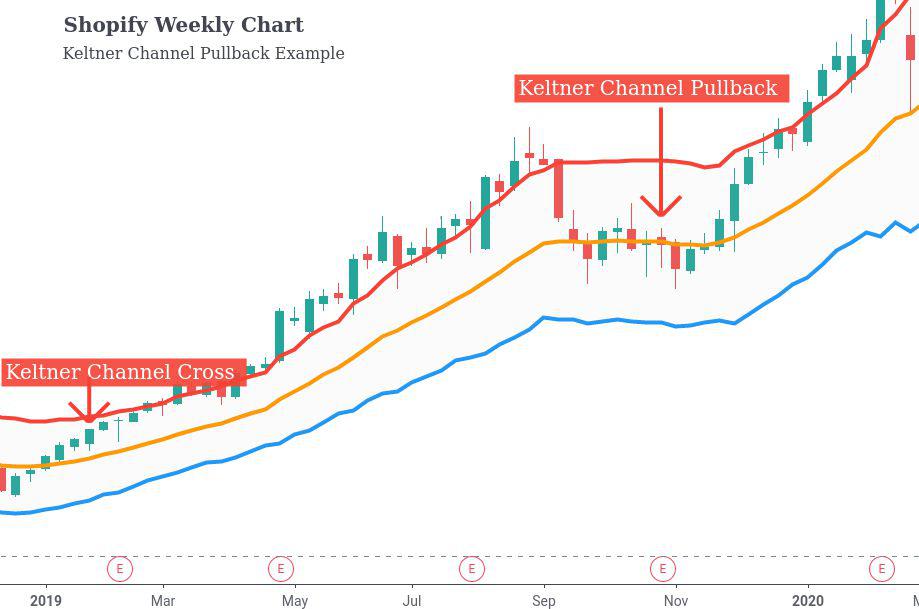
A cross of the channel can signify strength during a clearly defined trend. To see this in action, look at the Shopify weekly chart for an example demonstrating a breakout.
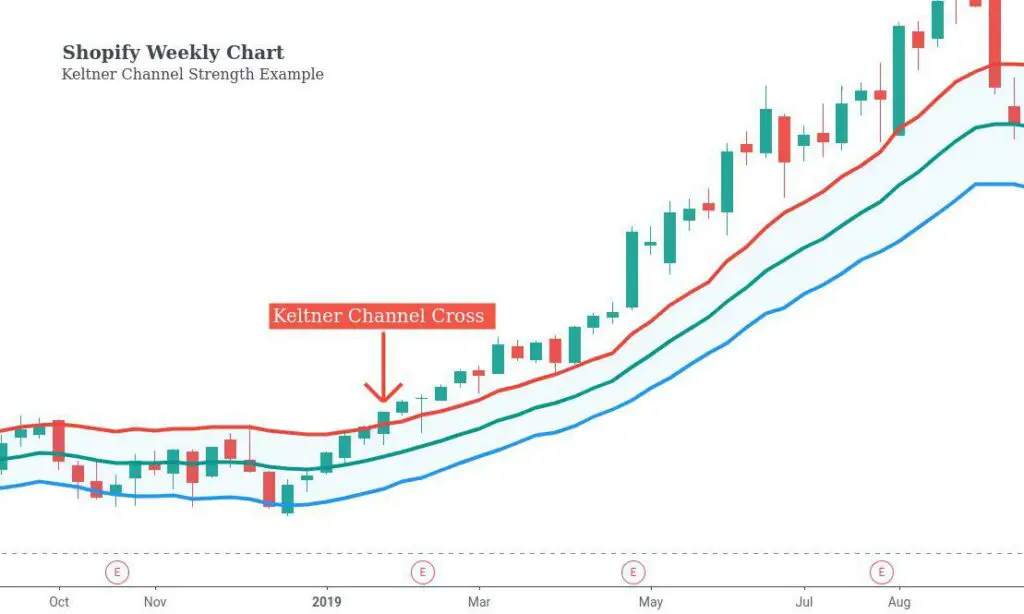
Strong Trend, Pullback
Weeks later, Shopify pulls back to the basis line. This is often an excellent time to buy with a strong trend in place. See the Shopify weekly chart for a profitable pullback.
And while Shopify and the market’s trend were up, the mirror is also true. A breakdown of the lower Keltner Channel while in a downtrend can be a profitable short. The same goes for a pullback.
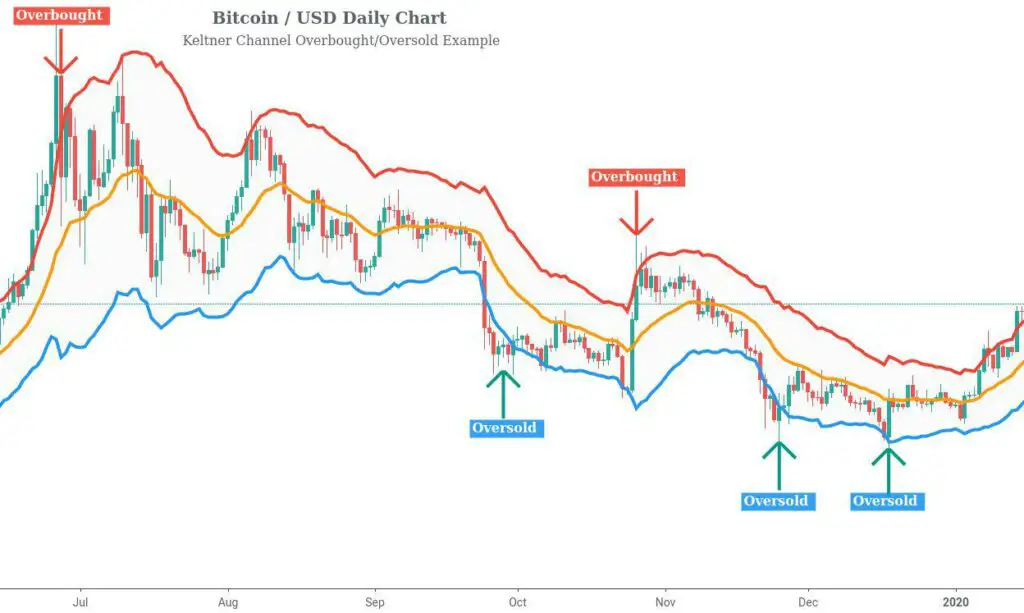
Sideways Market, False Breakout
Price action exhibits different behavior in trending markets and markets that are not. When a market isn’t trending, the Keltner Channels are more prone to be overbought or oversold conditions.
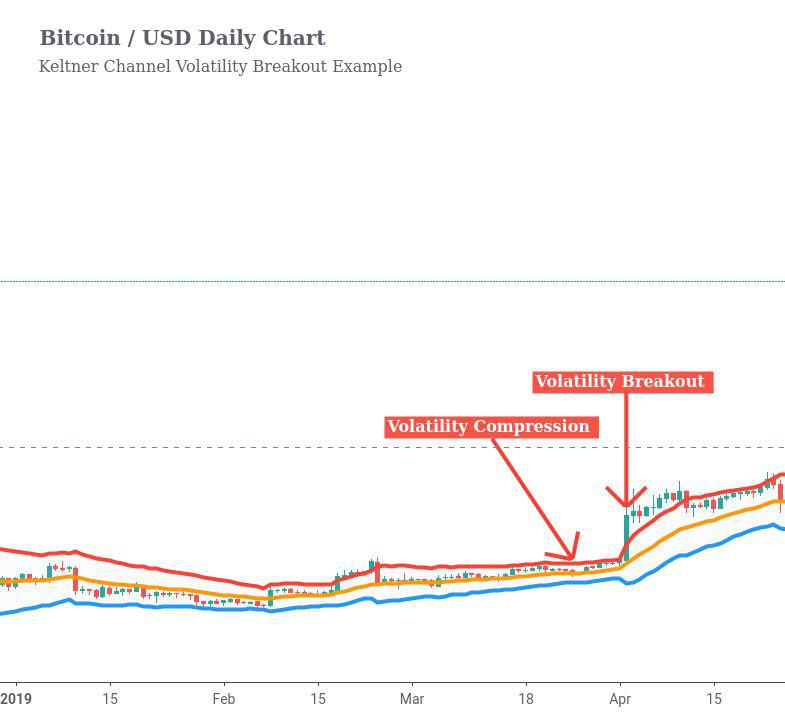
Sideways Market, Volatility Breakout
Volatility breakouts are a style of short-term trading designed to capture the next move. When prices contract and make a significant move to the upside or downside, the odds favor the immediate momentum.
The Bitcoin chart below demonstrates prices contracting and then a meaningful move up with continued momentum relative to recent history.
While Keltner Channels are helpful for understanding price action, they can be combined with other indicators on multiple timeframes to improve their signal.
Remember, when analyzing price action, we’re trying to profit from supply and demand imbalances.
Keltner Channels Coded
Let’s create Keltner Channels in Python using Backtrader now that we understand how this indicator works and when to use it.
class KeltnerChannel(bt.Indicator):
    lines = ('mid', 'upper', 'lower')
    params = dict(
                ema=20,
                atr=2
                )

    plotinfo = dict(subplot=False)  # plot along with data
    plotlines = dict(
        mid=dict(ls='--'),  # dashed line
        upper=dict(_samecolor=True),  # use same color as prev line (mid)
        lower=dict(_samecolor=True),  # use same color as prev line (upper)
    )

    def __init__(self):
        self.l.mid = bt.ind.EMA(period=self.p.ema)
        self.l.upper = self.l.mid + bt.ind.ATR(period=self.p.ema) * self.p.atr
        self.l.lower = self.l.mid - bt.ind.ATR(period=self.p.ema) * self.p.atr
The code is pretty easy to understand. We set the parameters to a 20-period EMA and a 2 ATR. I want the Keltner Channels to appear on the same graph as the price, so I set subplot=false. I also configure the plotlines as desired. After that, I create all three lines in __init__ based on the math we covered previously.
Now that we’ve created the Keltner Channel indicator let’s get it to graph over top of SPY. I won’t cover the code as it’s already been covered in Backtrader: Getting Started Backtesting Strategies.
class Strategy(bt.Strategy):
def __init__(self):
self.keltner = KeltnerChannel()
def next(self):
if self.keltner.l.lower[0] > self.data[0]:
self.buy()
elif self.keltner.l.upper[0] < self.data[0]:
self.sell()
if __name__ == '__main__':
# Create cerebro instance
cerebro = bt.Cerebro()
# Add Benchmark
benchmark = get_security_data(BENCHMARK_TICKER, START, END)
benchdata = bt.feeds.PandasData(dataname=benchmark, name='SPY', plot=True)
cerebro.adddata(benchdata)
print('Starting Portfolio Value: %.2f' % cerebro.broker.getvalue())
# Add Strategy
cerebro.addstrategy(Strategy)
results = cerebro.run(stdstats=False)
print('Final Portfolio Value: %.2f' % cerebro.broker.getvalue())
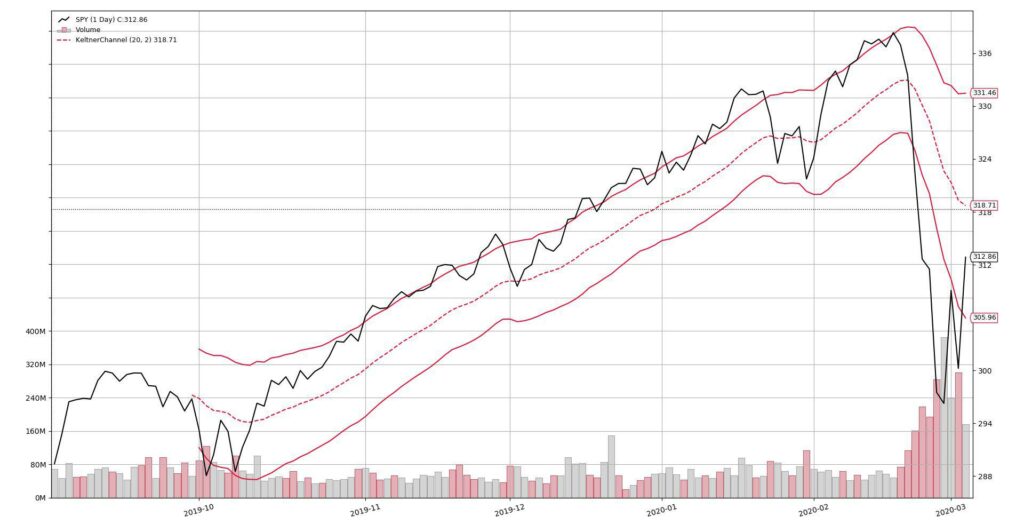
cerebro.plot()Backtrader will use Matplotlib to create something similar to the following if everything is set up correctly.