Support and resistance lines are technical analysis tools predicting where an asset’s price will tend to stop and reverse. Without breaking through, multiple touches of the resistance area, often accompanied by high volume, denote these levels.
The concept of support and resistance is a significant element in technical analysis. While the basic idea of support and resistance is simple, it’s essential to go deeper.
This post will break down the many support and resistance elements straightforwardly.
What Are Support and Resistance?
Let’s begin by defining both support and resistance in more detail. After that, we’ll then review charts to help visualize support and resistance in action.
Price support occurs when a surplus of buying activity occurs when an asset’s price drops to a particular area. This buying activity causes the price to move back up and away from the support level.
Resistance is the opposite of support. Resistance levels are areas where prices fall due to overwhelming selling pressure.
Support and resistance levels occur due to large institutions buying and selling securities at their target buy and sell levels.
Breakthrough, Breakdown, and Rejection
Two things can happen when an asset’s price reaches a support or resistance level.
The first is that the price bounces off, or rejects from, the support or resistance area. Sometimes the price bounces almost exactly off of support or resistance lines, while other times, the price may enter a support or resistance zone and then reject.
The second is that the price breaks through the support or resistance level. A break of resistance is called a breakthrough, and a breaking of support is known as a breakdown.
Part of what makes support and resistance such a complex concept is that it doesn’t always look the same. There are different ways support and resistance may manifest on a price chart. To see what we mean by this, let’s look at a few examples.

The above shows support and resistance as a straight line in blue. You’ll see that the asset price on this chart often falls to the support level but then bounces back up. But eventually, the price does break through the support line.
Notice that it struggles to break through again as the price increases – repeatedly bouncing off the line, which now acts as a resistance level. We’ll discuss how and why a support level may become a resistance level shortly, but the key takeaway here is that it’s possible for the same line on a price chart to be both a support level and resistance level.
But, as we see in the chart below, it’s also possible for support and resistance to present itself at multiple levels.

You’ll see the support and resistance levels creating a ranging trading channel in the chart above. When this is the case, the resistance level makes the upper level of the trading channel, and the support level creates the bottom level.
The asset’s price oscillates between these two levels, typically bouncing off but occasionally breaking through support and resistance. The critical thing to recognize is that a price channel contains price action between two parallel lines.

Prices can also trend in a channel. In this case, support and resistance are moving up (uptrend) or down (downtrend) in parallel while rejecting from support and resistance.
These three examples are not the only ways you’ll see support and resistance manifest in a chart. Still, they are some of the most common and should give you an intuition on what to look for when analyzing charts for support and resistance.
Why Support and Resistance Levels Exist
Institutional investors and traders determine support and resistance levels for most securities. Let’s back up this assertion.
Roughly five million shares of Amazon exchange hands each day. At 3,250 per share, that’s 16.25 billion per day. Institutions hold a tremendous amount of shares.

These aren’t retail numbers.
And while support and resistance may manifest themselves on a chart in many ways, they only exist for two: fundamental and psychological.
Fundamental Causes of Support & Resistance
Large institutions don’t buy securities without doing a lot of research beforehand — and you shouldn’t either. Institutions value companies. They have target buy and sell prices for every security they hold and on their buy list.
When a stock on their buy list hits their buy price, they buy; when a position hits their sell target, they sell. Easy enough, right?
Not exactly — The transaction volume institutions require is massive. The size of their positions leads to a unique challenge:
Institutions must buy or sell large volumes of shares without moving the market too much, causing slippage or tipping the market off and being front-run.
To remedy these two challenges, institutions buy and sell shares over many weeks or months at their target levels. Understanding this makes it easy to see why there are support and resistance at these price levels.
This is also why the stock market goes up like an elevator and down like an escalator. Institutional buying is a slow and steady process, but selling due to de-risking and deleveraging is not.

The above fear-driven sell-off also brings us to the second reason support and resistance levels exist.
Psychological Reasons for Support & Resistance
An Amazon.com search lists 908 books on “Trading Psychology”. My favorite book on the matter is Thinking Fast and Slow by Daniel Kahneman.
I’m afraid I disagree with most reasons touted for the psychology behind support and resistance for larger stocks; however, these emotions are genuine from the lens of an individual trader.
As I’ve said previously, the institutional trader at the margin determines most securities’ prices and the support and resistance levels. These institutions have rigorous processes around their buying and selling and only divert from these processes when risk becomes intolerable, such as during the initial phases of the COVID-19 crisis.
While almost all traders suffer from psychological biases such as loss aversion, most of these don’t occur at the institutional level. But there are instances where psychological factors, such as the Fundamental Strength and the 52-Week High Anchoring Effect, come into play.
Analysts put prices targets on companies, and those targets are often affected by other analyst valuations and historical price action. These anchoring biases strengthen support and resistance at these levels.
When Support and Resistance Switch
When the price reaches a line of support or resistance, the price can either bounce off the line or break through it. When the price breaks through, the role of the two lines reverses. If a line supported price, it’s now resistance, and if it was resistance, it’s now support.
A great example of this in action is the first price chart shown earlier, displayed again for convenience.

Empowered now with the fundamental understanding of institutional trading and transaction volume, you should now understand why support and resistance flip, and vice versa:
Institutional traders have to transact with other institutions
This leads to resistance (selling activity) turning into support (buying activity) and vice versa.
How to Determine Support and Resistance
There are multiple ways to draw support and resistance lines on a price chart. We’ll cover the most common below.
Support & Resistance Using Pivots
Pivot highs and lows are the most direct potential support and resistance areas to identify. You can draw horizontal rays at pivot highs and lows (using the candle wicks) or let TradingView.com do it by adding the Pivot HL indicator.

And just because these levels are simple to identify doesn’t mean they are ineffective. It’s quite the opposite. The clarity of these support and resistance areas makes them more effective.
Support & Resistance Using Levels
You can use the eyeball method or once again use one of the many TradingView indicators to identify support and resistance levels.

Support & Resistance Using Trendlines
Trendlines act as potential support and resistance areas. To draw a resistance trendline, connect at least two highs without having any highs cross above the resistance trendline. To create a support trendline, connect multiple lows without any low crossing the line. Once again, TradingView comes to the rescue with a trendline indicator.

Support & Resistance Using Moving Averages
Many traders use moving averages as potential support and resistance areas.
Lower-timeframe traders use the 200-day simple moving average (SMA) to determine the market regime. Paul Tudor Jones says the 200-day moving average of closing prices is his critical indicator.
Shorter-term traders frequently use the 12/26 period exponential moving averages (EMAs) as potential support and resistance areas. Once again, your charting or trading platform will provide you with these.
Notice how the Shopify hourly chart respects the 12-period EMA on multiple instances.

Keep in mind that humans are pattern recognition machines. We often see patterns where none exist — in other words, be careful when playing off potential support and resistance areas. Your eyes may be playing tricks on you.
Other Support & Resistance Elements
Many factors come into play when determining the strength of a support or resistance level. Here are five other factors to consider when analyzing potential support and resistance zones.
1. Time
As with almost any technical analysis tool, time plays an important role. The more time has passed since establishing a support or resistance level, the more likely it’s no longer relevant.
If an institution was accumulating shares at a particular price area finds a better place to put their money to work, that price area will no longer act as support.
2. Number of Touches
Another popular signal traders look for when identifying support and resistance levels is the number of touches. The common wisdom is that the more times the price has bounced off instead of broken through a support or resistance level, the stronger that level is believed to be
I’m afraid I have to disagree with this.
If an institution is accumulating a significant position, after multiple touches, its position will fill. Instead, I look for two tests with solid rejection, and I get nervous after four or more touches.
3. Preceding Price Movement
In general, support and resistance levels are considered more significant after a steep advance or decline. This is because there are more enthusiasm and momentum behind steep increases or decreases in price. Therefore, the support or resistance level must be reasonably healthy for the price to bounce back.
I think of it this way. When stocks are volatile, it’s the price discovery process in action. Prominent players are trying to agree on the value of an asset. If there are extreme moves, it’s due to uncertainty — and as new information becomes available, these analysts typically become more confident over time instead of less.
4. Volume
The final signal of support and resistance strength we’ll look at is volume. Volume works similarly to preceding price movement as a signal since it also helps convey the momentum behind a trend, but there’s another reason volume is a valuable signal. Higher volume levels mean more buying and selling occurs, leading to potentially better areas of support and resistance.
Let me provide an example. Imagine there’s a ton of short-sellers shorting Apple at 100. The price moves to 95 and then starts to push back on the shorts. They’ll likely cover around the $100 area to not take a loss. More short positions equal more short covering, and more covering leads to higher price rejection at the level.
5. Round Numbers
Once you begin spending more time with support and resistance levels, you’ll likely notice that levels end up at round numbers a disproportionate amount of the time. For example, around 50 or 100. Why is this?
It all goes back to the psychology behind support and resistance. If people were rational, there would be no correlation between the support and resistance and round numbers, but we’re not!
Savvy traders know this and even call it out directly when discussing support levels such as “potential support at $100 psychological”.
Advanced Support & Resistance Techniques
There are also a few lesser-known but valuable ways to use support and resistance when technical trading.
Pivot Points
Pivot points originating from floor traders in the pits are a leading technical indicator that attempts to estimate future support and resistance levels based on past and current prices.
While there are multiple flavors of pivot points, the standard calculation uses the average of the high, low, and previous day’s closing price.
Beyond the pivot point itself, the pivot point indicator includes multiple support and resistance levels. Usually, at least two support and resistance levels are displayed, known as S1/S2 and R1/R2, respectively.
Again, your charting platform will come to the rescue. You can see Pivot Points charted below.

I find that pivot points have some predictive capability and help determine bias for market direction. While shown daily for display purposes, I use pivot points in a few of my algorithmic trading strategies.
Fibonacci Retracements
Another popular support and resistance indicator is Fibonacci Retracement.
A retracement is a short-term price correction during a larger upward or downward trend that does not indicate a reversal of the more significant trend. The goal of retracements is to get you into a trade before continuing the move.
Fibonacci retracement shows how much a move corrects from its extremes. To chart fib retracements, select the lowest low in an uptrend, and connect it to the highest high. You would connect the highest high to the lowest low in a downtrend. Those new to this indicator think of it as the amount the price pulls back before likely continuing the move.
Most charting software includes the following support and resistance levels in their Fibonacci retracement tool:
| Retracement % |
|---|
| 0.0% |
| 23.6% |
| 38.2% |
| 50% |
| 61.8% |
| 65% |
| 78.6% |
| 100% |
These eight levels often act as support and resistance for the asset’s price.
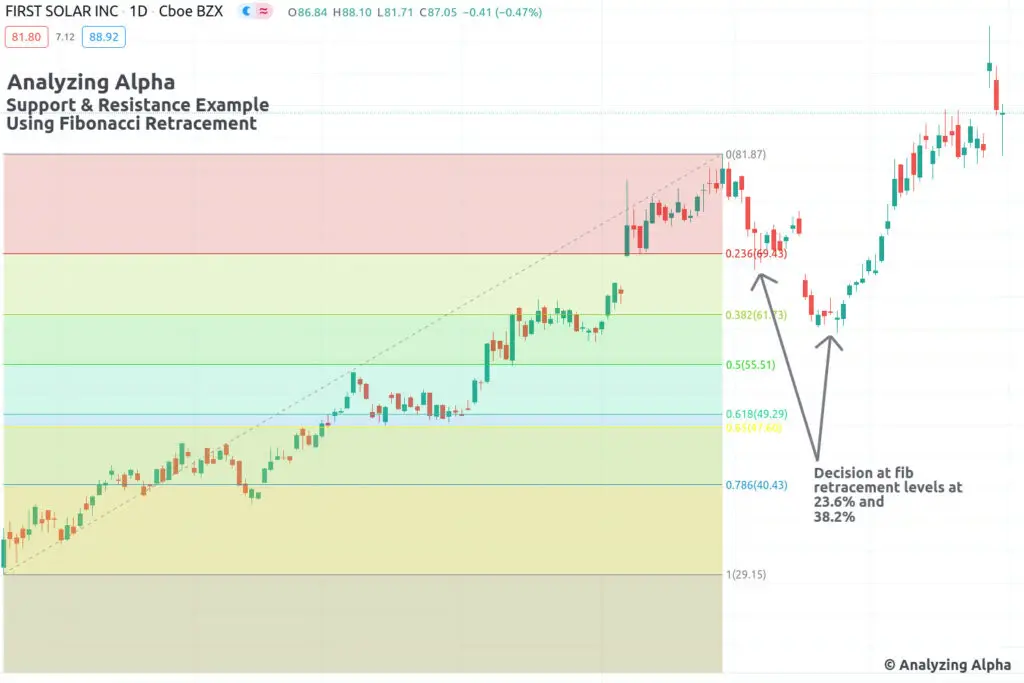
In the above chart, the dashed line is the uptrend line between the two extremes (the low and the high). You’ll see that there are eight lines (including the gray line at the bottom). You’ll also see that price discovery occurs at 23.6% and the 38.2% retracement levels before continuing with the uptrend.
Also, between the 61.8% and the 65% fib retracement level is called the Fibonacci Golden Pocket and is the most respected reversal zone when using retracement analysis.
Trading Using Support and Resistance Levels
Now that we’ve covered much of the theoretical aspect of support and resistance, we can now look at how support and resistance can inform trading decisions. As with any indicator, there are many different ways to use support and resistance, but we’ll stick with the three basic ways support and resistance can inform trading.
The first way to use support and resistance is to enter into a position when you think a reversal will occur. For example, the stock price has dropped, and it has now reached a resistance area. The indication is that the price will bounce off the resistance level and begin increasing.
Another option is a breakout. We’ll give an example of a breakdown when a stock breaks to the downside. If there is little to no support past the support area, and the support level was touched multiple times, soaking up the institutional buy volume, shorting a breakdown may be a good play.
Finally, you might use support and resistance lines to place stop-losses. In the above instances, if you’re wrong, a stop loss near the support area will prevent the trade from going too far in the wrong direction if your thesis is incorrect.
What Timeframe Is Best for Support and Resistance?
Support and resistance levels work on all timeframes. Like trends, support and resistance on lower timeframes are stronger than support and resistance on higher timeframes. This is due to the fundamentals driving longer-term levels and psychological factors causing short-term support and resistance.
Think about the low of the Covid-19 crash; that level is much more significant than the low of last week.
The Bottom Line
Support and resistance are critical elements of technical analysis. Support and resistance levels are caused by fundamental and technical reasons, usually due to institutional activity. There are multiple ways to draw support and resistance areas and trade using them.
Understanding support and resistance levels can help increase your returns and limit your downside, so it’s essential to understand them fully.