Trend following or trend trading is a systematic trading style that attempts to profit from trends in the market. Trend following buys when an asset’s price rises and goes short when an asset’s price falls. Trend following is ideal for those who prefer a systematic diversified approach to trading.
This post will review the theory behind trend following, look at a few of the most successful trend following traders, and discuss some of the most popular indicators and strategies used in trend following.
What is Trend Following?
We’ll begin by covering the fundamental aspects of trend following.
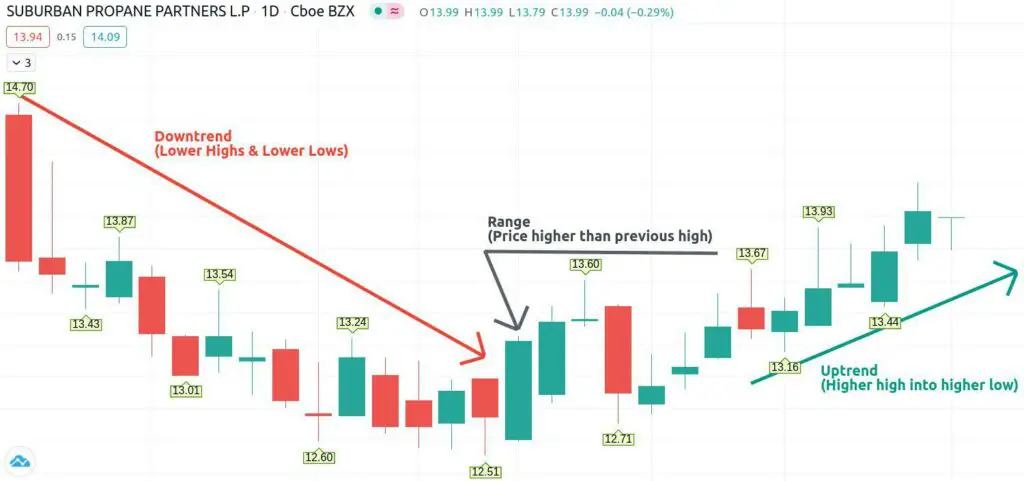
Trend following, or trend trading, attempts to find and profit from market trends. A trend refers to a security or asset’s movement in a particular direction, either up or down. Trends fall into one of two major categories – uptrends and downtrends. The technical definition of an uptrend occurs when an asset’s price establishes consecutive higher high pivots and higher low pivots during a period. A downtrend is the opposite – an asset’s price reaches lower low pivots and lower high pivots. Anything else is a range.
Once a trend is established, a trader then attempts to profit from the trend. This is where trend following may follow many different paths since there are many ways to profit from a trend. The two most straightforward options are taking a long position for an uptrend and placing a short position for a downtrend. Trend following may also include short-term, intermediate-term, and long-term trading strategies.
Successful Trend Following Traders
How successful is trend following? Of course, it depends on the trader and the strategy used, but some of the most successful traders in history have been trend followers. Before we dive deeper into trend following, let’s quickly examine the history of trend following and some of its most successful traders.
Jesse Livermore
Jesse Livermore is considered the father of trend following. Though less well-known today, he was one of the all-time greatest traders. In 1929, he was worth about 100 million. In today’s dollars, that’s about 1.5 billion. One of Livermore’s trading career’s most impressive aspects was that he only ever traded his own money. Though Livermore’s methods, which included tracking prices in a ledger, would look rudimentary compared to today’s computer-based trend following, he successfully tracked price patterns, making him a clear trend following trader.
Ed Seykota
One of the most notable trend following traders may be Ed Seykota. Seykota turned five thousand into 15 million over his career. Seykota put together a money management track record with returns of roughly +60% net of fees over the three-decade span of his trading career.
Ed provides his trading tenets in an amusing song shown below.
Michael Marcos
The success of the [turtle trading experiment/turtle-trading) led to an increased interest in trend following. Michael Marcos was one of the most successful trend-following traders and even learned from Seykota. Though Marcus had a rocky start in trading, once he began trend following, he went on to have an incredibly successful career, turning thirty thousand into 80 million.
David Harding
A more recent example of a successful trend-following trader is David Harding. In 1997, Harding founded Winton Group, a hedge fund firm. The firm began with 2 million, but as of September 2020, it manages 20 billion and employs hundreds of people. According to Forbes, Harding has a net worth of 1.3 billion.
This is only a tiny sample of the traders who have made their fortunes through trend following. Still, it does highlight the timeless aspect of this trading strategy and its potential to provide lucrative returns.
The Key Components of Trend Following
Trend following identifies trends with indicators and manages risk with strict position sizing rules. Every trend following strategy has its unique indicators to identify trends of various duration. These indicators can help the trader decide when to enter a position and exit a position. Let’s look at why trend followers use these indicators and how they help them make these decisions.
Spotting Trends and Entering a Position
Entering a position is when you either purchase or short a security. When you engage in trend trading, entering a position means you believe you’ve identified a potentially profitable trend.
This sounds simple enough, but tracking trends is complex. A trend is usually fairly obvious in hindsight, but spotting trends as they’re happening is much more challenging.
For example, maybe a stock’s price has increased steadily over the last two weeks. Is this a fluke or a trend? If it is a trend, will it continue? If it does continue, for how long will it continue? And this is a relatively simple scenario – a stock trending upwards. It can become even more complicated once you begin working on more complex strategies with multiple durations and rules.
With so many potential trades, how can a trader possibly decide when a trend occurs and make a profitable trade accordingly? A trader could attempt to watch the market and guess what will happen next or go with a “gut feeling,” but this is challenging. This dilemma is where the indicators come in.
Instead of basing decisions on guesses or assumptions, trend-following traders use their indicators to help them spot trends and decide when to enter and exit a position. Later in this post, we’ll look at some of the most popular indicators and how they help traders locate and profit from trends.
Exiting a Position
A trader uses indicators to spot a trend and decide when to enter a position, but this is not the only time when traders must rely on indicators. Traders also use indicators to help them decide when to exit a position.
There are two reasons why a trader would exit a strategy. The first is to make a profit, and the second is to avoid further losses. Both are vital aspects of a successful trend-following strategy.
We’ll first look at take-profit exit strategies. The biggest issue is timing. If you exit too soon, you may miss out on earning a larger profit, but you may make less profit than you should or even take a loss if you exit too late. The goal of take-profit indicators is to have you close the position once a trend is no longer intact with profit in hand.
Even the best strategy won’t work every time. It can be incredibly challenging to know when to exit when that happens. Once traders begin to lose money, they often become determined to stick it out and make up their losses or become too nervous and exit a strategy at the first sign of a potential reversal.
These responses make sense, but both rely on emotions instead of data. Systematic trend following traders exit when the trend runs out and place stop losses on every trade to limit trade risk — more on this later.
How to Detect Trend Changes
We’ve talked about the two critical aspects of trading – entering and exiting a position. Still, there’s a third component of trend trading, and that’s when to detect a strategy that needs updating.
Not all strategies include this aspect of trend trading, but it’s just as important to keep in mind as entering and exiting a position. A specific strategy using certain indicators may work for a while – months, years, maybe even decades, but eventually, almost all strategies become obsolete.
Why is this? All strategies attempt to take advantage of specific market patterns, but patterns in the markets are not set. The markets evolve, and this evolution requires traders to remain flexible.
Even if the markets’ evolution was not to impact a trading strategy, the fact that it’s an effective strategy would. The more effective a strategy, the more likely other traders, will discover it and use it. At first, this may be fine, but if enough people begin using the strategy over time, it may impact its effectiveness by influencing the trend itself. You are no longer ahead of the trend; you’re in the same position as everyone else, which erodes or even eliminates your ability to make a profit.
Detecting when a strategy is becoming less effective is one of the most challenging aspects of trend following, but failing to consider it has led plenty of great traders astray as they cling to a strategy that is no longer relevant. Anyone who wants to be a trend-following trader should periodically review the effectiveness of their strategy to determine if the strategy or indicators need updating.
Trend Following Indicators
If trend following appeals to you, the first things you’ll need to decide on are the indicators and strategies you’ll use. The indicator is the tool, and the strategy is the application of one or multiple indicators and position rules.
Indicators are at the heart of trend following. As we’ve seen, technical indicators allow traders to make data-based decisions instead of letting their emotions or “gut feelings” decide the fate of their trades. The number of potential indicators and strategies traders could use is practically limitless, but we’ll go over some of the most popular.
While technical indicators are critical to a trend following strategy, it’s also important to note that alone they will not lead to a successful trading career. Traders must understand risk management and trading psychology and periodically check to ensure their trading strategy is still sound.
Moving Averages
Moving averages is one of the most popular and straightforward technical indicators. A moving average is the average price of a security for a period. The time the moving average covers can vary considerably depending on the trader and the strategy. Long-term trend followers may use moving averages of the past 50, 100, or even 200 days, while traders focused on a more short-term strategy may use averages from days, hours, or even minutes.
Regardless of the period used to create the moving average, how the moving average data can be used to find trends remain relatively similar.
Prices of securities are volatile, making it harder to see trends. The moving average creates a smooth line of price data, limiting the impact of price fluctuations that occur randomly. There are a few different ways to use this smoothed line of price data to inform trend following decisions.
First, moving average price data can help traders distinguish between a ranging and trending market. Ranging is when the range between the security’s high and low prices for the given period may vary considerably, but the overall average is relatively consistent. When the moving average shows a mostly horizontal line, this means that the security is ranging. Alternatively, if the moving average is rising, this signifies an uptrend, and if the moving average is falling, this indicates a downtrend.
Another way traders may use moving average data is in a crossovers strategy. Crossovers may use two different moving averages, for example, 100 days and 25 days. When the smaller moving average crosses above the larger moving average (when the 25-day crosses over the 100-day ), a buy signal occurs. When the shorter moving average crosses below the larger moving average, this can be used as a sell signal.
You can also use the security price for crossovers, in which case, when the price crosses the moving average (either rising above it or dropping below it), you have your buy signal and sell signal. One of the problems with this approach is that when the price of a security is highly volatile, shorter duration crossovers using price can cause a lot of whipsaws.
Moving Average Convergence Divergence (MACD)
The Moving Average Convergence Divergence (MACD) indicator uses two moving averages and looks at their relationship.
Calculating the MACD
To calculate the MACD, you subtract a 26-period Exponential Moving Average (EMA) from a 12-period EMA. The Exponential Moving Average is a moving average that gives greater weight to more recent price data. More recent data has a more considerable impact on this indicator, unlike a typical simple moving average.
The MACD Histogram represents the difference between the MACD and its nine-day EMA, also called the signal line. The histogram grows more significant as the speed of the movement accelerates.
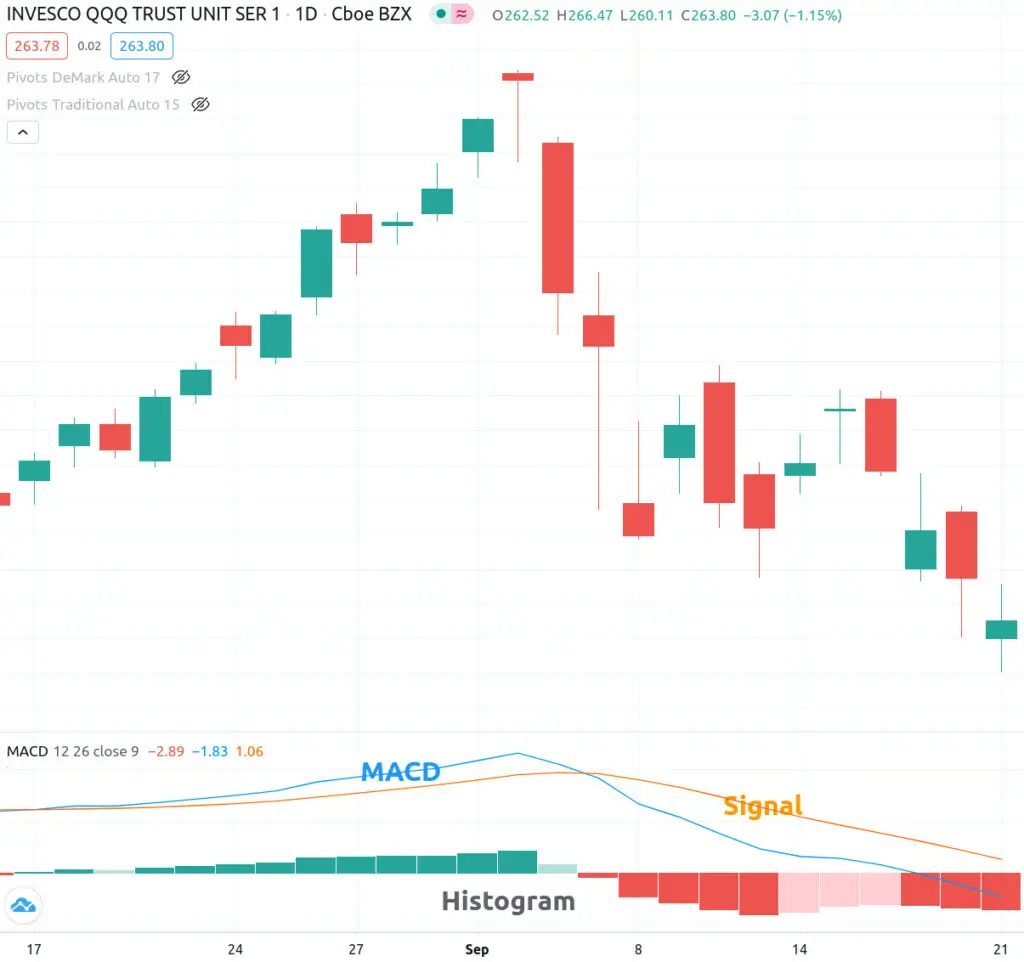
The shorter-term EMA (12-period) converges towards and diverges away from the longer-term EMA (26-period). The MACD is an oscillating indicator. This means the MACD oscillates around zero. When the 12-period EMA is greater than the 26-period EMA, the value of the MACD is positive. When the 12-period EMA is less than the 26-period EMA, the MACD value is negative.
Trading the MACD
Similar to some of the strategies used with moving averages mentioned above, MACD also relies on crossovers. When MACD crosses zero, moving upwards, the indicator is considered bullish. When the MACD crosses below zero, the indicator is bearish.
Additionally, it’s considered bullish when the MACD crosses above the signal line. And when the MACD crosses below the signal line, it’s deemed to be bearish.
Relative Strength Index (RSI)
Like the Moving Average Convergence Divergence indicator, the Relative Strength Index (RSI) is also an oscillating indicator. The goal of the RSI indicator is to predict if a security is currently overbought or oversold. RSI is conveyed as a number between 0 and 100, which measures the magnitude of recent changes in a security price.
If the RSI reaches or exceeds 70, the security is considered overbought. The same is true in the other direction. If the RSI drops to or below 30, it is oversold.
Calculating the RSI
There are four steps when calculating the RSI. We’ll stick with conventional 14-period RSI. These periods could be longer in duration, such as monthly periods, or even as short as five-minute periods.
In the first step, we calculate the bar-to-bar changes of each close.
change = close_n – close_n-1
Next, we have to smooth our price changes. We’ll use a simple moving average or SMA; however, exponential and Wilder’s Smoothing Method are other popular methods.
If we have 14 periods, where eight of the changes are up 2%, and six are down 1%, occurring in any order, the AvgUp and AvgDown would be:
AvgUp =(2+2+2+2+2+2+2+2)/14 = 1.14
AvgDown = (1+1+1+1+1+1)/14 = 0.43
Step three is to calculate the relative strength (RS).
RS = AvgUp/AvgDown = 1.14/0.43 = 2.65
Our final step converts the RS, which theoretically could be infinity, into an oscillator between 1 and 100:
RSI = 100 – (100/1 + RS) ) = 100 – ( (100/(1 + 2.65)) = 72.6
An RSI of 72.6 would put us into oversold territory.
Trading the RSI
The RSI is one of my favorite indicators for shorter periods — especially when combined with volume and multiple timeframe analysis, also known as an RSI stack.
Chart Patterns
While not typically considered a trend-following indicator, chart patterns can be used to determine entry and exit points. I’ve discussed how to identify chart patterns algorithmically.
Chart patterns do contribute to alpha, as seen below.
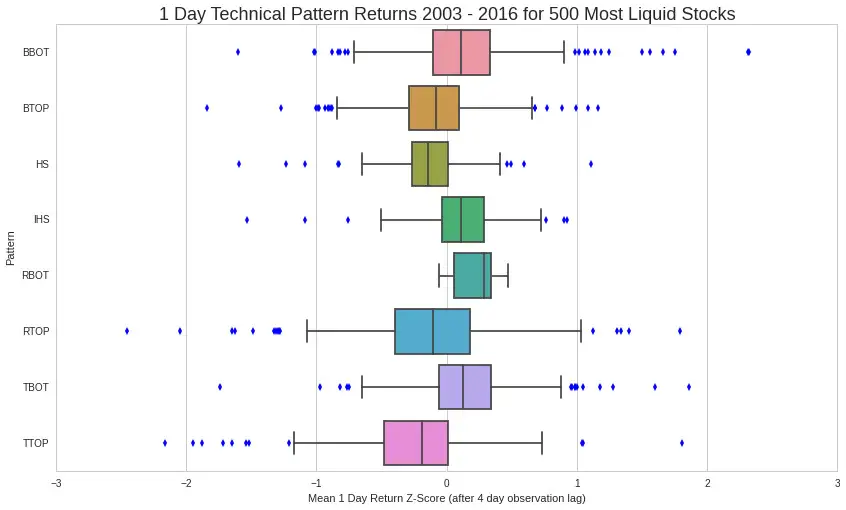
Remember, when we’re not just looking at price when we’re analyzing charts, we’re looking at the buying and selling pressure intertwined with human psychology. Exploiting human psychology is one of the best ways to become a profitable technical trader.
Position Sizing & Risk Management
Position sizing and risk management strategies tell you how much you should risk throughout a trade, and it has a massive impact on how a trading system will perform. With large positions can come more significant rewards — but if your position sizing is too aggressive, you can run the risk of ruin.
Van Tharp states that 91% of the return difference comes from position sizing. While I’m not 100% sure I agree with him that position sizing alone can beat a random entry, I agree with the basic principle that position sizing is one of the essential elements of a trading system.
There are three elements to consider when analyzing position size:
- Account risk
- Trade risk
- Position size
Account Risk
Account risk is the total amount of capital a trader is willing to put at risk as a percentage of the portfolio. Traders generally should not risk more than 2% of their capital in one trade, and most traders generally only risk 1%. Using 1% of a 100,000 portfolio value would give us an account risk of 1,000.
AccountRisk = PortfolioValue _ 1% = $100,000 _ 1% = $1,000
With the amount of our account we’re willing to risk per trade, we can now determine trade risk.
Trade Risk
The trade risk is the distance between the purchase price and the stop loss. If a trader purchases a stock for 100 and places a stop loss at 90, there is 10 trade risk. Knowing that we’re going to risk 1,000 per trade, we should buy 100 shares.
TradeRisk = Purchase – StopLoss = $100 – $90 = $10
Shares = AccountRisk \div TradeRisk = $1,000 \div $10 = 100
Position sizing and risk-management can and should get much more sophisticated.
Positions can be inversely weighted based on the volatility of individual securities; they can be weighted relative to an entire portfolio’s movement to minimize volatility. They can even be run through machine learning algorithms to determine optimal weighting by grouping classes of assets.
In other words, position sizing is an incredibly complex topic; however, most of the benefits can be gained by always managing your risks using stops, never exceeding your predetermined level of account risk, and always following your rules.
The Best Trend Following Resources
There are a ton of great trend-following resources available. I’ve listed a few below:
- The Complete Turtle Trader Systematic Trading System
- Stocks on the Move by Andreas Clenow
- Trend Following by Michael Covel.
- Top Traders Unplugged Podcast
The Bottom Line
Systematic trading strategies eliminate many behavioral mistakes that cause traditional traders to be unprofitable.
Introducing systematic rules and principles took my trading profitability and Sharpe ratio to the next level.