The stochastic oscillator is a technical analysis momentum indicator used by traders to determine momentum based on a particular asset’s price history. It shows the close relative to the high-low range across several periods.
What Is the Stochastic Oscillator?
An oscillator is a tool that creates high and low bands in between two extreme values, with an indicator that fluctuates inside these bounds to determine the trend.
One such tool is the stochastic oscillator, a momentum indicator used by technical analysts to determine momentum based on a particular asset’s price history.
It shows the close relative to the high-low range across several periods. The indicator moves between 0 and 100 to indicate the momentum of the security.
What Does the Stochastic Oscillator Tell You?
According to its creator, the stochastic oscillator does not follow price, volume, or anything like that. Instead, it follows the momentum or speed of price. It’s a technical analysis momentum indicator.
It’s a general belief that momentum tends to change direction before price. This allows traders to use the stochastics to be ahead of price changes.
The stochastic indicator can also help you identify bull and bear setups in anticipation of a future reversal. Since the stochastic oscillator is range-bound, it’s beneficial for generating overbought and oversold signals.
How Does a Stochastic Indicator Work?
This indicator works to help you identify market trends by presenting two lines that move or “oscillate” within a horizontal range.
On the indicator, price is “overbought” when the two lines are above the upper horizontal line. Conversely, the price is “oversold” once the two moving lines break below the lower line.
The overbought line shows price levels within the top 80% of the most recent price range (that is, high-low) across a defined period, usually 14 by default on all timeframes.
Similarly, the oversold line depicts price levels that fit within the bottom 20% of recent price movements.
The period is set to 14 so that there is a large enough data sample to give a meaningful calculation but short enough so that it’s responsive to changes. You can modify the lookback period on your trading platform to adjust the stochastic oscillator’s responsiveness.
The image below shows the stochastic oscillator (default setting) on a price chart. The arrow points to an example of an overbought price level.
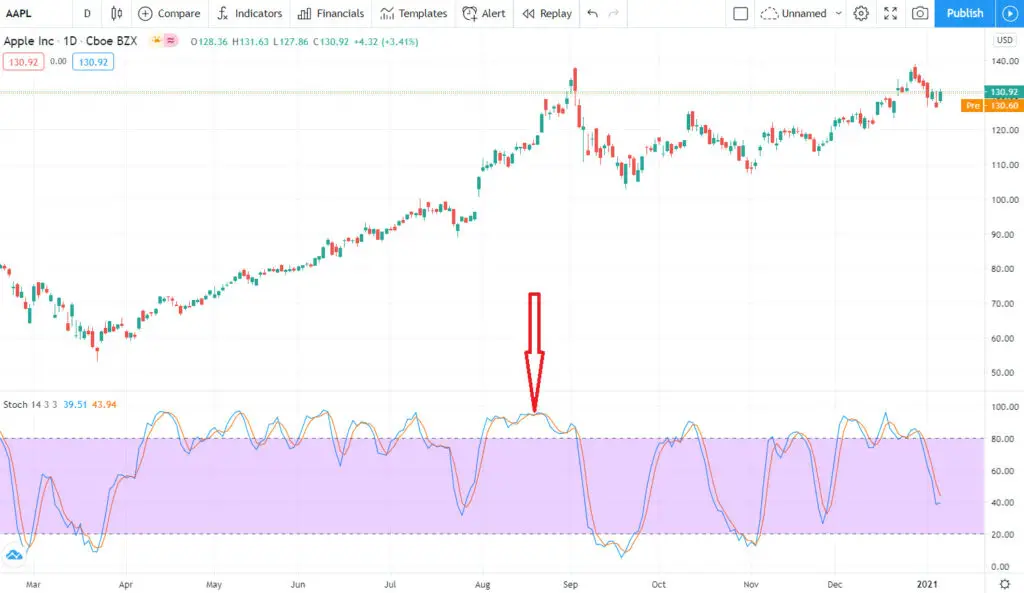
A stochastic reading is a percentage expression of a security’s trading range within a given period.
A reading of 100 indicates the highest peak during that designated time, while 0 indicates the lowest point of the current trading range. 50 is the mid-point between the two extremes.
The stochastic oscillator uses this scale to measure the degree of change in closing prices to predict whether the current direction trend will continue.
The calculations are based on the following premise:
- In an uptrend, prices typically remain equal to or higher than the previous closing price.
- Likewise, in a market downtrend, the price will likely remain equal to or lower than the preceding period’s closing price.
What Is K and D in Stochastic?
In the image below, the blue line is the fast stochastic %K line. The red line signal line is a 3-period moving average of %K, referred to as the slow stochastic %D line.
Slow Stochastic Oscillator vs. Fast Stochastic Oscillator
The main difference between the slow stochastic oscillator (%K) and the fast stochastic oscillator (%D) comes from each line’s sensitivity level.
The slow stochastic is less sensitive to price movement changes, while the fast stochastic oscillator line responds quickly to the underlying security price changes.
This difference is what creates transaction signals for traders.
Some traders find the fast stochastic oscillator a little too quick to respond to changes in price, which ultimately leads to the problem of being taken out of trades prematurely. The slow stochastic helps mitigate this problem by applying a three-period MA to the faster moving line.
In short, the difference between the slow stochastic and fast stochastic indicators can be analogous to the difference between a sports car and a limousine.
The sports car (fast stochastic oscillator) is fast and can change direction quickly when the price changes. On the other hand, the limousine (slow stochastic) is slower to alter direction, but it offers a much smoother ride.
Stochastic Oscillator Calculation
Trading platforms use the following stochastic oscillator formula.
- %K = (Last Closing Price – Lowest Price) / (Highest Price – Lowest Price) x 100
- %D = average of previous 3 values of %K or 3-period simple moving average
Based on these calculations, the 14-period %K would utilize the highest high and the lowest low, and the most recent close. The %D line, a 3-day simple moving average (SMA) of %K, would be plotted alongside to act as a trigger or signal line.
Although the calculations above are for a 14-period stochastic oscillator, traders can use any period.
What Are the Best Settings for Stochastic?
By default, the stochastic oscillator settings are set to 14,3,3 to provide signals, as depicted in the image below:
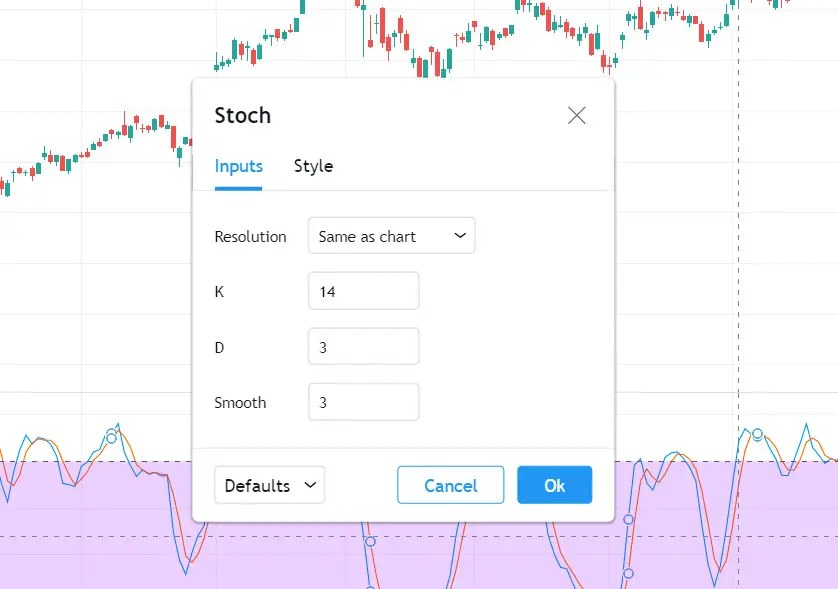
The default settings work well for most trading strategies, but traders should reduce the period for higher-frequency strategies.
80 and 20 are the most commonly used levels, but these can also be modified according to different needs.
Although many articles on the stochastic oscillator explore the process of tweaking the stochastic oscillator, beginner investors should only focus on the basics of this technical analysis momentum indicator in their trading.
Some traders try to lessen the tendency of the momentum indicator to give false signals by changing the readings to more extreme levels, such as 85/15 (instead of 80/20) as the demarcation lines to indicate overbought and oversold market conditions.
They then interpret the above 85 to indicate overbought conditions, and those below 15 suggest oversold conditions.
Although such adjustments could reduce the number of false signals, they may also result in traders missing out on many trading opportunities.
What Are the Advantages of the Stochastic Oscillator?
As with most other technical analysis trading tools, this momentum indicator has its unique benefits and drawbacks. It’s important to understand where the stochastic oscillator excels and where it falls short to get the most out of its use.
Below, we take a look at a few advantages of the stochastic oscillator:
- The stochastic oscillator provides easy-to-use entry and exit signals.
- Depending on the time setting selected, the stochastic oscillator offers frequent signals, which are beneficial for day traders and scalpers.
- The strategy of identifying crossovers in overbought or oversold areas has the advantage of helping traders jump into trades earlier to ride the move from its earliest point and get maximum gains.
- The indicator is conceptually easy to understand and is available on most charting packages.
What Are the Disadvantages of the Stochastic Oscillator?
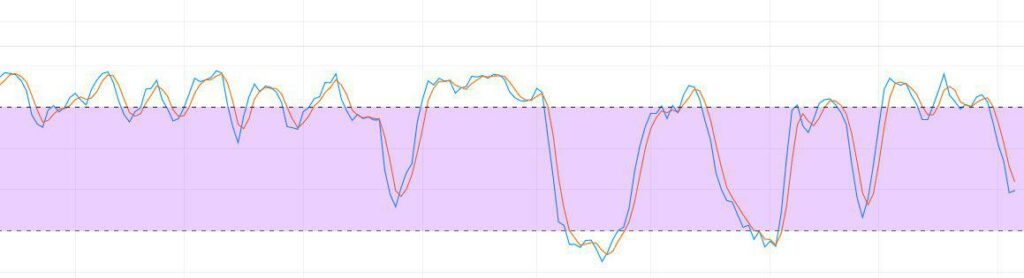
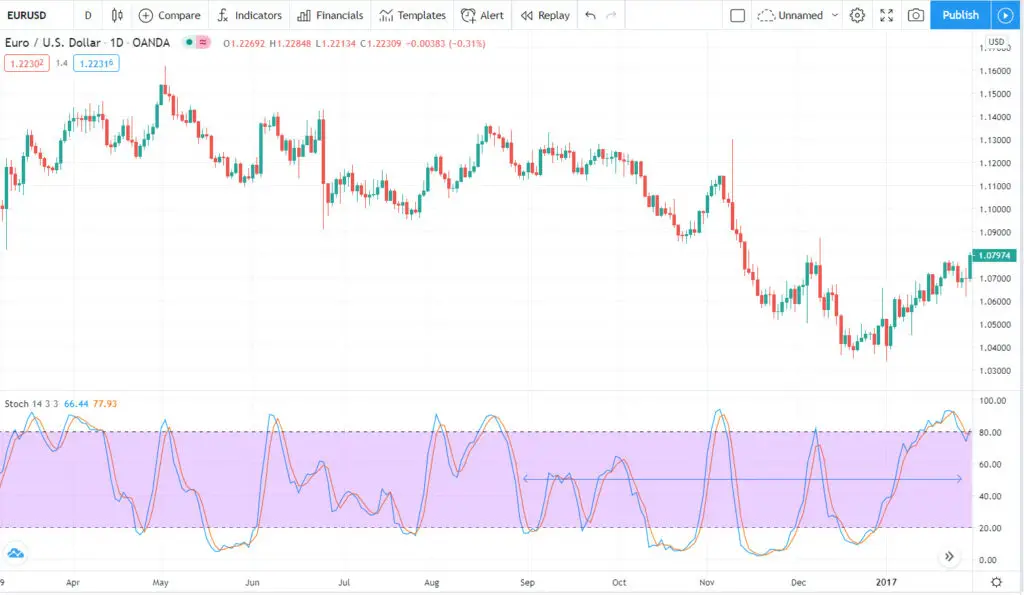
One of the stochastic oscillator’s significant shortcomings is producing false entry and exit signals when used in a highly volatile price range. This is why it’s necessary to confirm stochastic trading signals with other technical analysis indicators. Another major disadvantage of using the stochastic oscillator to time entries and exits is that price can stay in the overbought or oversold area for a long time, making crossovers useless until the indicator breaks and moves past the 80 or 20.
The image below is an example of how price can remain in the OB/OS zone for a long time:
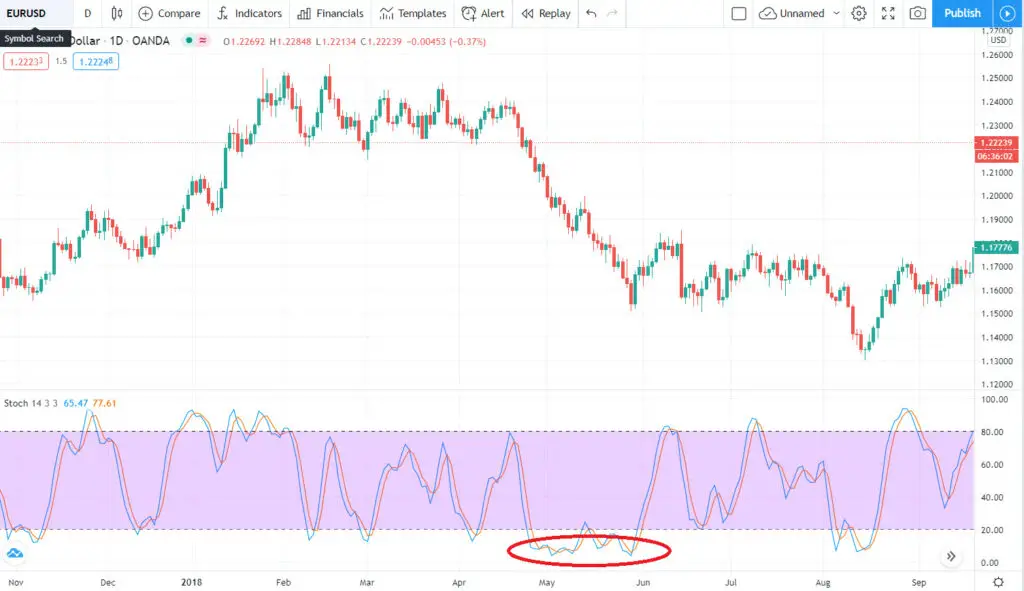
It’s essential to keep in mind that the stochastic oscillator is a momentum indicator that shows recent price action movement is in any given market and not the direction or trend.
You need other technical analysis tools to help you determine the direction of the trend so you can take higher-probability trades.
Stochastic Oscillator vs. Stochastic Momentum Index
The stochastic momentum index (SMI) is based on the stochastic oscillator, and both tools are used to determine momentum in the market.
The main difference is that the stochastic oscillator is a more straightforward technical analysis tool that shows the directional momentum based on an asset’s closing price.
The SMI, on the other hand, shows the closing momentum relative to the median high or low range for a particular period.
Stochastic Oscillator vs. RSI
The stochastic oscillator and relative strength index (RSI) are both price momentum tools used to forecast price trends in the market.
The main difference is that while the stochastic indicator uses the current and previous highest and lowest closing prices to determine price momentum, the RSI uses all closing prices to track overbought and oversold levels.
Although they have different calculations, both tools are popular, reputable technical analysis indicators with similar objectives.
How to Use the Stochastic Oscillator
Traders generally use the stochastic indicator in three ways:
- Overbought and oversold levels
- Divergence
- Crossovers
Below, we will take a closer look at each of these so you can better understand how to leverage this powerful indicator in your trading.
Overbought and Oversold Levels
Overbought and oversold conditions mean that the security price is near the top of its trading range and potentially overbought or near the bottom and possibly oversold in any specified period. These overextended levels enable savvy traders to buy or sell the trading ranges.
The stochastic reading for a possible overbought market condition occurs when it’s above 80. When this happens, a sell signal is generated once the oscillator reading returns below 80.
The stochastic oversold level is below 20. A buy signal is generated when the oscillator first breaks below 20 and then moves back above 20.
Stochastic Divergence
Divergence occurs when a security price makes a new high or a new low, not reflected by the stochastic indicator. This can signal either a bullish or bearish movement in price.
Bullish Divergence
A bullish or positive divergence occurs when the market price moves to a new low, but the stochastic indicator increases. This is an indication of a possible upcoming trend reversal to the upside.
Bearish Divergence
Similarly, a bearish or negative divergence occurs when the indicator moves lower as the security moves higher instead of moving in alignment with the price action.
For example, if an asset’s price moves to a higher high but the stochastic oscillator moves lower, this would represent a bearish divergence, which could signal an upcoming market reversal from an uptrend into a downtrend.
In short, whenever an oscillator fails to reach a new high, in alignment with the current price action, this often indicates that the uptrend momentum is beginning to wane.
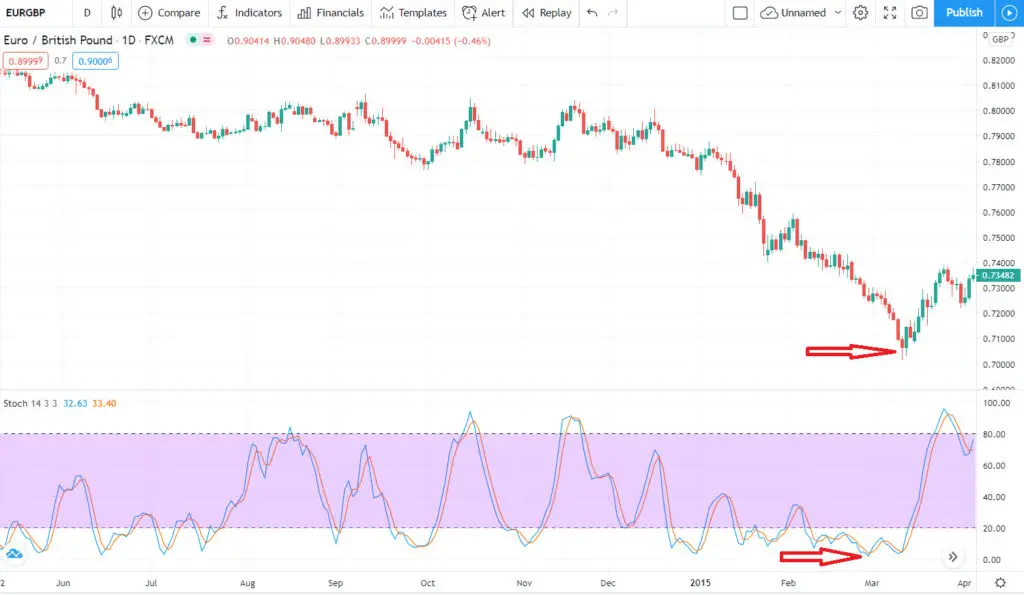
Divergences will almost always happen right after a sudden or sharp movement in price. It’s a cue that warns of a possible price reversal, and it’s typically confirmed using a trend line break, as in the bullish divergence example below:
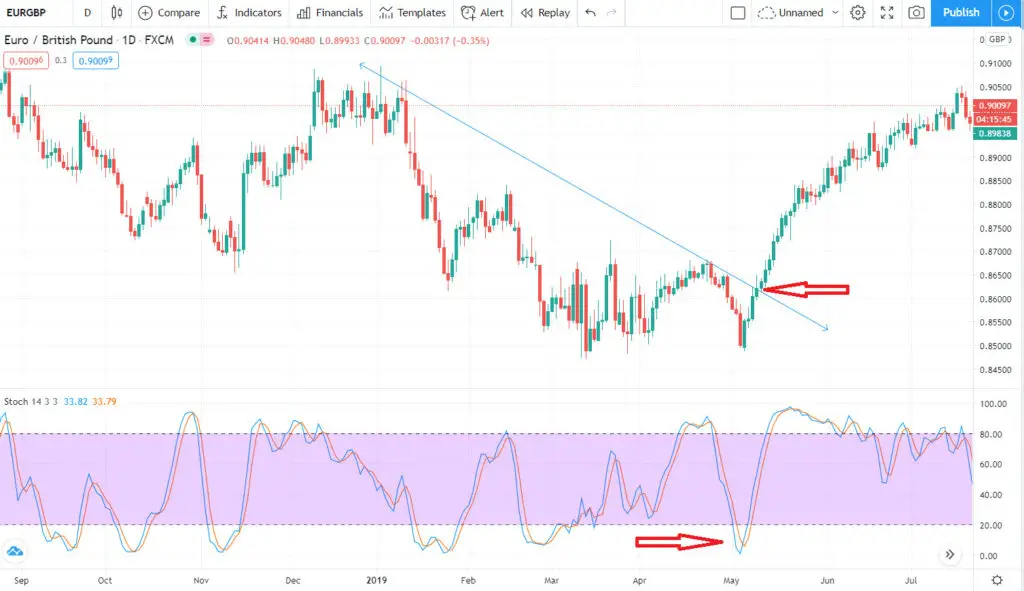
The red arrow at the bottom shows the bullish divergence in the image above as %K moves up while the price moves lower. The arrow at the top points to the confirmed break to the upside.
Always Look for Confirmation
Divergence alone should never be the reason to enter a trade. Whenever you’re acting on a signal from the stochastic indicator, always confirm with another technical analysis indicator.
You can use Bollinger bands to provide insight into the normal volatility of the asset. You can use other tools, which we’ll look at later in the article.
Once a divergence has taken hold, you should look for confirmation that signals the actual reversal.
You can confirm a bullish or bearish divergence with the support or resistance break.
You should note that the stochastic indicator may offer a divergence signal a while before price action changes direction.
For example, when the indicator gives a bearish divergence signal, the price may continue to move higher before reversing to the downside. Such situations are why it’s always prudent to confirm a market reversal before entering a trade.
Crossovers
The stochastic indicator is based on the premise that momentum precedes the price, and that’s why it’s useful in signaling the price movement before it happens.
A great way to get entry and exit signals from the stochastic oscillator is to use crossovers.
Crossovers in the overbought or oversold region occur when both lines in the stochastic indicator cross in either the overbought or oversold zone.
This image shows an example of a stochastic crossover:
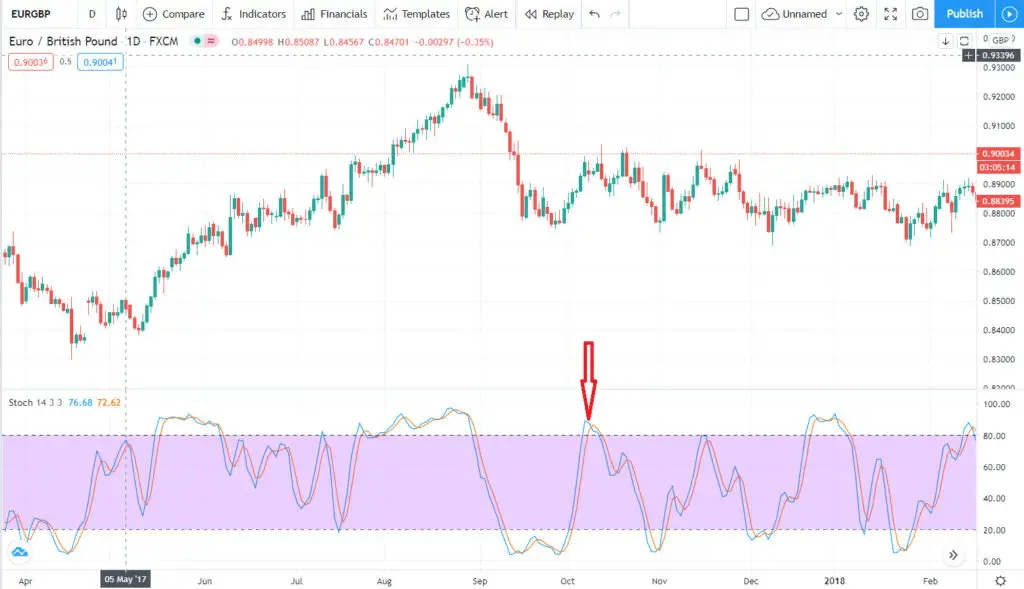
An overbought sell signal is generated when the oscillator moves higher than 80, and the blue line crosses the red line while still above the 80 level as in the image above.
Conversely, when the oscillator moves below 20, and the two indicator lines cross while still under the 20 level, this is an oversold buy signal.
Using the Stochastic With Other Tools
As previously mentioned, the stochastic indicator should never be used by itself. Combining it with other tools will give you more meaningful signals and improve your trades’ overall quality.
Here are three of the most effective tools that you can use in conjunction with the stochastic oscillator:
Moving Averages
A moving average is a great tool to use in conjunction with stochastics. It will act as a filter for your signals, as long as your trades are in the direction of the moving average. When the price is below the moving average, only look for shorts. If it’s above the moving average, only go for long trades.
Trendlines
Trendlines are great for use when trading stochastic divergence and reversal trades. Find an established trend with a valid trendline, and then wait until the price breaks the trendline when the stochastic indicator lines make a new high or low.
Chart Patterns
Chart patterns or price formations work well with stochastic oscillators to give you better trades. For instance, a breakout or reversal trader can look for rectangles, triangles, and wedges when the price breaks the formation with accelerating stochastic lines, a potential signal for a successful breakout.
Timing Entries
A stochastic indicator attempts to forecast price moment by analyzing momentum. And if momentum precedes price, it’s great for timing entries. Once both lines move above the 80 in the overbought zone, and the %K line crosses below the %D line, this is a possible entry signal for going short.
The opposite is true when the %K line and the %D line cross while in the oversold zone below the 20 level.
A word of caution when using the stochastic oscillator for entry signals:
Traders should not enter trades blindly based simply on OB/OS conditions alone. A deep understanding of the overall trend direction is required, and a system for filtering trades accordingly.
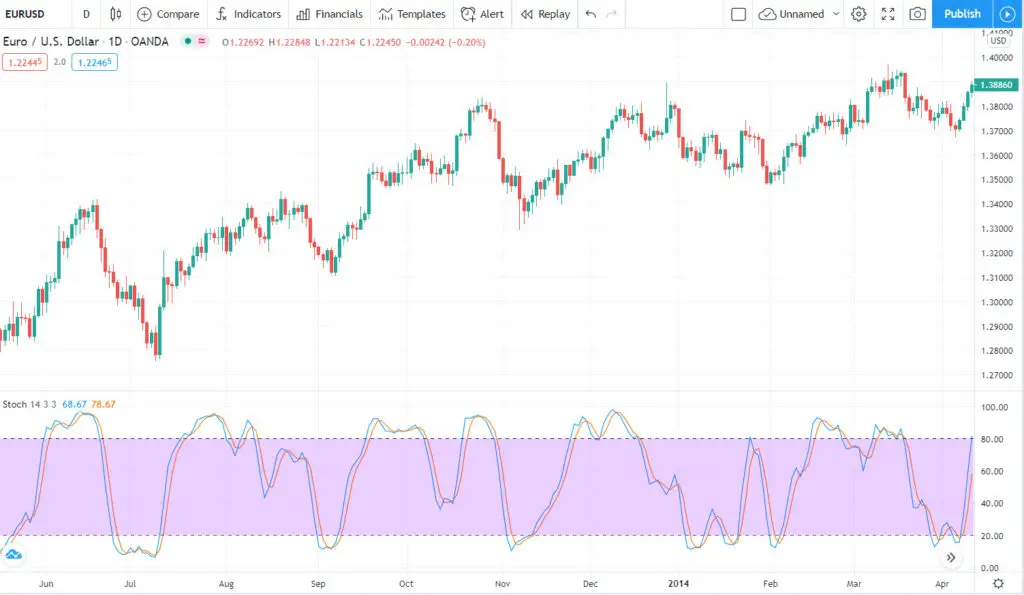
For instance, in the EURUSD chart below, the overall trend is up, which means traders should only look for buy entry signals at oversold levels if you believe in Dow Theory.

Once the trend reverses or a clear trading range is established, traders should look for short entries in overbought conditions.
Some day-trading and scalping systems use one stochastic line (the faster one, in most instances). However, this would not allow for detecting stochastic crossovers, which requires both lines, also known as a “Full stochastic”.
Some traders tend to pay close attention to crossovers at the 50 level (that is, when the %K line crosses the 50 line on the stochastic scale).
This stochastic 50-level crossover is viewed as a strong movement to the upside and interpreted as a buy signal. By contrast, when the %K line crosses below the 50 level, it’s interpreted as weakness in price movement, which signals that it’s time to sell.
The blue line in the image shows the 50 center line on the stochastic indicator:
Stochastic Oscillator for Intraday Trading
The stochastic oscillator can provide ample reliable signals, instrumental in the highly competitive intraday trading environment.
The 80 and 20 levels, together with a stochastic setting of 14, 3, and 3, are the most popular setting for intraday trading to provide overbought and oversold signals.
Higher time frames, such as the 1-hour and 4-hour, tend to provide better signals than lower time frames.
Stochastic Oscillator for Day Trading
Day traders often use the stochastic indicator for intra-day trading. Technical analysts use it to gauge the momentum of a particular asset based on its price history.
This tool is handy for trend-following when there are strong trends in the market and will help you get in on a trend early and stick with the trend for maximum profits.
Setting Up the Stochastic Oscillator in TradingView
Setting up the stochastic oscillator in TradingView is easy. The default setting is 14 periods, which can be any timeframe, ranging from months to minutes.
The default setting for the fast-moving line (%K) is the previous three %K average, while the default setting for the slow stochastic, or %D, is the three-day simple moving average of %K.
Most traders use these default settings for the stochastic oscillator, but you can tweak the settings to suit your trading style.
Additional Stochastic Indicator Tips to Enhance Your Trading
As you have seen, the stochastic is a technical analysis momentum indicator that can help you identify retracements and reversals so you can jump in on trades earlier.
If you’ve decided to use this indicator in your trading, here are a few tips to help you get the most out of it:
- Trend Following: For as long as the stochastic lines are crossed in one direction, it shows that the trend is still valid, and you can continue to look for trades in that direction.
- Strong Trends: Once the stochastic moves into the oversold or overbought zone, it’s a signal that you shouldn’t try to fight the trend but rather hold onto the trades that are in line with the trend.
- Breakout Trading: If the stochastic suddenly starts to accelerate in one direction, with the two stochastic lines widening, it could signal the beginning of a new trend. Keep a lookout for a break out of a sideways range on your charts, as this would make a great trade.
- Trend Reversals: If you see the stochastic changing direction and leave the overbought or oversold area, this can foreshadow a trend reversal. This signal is compelling if combined with a moving average or trend line.