The stochastic momentum index and the stochastic oscillator are technical analysis tools traders use to determine momentum in the market.
The stochastic oscillator is a simple indicator showing directional momentum based on its recent closing price. The stochastic momentum index or SMI is a variation of the traditional stochastic oscillator.
Some traders use both tools to determine market momentum and glean insights into the market’s psychological undercurrents. And while similar, there are some distinct differences between the two.
What Is the Stochastic Oscillator?
Oscillators are technical indicators that help traders determine the market trend and if it’s potentially overbought or oversold price action.
Common oscillators include
- MACD (Moving Average Convergence Divergence)
- RSI (Relative Strength Index)
- Stochastics
The indicators are oscillators because they move (oscillate) between two levels. Regardless of how far the price moves in either direction, the tool never moves outside of its set range between 0 and 100 for the stochastic oscillator.
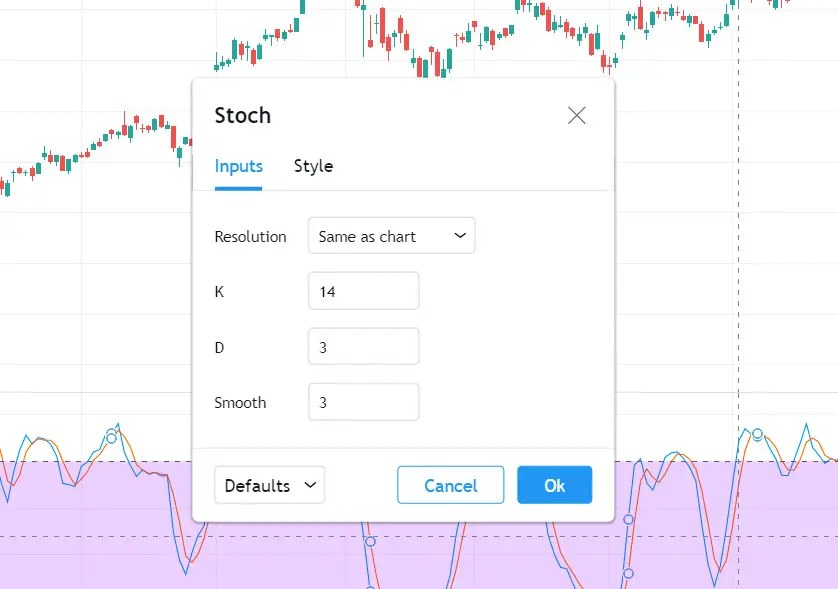
Stochastic Oscillator Settings
Created by George Lane, the stochastic oscillator uses inputs in its calculations that are slightly different from other oscillator indicators to give traders an indication of whether the market will continue moving in the same trend or reverse direction.
Two lines represent it on a chart:
- The %K line is the current closing price of an asset relative to the period’s high low range. The standard value for %K is 3.
- The %D line is the signal line. It’s a simple moving average (SMA) of the %K line. Its default setting is also 3, which means it’s a 3-period SMA of the %K value.
The most common setting for the stochastic oscillator is 14,3,3, with 14 being the look-back period.
How the Stochastic Oscillator Works
The stochastic oscillator compares the recent closing price to the range of its opening and closing prices across a specific period.
The assumption is that an asset’s closing price will be near the high in an uptrend and the low in a downtrend.
The stochastic indicator can work in both trending and ranging markets. It all comes down to interpreting the indicator readings between 0 and 100.
How to Use the Stochastic Oscillator
Traders typically consider a reading above 80 overbought, which means that security may soon reverse. A value lower than 20 is considered to be oversold, which would mean that price is potentially near a short-term bottom.
Traders use the stochastic oscillator to indicate signals in three ways:
- Overbought and oversold levels occur when a security trades beyond its expected range.
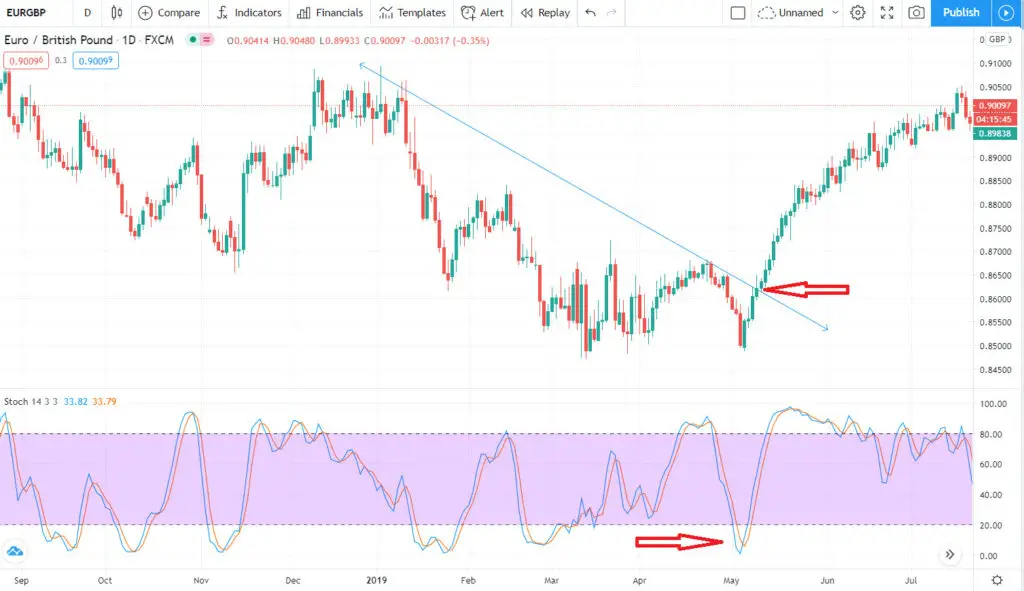
- Divergences or situations where the oscillator and price no longer move in the same direction can signal a reversal in the market’s price.
- Crossovers of the stochastic indicator lines help traders predict reversals, breakouts, and other trend changes.
Although many traders find this a handy indicator, it has a few drawbacks.
For instance, it can remain in the overbought or oversold range for a long time if there’s a strong market trend. This means that traders may see reversal signals long before the market reverses.
The stochastic oscillator is also a lagging indicator since it’s always a step behind what’s happening in the market.
What Is the Stochastic Momentum Index?
The stochastic momentum index, also known as the SMI, this indicator is an upgraded version of the traditional stochastic oscillator.
The main difference is that the stochastic oscillator formula calculates the close relative to the high low range. The SMI, on the other hand, formulates the close relative to the _median _of the high low range.

Momentum Index Settings
Often referred to as an overbought and oversold indicator, the SMI has two lines, %K and %D.
%K, which typically has a value of 5, is the fast stochastic line. It represents the main price movement. %D, conventionally set to 3, is a simple moving average of the %K, making it the slower signal line.
Many traders tend to stick to the indicator’s default settings when using the SMI to find trading opportunities.
How the Stochastic Momentum Indicator Works
The values of the stochastic momentum indicator also oscillate between +100 to -100.
The indicator is above zero when the current closing price is higher than the midpoint or median value of the high low range. Likewise, the indicator will show a negative value when the close is below the middle.
Traders and analysts interpret the SMI in much the same way as the stochastic oscillator.
If the indicator shows extreme values, it is considered a signal of overbought or oversold conditions. It is also used with volume indicators to determine whether the momentum has significant buying or selling pressure.
How to Use the Stochastic Momentum Index
Traders use this indicator in a variety of ways, including the following:
- To generate buy signals: When the indicator rises above the -50 level, it’s a trade signal.
- To generate sell signals: When the indicator falls below the +50 level, it generates another trade signal.
- To determine a general trend: Some traders interpret values over +40 as indicating a bullish trend and values below -40 to indicate a bearish trend.
- To indicate a false trend: Divergence in price can signal a false trend in the market.
- To signal the end of a trend: If the market continues to make higher highs, but the stochastic momentum index makes a series of lower highs, it could signal a bottom forming in the market.
Developed by William Blau, the SMI attempts to provide more reliable signals, and it’s less subject to false trends in the market.
However, since the SMI is faster than the stochastic oscillator, some traders and analysts increase the %K line periods to slow the indicator down.
For the most part, traders don’t increase the slow-moving %D line as it reduces the signal speed.
Stochastic Oscillator vs. Stochastic Momentum Index (SMI)
These technical analysis tools are similar in that they are both used for indicating momentum in the market. However, there are some very distinct differences between the two, making them well suited for different trading styles.
The stochastic oscillator is a much simpler tool that shows directional momentum according to the closing price of any given period in the market, such as a day, week, etc.
However, traders sometimes have problems with this indicator because of its sensitivity to the closing price, which can cause fluctuations.
Because of this, traders look for ways to smooth out the fluctuations in the stochastic oscillator by changing the bar period or altering the overall period or %D within the indicator’s settings.
On the other hand, the stochastic momentum index (SMI) is considered a more refined version of the stochastic oscillator and shows closing momentum relative to the median high low range of a particular period.
In contrast to the stochastic oscillator, the SMI uses more calculations to produce a median of the price movement range, which, in turn, creates a smoother view of the close relative to the price range.
Many traders consider this indicator a more reliable way to predict turning points in the market and choose it over the stochastic oscillator.
Some technical traders make use of both tools to determine market momentum. Although neither of the indicators is a surefire way of determining price direction, each of them can offer insights that help traders understand the market’s psychological undercurrents and their relation to the movement of price.
In other words, these technical analysis tools can help understand public opinion regarding any stock, ETF, or sector.
Other Considerations
The stochastic oscillator and stochastic momentum index each have their own benefits and drawbacks.
For instance, the stochastic oscillator provides a simple way to determine momentum in the market. However, it’s prone to sensitivity to fluctuations in price, causing false signals.
This happens when the indicator generates a trading signal, yet the price doesn’t follow through. This can result in a lot of losing trades, particularly during volatile conditions in the market, as in the image below:

One way to help mitigate this issue is to use the price trend as a filter and only take signals in the same direction as the general trend.
The same goes for the SMI indicator. It’s easy to use, helps traders identify potential shifts in price momentum, and offers clear signals for trend reversal and mean reversion trades.
However, its primary limitation is that for traders to get a good sense of where the market is heading, they need to use the SMI with a volume indicator to confirm momentum.
So, although this indicator has many benefits, it’s essential to understand its drawbacks before using it in your trading.
And remember, you can pair each of these indicators with other technical indicators, including the relative strength index (RSI), moving average convergence divergence (MACD), and more, to help confirm the signals you get from them.