In the high-stakes world of trading, one timeless weapon has the power to unlock untold riches: Japanese Candlestick Patterns. This ancient technique offers the key to deciphering the market’s subtle signals like a seasoned pro.
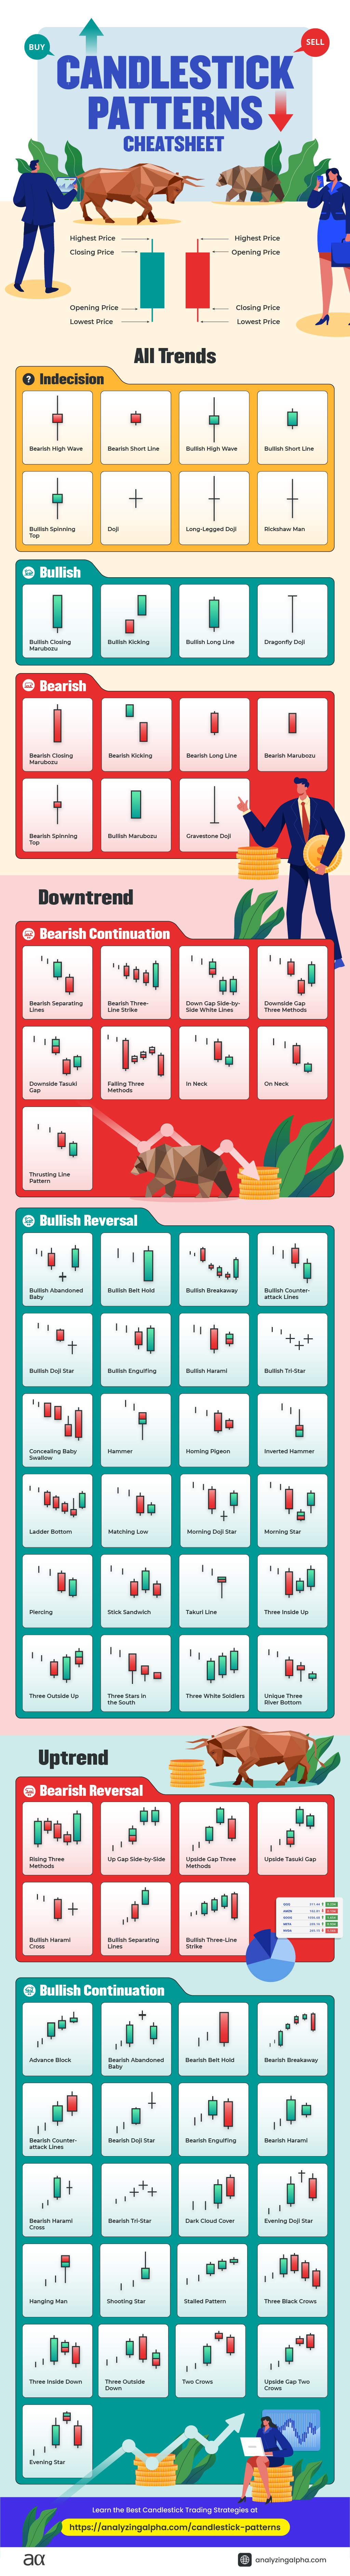
Our striking candlestick patterns cheat sheet infographic unveils the mightiest candlestick patterns, ensuring you’ll never overlook a golden trading opportunity. With a single glance at our cheat sheet, instantly master key signals like the identical three crows, three white soldiers, and bullish breakaways.
Pair this candlestick pattern cheat sheet with the best candlestick patterns for your market to become a candlestick samurai.
Time to revolutionize your trading game! Download the Candlestick Pattern Cheat Sheet PDF for Free!
Frequently Asked Questions
What are candlestick patterns?
Candlestick patterns are visual representations of price movements in financial markets, using individual “candles” to depict opening, closing, high, and low prices within a specific time frame. These patterns help traders identify trends and make informed decisions.
How do candlestick charts work?
Candlestick charts display price movements using candles, which represent open, close, high, and low prices in a time frame. Green (or white) candles show price increase, while red (or black) candles indicate decrease, aiding traders in identifying market trends.
What are the most common candlestick patterns?
The most common candlestick patterns in the last twenty years are one-bar patterns including the Doji, Bearish Long Line, Bullish Long Line, Bullish Closing Marubozu and Bearish Closing Marubozu.
How can I use candlestick patterns in my trading strategy?
Utilize candlestick patterns in your trading strategy by spotting them on charts, gauging their relevance to trends, and confirming entry/exit points. Complement them with other technical indicators for more effective decision-making.
What is the difference between candlestick charts and other types of charts?
Candlestick charts differ from other chart types, such as line and bar charts, in their visual representation of price data. They display open, high, low, and close prices in a single “candle,” making it easier to identify market trends, reversals, and patterns for informed trading decisions.
What are some resources for learning more about candlestick patterns?
For learning about candlestick patterns, explore Steve Nison’s books, Analyzing Alpha’s candlestick patterns backtests and YouTube channels like The Chart Guys. These resources help you master and apply candlestick patterns effectively.