The Stochastic RSI (Stoch RSI) is a technical analysis indicator derived from the standard RSI indicator. It identifies potential overbought and oversold conditions in the market and can assist with identifying current market trends.
What Is the Stochastic RSI?
The Stoch RSI is a popular momentum oscillator developed by Stanley Kroll and Tushar Chande. As suggested by its name, this indicator is a derivative of the relative strength index (RSI), making it an indicator of an indicator.
The Stoch RSI is an oscillator with movements that fluctuate within a set range (0 – 100). It measures the relative strength index (RSI) level relative to the high-low RSI range across a specified period.
Traders use the indicator in various contexts, including stock trading, forex trading, and cryptocurrency markets.
As described in Kroll and Chande’s book The New Technical Trader, the Stoch RSI is an indicator designed to generate more overbought and oversold signals than the relative strength index developed by Welles Wilder.
What Does the Stochastic RSI Tell You?
The StochRSI has characteristics similar to the vast majority of momentum oscillators. Traders use the StochRSI to help identify possible overbought and oversold conditions, with moves above 80 being considered overbought and those below 20 considered oversold.
Some technical analysts use the StochRSI for identifying short-term trends. As a range-bound oscillator, its centerline is at the 50-level. When consistently above 50, the indicator reflects an uptrend. Conversely, when the indicator is consistently below 50, it indicates a downtrend.
How Does a Stochastic RSI Work?
The StochRSI applies the stochastic formula to values from the relative strength index rather than the actual price values resulting in an oscillating value between zero and one-hundred.
It’s common to see a 3-day simple moving average (SMA) alongside the StochRSI line. This additional smoothed line serves as the signal line and attempts to help reduce false signals.
Unlike the traditional stochastic oscillator that factors in the asset’s closing price and the period’s high-low, the StochRSI only uses RSI values.
This makes it an indicator of an indicator and the second derivative of price. In other words, it’s two steps removed from the underlying closing prices that the stochastic oscillator uses.
This is why an asset’s StochRSI often looks vastly different from its price data.
What Is K and D in Stochastic RSI?
K and D are the variables in the stoch RSI oscillator. Referred to as %K and %D, these are represented on the indicator by two lines:
The %K line is the “fast” stochastic and refers to the number of RSI periods used in the stochastic calculation.
The %D line is the “slow” stochastic or “signal” line and is a moving average of %K.
Stochastic RSI Calculation
The stochastic RSI applies the stochastic formula to RSI indicator values. The Stoch RSI calculation is as follows:
Stochastic RSI = (Current RSI – Lowest RSI) / (Highest RSI – Lowest RSI)
Where:
RSI = Current relative strength index reading Lowest RSI = Lowest RSI reading for the previous 14 periods Max RSI = Highest RSI reading for the previous 14 periods
In other words:
- The 14-day Stochastic RSI equals 0 when the RSI is at its lowest point in 14 days.
- The 14-day Stochastic RSI equals 100 when the RSI is at its highest point in 14 days.
- The 14-day Stochastic RSI equals 50 if the RSI is midway through the 14-day high-low range.
- The 14-day Stochastic RSI equals 20 when RSI is at the lower end of the 14-day range.
- The 14-day Stochastic RSI equals 80 when RSI is at the higher end of the 14-day range.
What Are the Best Settings for Stochastic RSI?
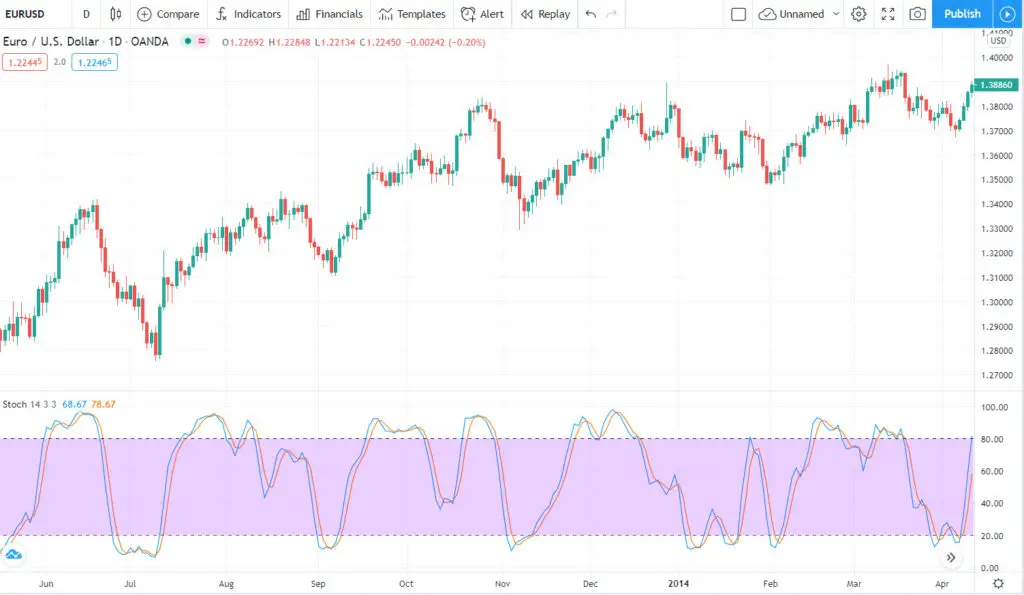
Like the traditional relative strength index, the Stoch RSI default settings are 14 periods and 80/20 for the overbought and oversold levels.
Default settings for the stochastic RSI in TradingView:

You can edit the settings to suit your unique trading style. You can also adjust individual colors for the indicator lines to suit your preferences by clicking on the various color patches next to the indicator in TradingView.

What Are the Advantages of the Stochastic RSI?
One of the Stoch RSI’s main advantages is its increased speed and sensitivity to market movements. Consequently, it produces a lot more signals than the traditional RSI.
Most technical analysts view it as a more reliable technical analysis tool for identifying market trends and potential buying and selling points in the market – both long-term and short-term.
What Are the Disadvantages of the Stochastic RSI
Compared to the regular RSI, the StochRSI is a more volatile indicator. Although it provides traders with more trading signals, it also generates many false signals.
As previously mentioned, one standard method for helping to reduce the risks associated with this is to use a 3-day simple moving average to smooth out the price fluctuations and reduce market noise.
The SMA is part of the stochastic RSI indicator’s default settings in most cases.
How To Use The Stochastic RSI
Traders use the StochRSI in three primary ways:
- To identify overbought/oversold conditions in the market.
- To determine the short-term trend.
- To discover potential trend reversal points in the market.
Below we look at the different ways you can use the stochastic RSI in your trading:
Overbought and Oversold Areas
Tushar Chande and Stanley Kroll, the indicator’s creators, suggest a setting of 80/20 for overbought and oversold signals rather than the traditional RSI values of 70/30.
According to them, the indicator can oscillate between overbought or oversold levels of 80 and 20 for long periods without reaching either of the two extreme levels.
This means traders looking to get in a trade based on overbought or oversold readings from the RSI indicator might find themselves on the sidelines for long periods.
Kroll and Chande developed the StochRSI to help increase sensitivity to generate more overbought and oversold signals.
So, for example, you can go long when the indicator falls below 20 (the oversold level) and then recovers above it, as indicated by the green arrow in the image below.
Traders take short trades when the stochastic RSI moves above 80 (the overbought level) and then crosses below, as shown by the red arrow.

When using this indicator, it’s crucial to remember that overbought or oversold doesn’t necessarily mean bearish or bullish. Instead, oversold conditions serve as a warning for traders to watch for a potential bounce.
As with most oscillators, the stochastic RSI can stay in the overbought and oversold regions for extended periods. When you see an overbought signal, it doesn’t always mean that the price will immediately reverse lower, just as the oversold signal doesn’t mean the price will instantly move higher.
Instead, these conditions alert you that the technical analysis indicator is near the extreme of its most recent readings.
Trend Identification
Although the StochRSI takes is significant when it’s near the extremes (that is, the upper and lower boundaries of the range), it can also help provide information regarding trends in the market.
For instance, when the 50 centerline acts as a sort of support for the stochastic RSI lines, and they move steadily above that level, it could suggest the continuation of an upward or bullish trend.
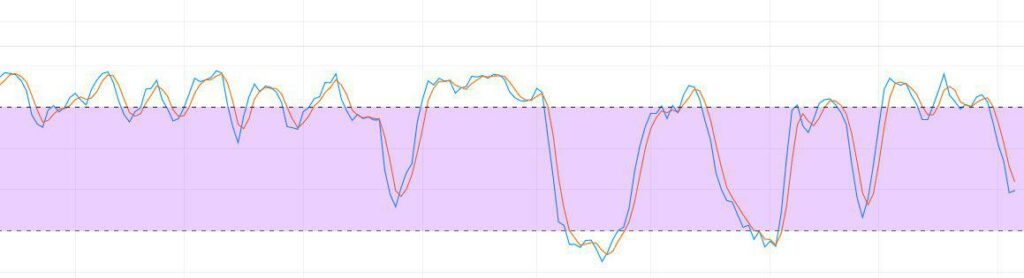
This is particularly true if the lines move toward the 80 level. Likewise, StochRSI readings consistently below the 50 level and trending down towards the 20 line are an indication of a bearish or downward trend, as indicated in the chart below:
Trend identification is crucial to success when trading using overbought and oversold levels. When the more significant trend is up, traders often look for oversold conditions to find buying opportunities.
The same goes for situations when the more significant trend is down, and they can identify selling opportunities in overbought areas.
In other words, this indicator helps them discover potential trades in the direction of the more significant trend and allows them to find ideal entries and exits.
Traders consider the 14-day StochRSI a short-term trend indicator, which means it’s crucial to look for medium-term trends when identifying overbought and oversold conditions.
When using the stochastic RSI for trend identification in the short term, some traders find that it helps to use a more extended calculation period and a short moving average, such as a 10-day SMA, to smooth out the data.
This would mean that momentum favors falling prices when the indicator’s 10-day SMA is below the 50 level (as an example) and rising prices when it’s above 50.
There will often be whipsaws when using a short moving average with the StochRSI for trend identification. For instance, when using a 5-day SMA with a 20-day StochRSI, you might experience a price consolidation during a trend that can cause the 5-day SMA of the stochastic RSI to gyrate above or below the 50 level before either reversing or continuing the trend.
Crosses
When the indicator crosses the 50 level, traders use it as a signal to enter into long or short trades, depending on which direction the signal line is moving.
In other words, when the StochRSI crosses above 50, it’s a possible buy signal, and when it falls below 50, it indicates a sell signal. If the underlying price moves to a new high or low that is not confirmed by the stochastic RSI, this is a divergence that can signal a price reversal.
Other Considerations
You can use the stochastic RSI for Intraday trading, and you can also use the stochastic RSI for day trading. No matter your trading style, it’s crucial to use the StochRSI with other technical analysis aspects for confirmation.
For instance, you can use support and resistance breaks, gaps, price patterns, etc., to confirm the signals you get from the StochRSI indicator.
You can also use complimentary technical analysis indicators, such as the Accumulation Distribution Line and the On Balance Volume (OBV), among many others. Volume-based technical analysis indicators don’t overlap with the stoch rsi and other momentum oscillators.
You can also experiment with various settings to discover this technical analysis indicator’s nuances before using it in your trading.
Setting Up the Stochastic RSI in TradingView
Like all technical analysis indicators, to set up the stochastic RSI in TradingView, go to the “Indicators” tab. Please search for the stochastic RSI, and once located, click on it to install it on your charts.

The settings will be 14 for the stochastic and RSI periods by default. The %K and %D lines will each be set to 3.
You can use the default settings, as most traders do, or tweak them to suit your particular trading style better. To change the inputs and styles, click on “Settings” to make the changes.