Moving Averages: Explained & Examined

Moving averages are a technical analysis tool that smooths price data over a specific period. This smoothed price line helps limit the impact of random, short-term market movements that make it harder for traders to spot trends. We will cover …

Read more

What Is a Tick Chart?

A tick chart draws a new bar after a set number of trades. A time-based chart creates a new bar after every period, such as one hour. Tick charts offer many benefits over time-based charts for higher-frequency traders. This post …

Read more

Support and Resistance: Fully Explained

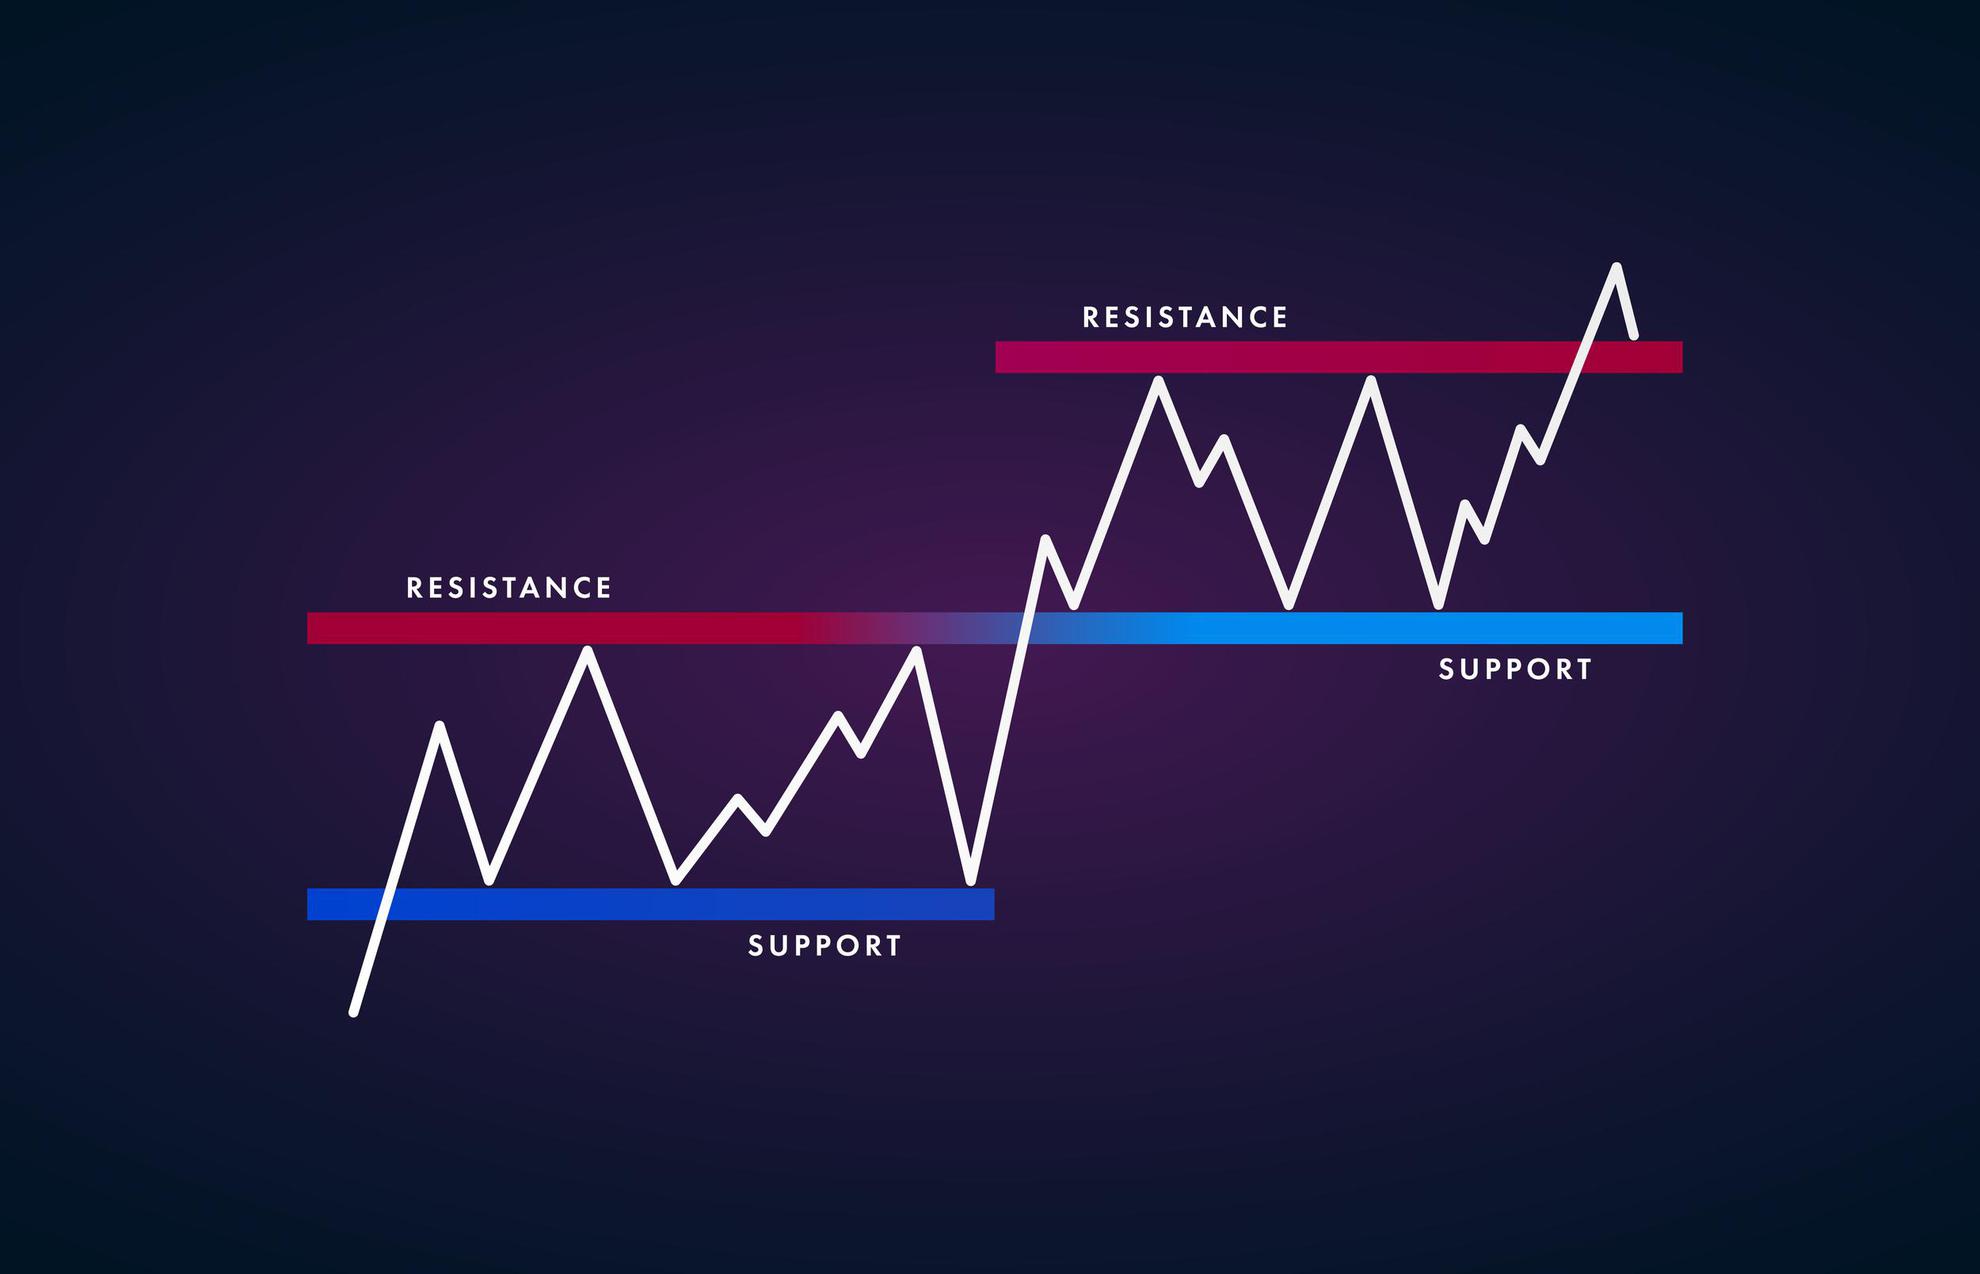
Support and resistance lines are technical analysis tools predicting where an asset’s price will tend to stop and reverse. Without breaking through, multiple touches of the resistance area, often accompanied by high volume, denote these levels. The concept of support …

Read more

Relative Strength Index (RSI): An Ultimate Guide

The relative strength index (RSI) is a technical analysis momentum oscillator that indicates potentially overbought and oversold conditions based on an asset’s recent closing price changes over a trading period. The RSI oscillates between zero and 100 and is considered …

Read more

Keltner Channels: Explained & Coded

Keltner Channels are a technical indicator that combines an exponential moving average with volatility-based envelopes set above and below the EMA at a fixed percentage of the same duration. Keltner Channels aims to identify the underlying price trend and over-extended …

Read more